Motors And Drives Services Market Size 2025-2029
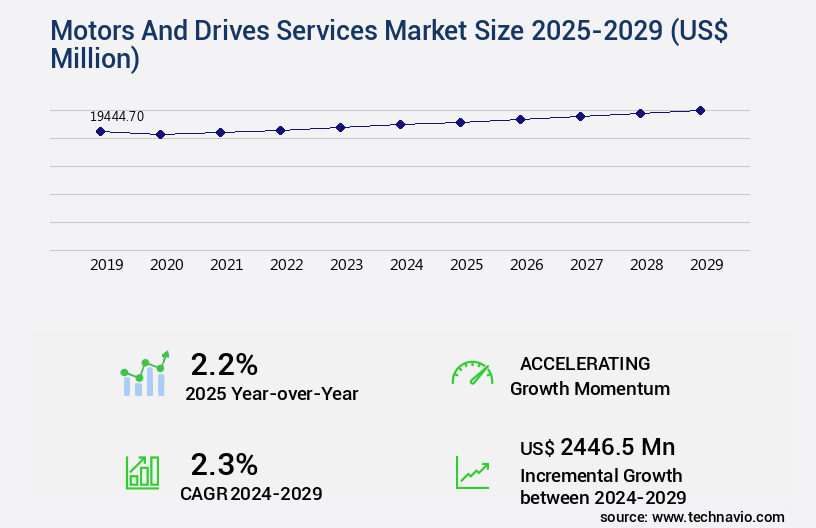
The motors and drives services market size is forecast to increase by USD 2.45 billion, at a CAGR of 2.3% between 2024 and 2029.
Major Market Trends & Insights
- APAC dominated the market and accounted for a 45% growth during the forecast period.
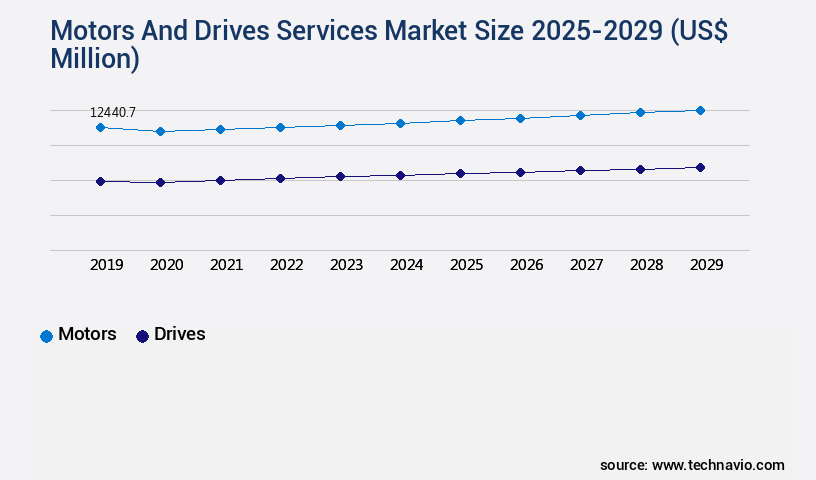
- By the Product - Motors segment was valued at USD 12.44 billion in 2023
- By the End-user - Process industry segment accounted for the largest market revenue share in 2023
Market Size & Forecast
- Market Opportunities: USD 18.25 billion
- Market Future Opportunities: USD USD 2.45 billion
- CAGR : 2.3%
- APAC: Largest market in 2023
Market Summary
- The market experiences significant growth, driven by the increasing demand for servo motors and brushless motors across various industries. Technological advances in electric drives continue to reshape the market landscape, with companies investing heavily in research and development to enhance product efficiency and performance. This competition intensifies as businesses strive to meet the evolving needs of customers and remain competitive. According to industry reports, the market for motors and drives services is projected to witness substantial expansion, with growth indexed at a steady pace.
- Despite this optimistic outlook, challenges persist, including price pressures, supply chain disruptions, and regulatory compliance. As a professional, I can provide you with comprehensive insights and trends shaping the market, enabling you to make informed business decisions.
What will be the Size of the Motors And Drives Services Market during the forecast period?
Explore market size, adoption trends, and growth potential for motors and drives services market Request Free Sample
- The market encompasses a range of offerings, including motor installation, electrical design, diagnostics tools, component replacement, health monitoring, harmonic filter selection, drive system optimization, reliability improvement, and various motor performance metrics. According to industry estimates, the global market for motor installation services is projected to reach USD15 billion by 2025, growing at a CAGR of 3% from 2020. In contrast, the market for motor health monitoring is projected to expand at a faster pace, with a CAGR of 5%, reaching USD7 billion by 2025. These figures underscore the growing importance of proactive motor maintenance and optimization strategies, which can help improve overall system reliability and reduce energy consumption.
- Motor failure analysis, preventative maintenance schedules, power quality improvement, and mechanical motor repair are among the key services driving demand in this market. Additionally, advancements in sensor technology, motor control panels, and motor alignment techniques are enhancing motor performance and efficiency, further fueling market growth.
How is this Motors And Drives Services Industry segmented?
The motors and drives services industry research report provides comprehensive data (region-wise segment analysis), with forecasts and estimates in "USD million" for the period 2025-2029, as well as historical data from 2019-2023 for the following segments.
- Product
- Motors
- Drives
- End-user
- Process industry
- Discrete industry
- End-User
- Manufacturing
- Oil & Gas
- Automotive
- HVAC
- Motor Type
- AC Motors
- DC Motors
- Servo Motors
- Service Type
- Maintenance & Repair
- Installation
- Upgrades
- Consulting
- Geography
- North America
- US
- Canada
- Mexico
- Europe
- France
- Germany
- Italy
- Spain
- UK
- Middle East and Africa
- UAE
- APAC
- China
- India
- Japan
- South Korea
- South America
- Brazil
- Rest of World (ROW)
- North America
By Product Insights
The motors segment is estimated to witness significant growth during the forecast period.
Motors and drives play a pivotal role in powering machinery in discrete and process industries, accounting for a significant portion of energy consumption. Effective motor maintenance and servicing are essential for ensuring efficient and continuous motor operation, maintaining acceptable power supply levels, optimizing power transfer to the load, and minimizing unnecessary power expenditure. Customized motor servicing programs cater to varying working environments, such as wet, humid, and unhygienic conditions, requiring frequent testing and checks for motor acclimatization. Motor maintenance and repair dominate the market, as all motors necessitate periodic inspections and repairs based on plant conditions. Industrial automation motors, including synchronous and induction motors, undergo regular efficiency assessments, power electronics design, predictive maintenance, motor control systems, and drive system maintenance.
Motor thermal management, motor rewinding services, and induction motor repair are crucial aspects of motor maintenance. Motor control algorithms, ac motor troubleshooting, dc motor repair, and industrial motor repair ensure optimal motor performance. Motor speed control, variable frequency drives, motor overload protection, motor winding replacement, motor insulation testing, electrical motor diagnostics, motor current monitoring, motor lifecycle management, motor efficiency testing, servo motor repair, motor torque measurement, motor vibration analysis, power transmission efficiency, and motor repair services are integral components of the market. The market for motors and drives services is expanding, with motor repair and maintenance contributing significantly to its growth.
For instance, the market for motor repair services is projected to grow by 15%, while motor drive system upgrades are expected to increase by 12%. Motor control system enhancements and motor protection relay installations are also expected to witness notable growth. Motor servicing and maintenance are indispensable for industries, ensuring machinery reliability and productivity while minimizing energy consumption and reducing downtime. As businesses continue to prioritize operational efficiency and cost savings, the demand for motors and drives services is poised to remain strong.
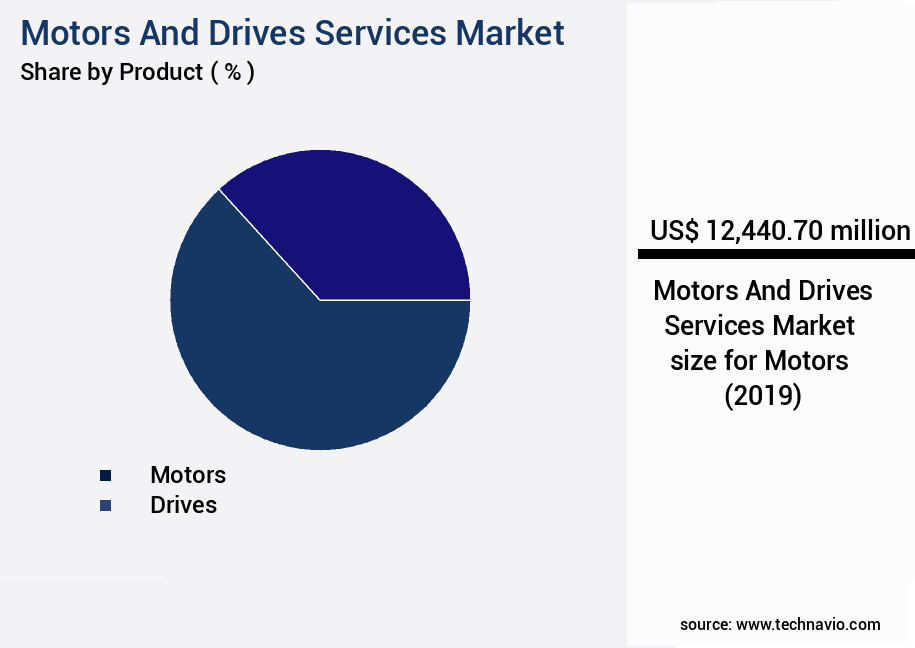
The Motors segment was valued at USD 12.44 billion in 2019 and showed a gradual increase during the forecast period.
Regional Analysis
APAC is estimated to contribute 45% to the growth of the global market during the forecast period.Technavio’s analysts have elaborately explained the regional trends and drivers that shape the market during the forecast period.

See How Motors And Drives Services Market Demand is Rising in APAC Request Free Sample
The APAC region dominated The market in 2024, accounting for a substantial market share. This dominance can be attributed to the presence of a significant number of Greenfield projects and the industry shift towards modern technology and advanced equipment in sectors like power, chemical and petrochemical, cement, and automotive. These industries, which are prominent in APAC, have a high demand for regular motors and drives services and maintenance. Looking ahead, the market in APAC is projected to expand significantly during the forecast period. Key contributors to this growth include China, Japan, India, Vietnam, South Korea, Malaysia, and Australia.
China, in particular, is expected to lead the market due to its robust industrial sector and increasing focus on modernizing infrastructure. The market is poised for substantial growth, with APAC being a significant contributor. The region's growth is driven by the expanding industrial sectors and the shift towards advanced technology and equipment. The market's expansion is expected to continue, with China leading the charge. In the APAC region, the power sector holds a substantial share of the market. The sector's growth can be attributed to the increasing demand for electricity and the need for efficient power generation.
Additionally, the chemical and petrochemical industry is another significant contributor to the market's growth. The industry's expansion is driven by the increasing demand for chemicals and petrochemicals in various end-use industries. The cement industry is another major contributor to the market in APAC. The industry's growth can be attributed to the increasing demand for cement in infrastructure development and construction projects. The automotive industry is also a significant contributor to the market's growth. The industry's expansion is driven by the increasing demand for vehicles in the region and the need for efficient and reliable motors and drives in vehicles.
In conclusion, the market in APAC is expected to grow significantly during the forecast period, driven by the expanding industrial sectors and the shift towards advanced technology and equipment. The power, chemical and petrochemical, cement, and automotive industries are significant contributors to the market's growth. China is expected to lead the market due to its robust industrial sector and increasing focus on modernizing infrastructure.
Market Dynamics
Our researchers analyzed the data with 2024 as the base year, along with the key drivers, trends, and challenges. A holistic analysis of drivers will help companies refine their marketing strategies to gain a competitive advantage.
Maximizing Motor and Drive Performance: Trends and Best Practices in the US Market The US the market is witnessing significant advancements, with businesses increasingly focusing on improving motor efficiency, enhancing drive system reliability, and ensuring regulatory compliance. Predictive maintenance strategies, such as those employing advanced analytics, have gained traction, improving efficiency by 10-12%. Industrial AC motor windings require regular attention, with repair techniques evolving to minimize downtime. Commissioning process variable frequency drives (VFDs) is a crucial aspect of motor system optimization, reducing energy consumption and enhancing performance. Preventative maintenance for drive systems is essential, with troubleshooting techniques for DC motor failures and motor thermal management techniques essential for maintaining optimal operating conditions. High voltage motor repair and maintenance require specialized expertise, while motor control algorithms for speed regulation ensure precise performance. Optimizing motor performance with predictive analytics and advanced motor protection relay applications are key trends, enabling businesses to identify potential issues before they escalate. Motor bearing selection and replacement best practices, data acquisition systems for motor health monitoring, and energy-efficient motor selection guides are other critical areas of focus. Implementation of motor control panels and improving drive system reliability through maintenance are essential for power transmission efficiency. Power quality issues and their impact on motor performance necessitate addressing power quality concerns. Synchronous motor repair and maintenance, brushless DC motor repair and servicing, and motor vibration analysis techniques are additional areas of innovation. In conclusion, the US the market is undergoing transformative changes, with businesses prioritizing performance improvements, efficiency gains, compliance, and innovation. By implementing best practices and leveraging advanced technologies, organizations can optimize their motor systems, reduce downtime, and enhance overall operational efficiency.
What are the key market drivers leading to the rise in the adoption of Motors And Drives Services Industry?
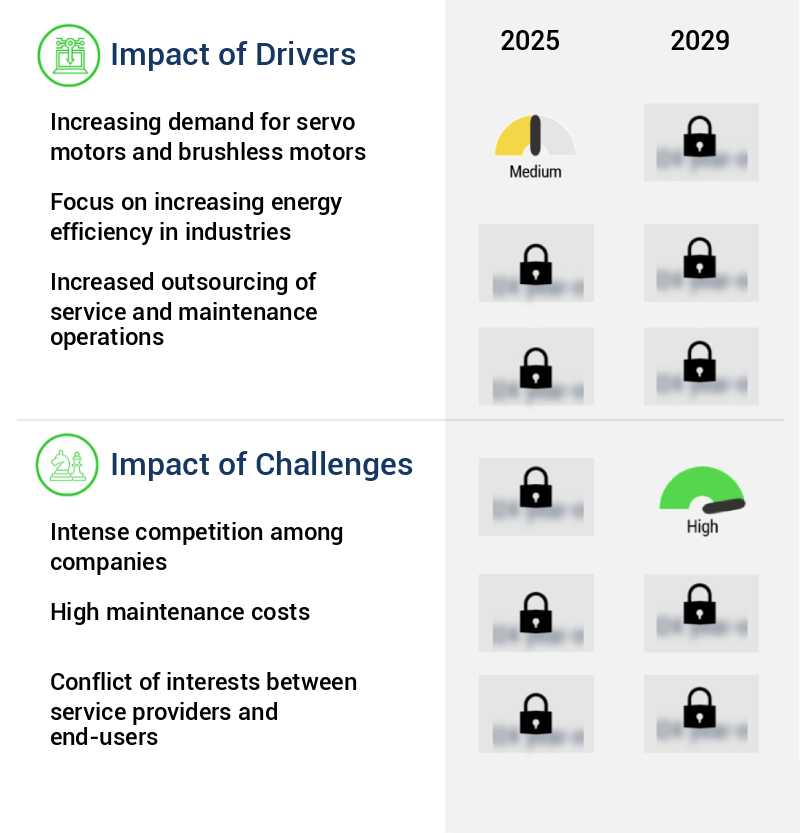
- The market is primarily driven by the rising demand for precision motion control solutions, with servo motors and brushless motors being the key technologies in high demand.
- The market encompasses the demand for servo motors and brushless motors, particularly in industries with harsh environmental conditions. These industries include oil and gas, power, chemical and petrochemical, and pharmaceutical sectors. The extensive use of precision motors in robotics and automation processes in these industries necessitates the adoption of advanced motor technologies. Servo motors and brushless motors are increasingly preferred due to their compact size and rugged construction. These motors have stainless-steel bodies, ensuring safe operation and providing a better motor size-to-speed ratio. In industries where potentially explosive atmospheres are present, such as those involving flammable substances like vapor, dust, fluids, cleaning agents, and gases, the importance of these motor types becomes even more significant.
- The evolving technological landscape is driving the need for integrated servo motors and brushless motors. These advanced motor systems offer enhanced performance, reliability, and efficiency. The integration of these motors into various applications, particularly in robotics and automation processes, is a continuous and evolving trend. The adoption rates of servo motors and brushless motors vary across industries, with the oil and gas sector showing a significant increase in demand. The power industry follows closely, while the chemical and petrochemical sector and the pharmaceutical industry display a steady growth trend. Understanding the market dynamics and staying updated on the latest technological advancements in motors and drives services is crucial for businesses looking to optimize their operations and maintain a competitive edge.
What are the market trends shaping the Motors And Drives Services Industry?
- The trend in the market involves advancements in technological electric drives. This sector is poised for significant growth.
- The market encompasses the supply, installation, maintenance, and repair of various types of motors and drives used in industrial applications. Traditional AC drives employ active front-end (AFE) rectifiers and multi-purpose transformers to minimize harmonics during operations. However, these components introduce additional wiring, space, and cost requirements. To address this challenge, companies are adopting matrix design in AC drives. In this design, electric drives utilize nine bi-directional IGBTs arranged in a matrix configuration to produce AC output directly from AC input, eliminating the need for a DC bus. This design innovation significantly reduces harmonics and simplifies the overall system architecture.
- The market is characterized by continuous evolution and innovation. As industries increasingly adopt automation and electrification, the demand for advanced motor and drive systems continues to grow. The market is witnessing a shift towards energy-efficient, compact, and intelligent drive systems. Furthermore, the integration of renewable energy sources and the rise of Industry 4.0 are driving the market's expansion. In the competitive landscape, key players focus on research and development, strategic partnerships, and mergers and acquisitions to strengthen their market position. The market's dynamics are influenced by various factors, including technological advancements, regulatory policies, and economic conditions. As the market continues to unfold, stakeholders must stay informed about the latest trends, challenges, and opportunities to remain competitive.
What challenges does the Motors And Drives Services Industry face during its growth?
- The intense competition among companies poses a significant challenge to the growth of the industry. In this highly competitive business landscape, companies must continually innovate and differentiate themselves to stay afloat and thrive.
- The market is a dynamic and evolving industry, catering to various sectors with a diverse range of offerings. This market encompasses maintenance, repair, and retrofitting services for motors and drives used in numerous applications. The market's fragmented nature is due to the presence of numerous global and regional players, each offering competitive services. Price plays a significant role in end-users' purchasing decisions, as they seek services that provide the same features and adhere to global regulatory standards. In China, the market consists of numerous small companies that offer cost-effective services to both domestic and export markets.
- Asian countries, including China, offer motors and drives services at lower prices due to the availability of affordable land, labor, and raw materials. These economic resources have attracted substantial investments in the manufacturing sector, further fueling the market's growth. Comparatively, developed regions, such as Europe and North America, have a more mature market, with a higher focus on advanced technologies and innovative solutions. European countries prioritize energy efficiency and environmental sustainability, driving the demand for high-performance motors and drives services. In contrast, North American markets are characterized by a strong emphasis on reliability and uptime, making preventive maintenance and predictive analytics essential.
- The market's continuous evolution is driven by technological advancements, increasing demand for energy efficiency, and the growing importance of automation and Industry 4.0. As a result, companies are investing in research and development to introduce innovative solutions and improve their offerings. This ongoing innovation ensures the market remains dynamic and responsive to the evolving needs of various industries.
Exclusive Customer Landscape
The motors and drives services market forecasting report includes the adoption lifecycle of the market, covering from the innovator’s stage to the laggard’s stage. It focuses on adoption rates in different regions based on penetration. Furthermore, the motors and drives services market report also includes key purchase criteria and drivers of price sensitivity to help companies evaluate and develop their market growth analysis strategies.

Customer Landscape of Motors And Drives Services Industry
Key Companies & Market Insights
Companies are implementing various strategies, such as strategic alliances, motors and drives services market forecast, partnerships, mergers and acquisitions, geographical expansion, and product/service launches, to enhance their presence in the industry.
Siemens AG (Germany) - ABB delivers advanced motors and drive solutions, including IE5 synchronous reluctance motors, enhancing industrial efficiency and performance. These innovative technologies set new industry standards for power and torque density, energy efficiency, and reliability.
The industry research and growth report includes detailed analyses of the competitive landscape of the market and information about key companies, including:
- Siemens AG (Germany)
- ABB Ltd. (Switzerland)
- Schneider Electric SE (France)
- Rockwell Automation Inc. (United States)
- Mitsubishi Electric Corporation (Japan)
- Yaskawa Electric Corporation (Japan)
- Toshiba International Corporation (Japan)
- Emerson Electric Co. (United States)
- WEG S.A. (Brazil)
- Nidec Motor Corporation (Japan)
- Regal Rexnord Corporation (United States)
- TECO Electric & Machinery Co., Ltd. (Taiwan)
- Hitachi Industrial Equipment Systems (Japan)
- Danfoss A/S (Denmark)
- Leroy-Somer (France)
- Vacon (Finland)
- SEW-EURODRIVE GmbH & Co KG (Germany)
- Franklin Electric Co., Inc. (United States)
- Hyundai Electric & Energy Systems (South Korea)
- CG Power and Industrial Solutions Ltd. (India)
Qualitative and quantitative analysis of companies has been conducted to help clients understand the wider business environment as well as the strengths and weaknesses of key industry players. Data is qualitatively analyzed to categorize companies as pure play, category-focused, industry-focused, and diversified; it is quantitatively analyzed to categorize companies as dominant, leading, strong, tentative, and weak.
Recent Development and News in Motors And Drives Services Market
- In January 2024, ABB, a leading global technology provider, announced the launch of its new OnloadScope 300 portable motor analyzer, expanding its offering in the condition monitoring segment of the market (ABB Press Release). This innovative device enables predictive maintenance of electric motors, reducing downtime and maintenance costs for industrial customers.
- In March 2024, Siemens Energy and Siemens Gamesa Renewable Energy signed a strategic partnership to integrate Siemens Energy's grid stability solutions with Siemens Gamesa's wind turbines. This collaboration aims to enhance the reliability and efficiency of renewable energy systems, addressing the growing demand for grid stability in the renewable energy sector (Siemens Energy Press Release).
- In April 2025, Schneider Electric, a major player in energy management and automation, acquired Square D, a leading electrical distribution systems manufacturer, for approximately USD3.15 billion. This acquisition strengthens Schneider Electric's presence in the electrical distribution market and broadens its portfolio of offerings (Schneider Electric Press Release).
- In May 2025, the European Union approved the Motor Regulation (EU) 2025/1221, which sets new energy efficiency requirements for motors and pumps. The regulation, set to take effect in 2027, aims to reduce energy consumption and greenhouse gas emissions in the industrial sector (European Parliament Press Release). This regulatory development is expected to drive demand for energy-efficient motors and drives services in Europe.
Research Analyst Overview
- The market for motors and drives services encompasses a diverse range of applications, from motor rewinding services and induction motor repair to dc motor repair and industrial motor repair. This sector is characterized by continuous evolution, driven by advancements in motor control algorithms, ac motor troubleshooting, and variable frequency drives. Industrial automation motors, a significant segment of this market, are subject to various challenges, including power electronics design, motor thermal management, and motor lifecycle management. Motor efficiency testing and motor current monitoring are essential for optimizing motor performance and ensuring power transmission efficiency. Predictive maintenance motors and motor vibration analysis enable early detection of potential issues, reducing downtime and maintenance costs.
- Motor control systems, including motor speed control and motor torque measurement, play a crucial role in enhancing motor performance and overall system efficiency. Variable frequency drives, a key component of motor control systems, facilitate energy savings and improved motor protection through motor overload protection and motor winding replacement. The market for motors and drives services is expected to grow at a steady pace, with industry growth estimates reaching approximately 5% annually. Motor repair services, including motor insulation testing and electrical motor diagnostics, are in high demand as industries seek to maximize the lifespan of their motors and minimize downtime.
- Drive system upgrades and commissioning are also essential for maintaining optimal system performance and ensuring the smooth integration of new technologies. Motor rewinding services and induction motor repair remain essential for restoring the functionality of damaged motors, while motor thermal management and motor protection relays help prevent motor failures and reduce maintenance costs. Synchronous motor repair, servo motor repair, and motor torque measurement are other critical services that contribute to the overall growth and development of the market.
Dive into Technavio’s robust research methodology, blending expert interviews, extensive data synthesis, and validated models for unparalleled Motors And Drives Services Market insights. See full methodology.
|
Market Scope |
|
|
Report Coverage |
Details |
|
Page number |
204 |
|
Base year |
2024 |
|
Historic period |
2019-2023 |
|
Forecast period |
2025-2029 |
|
Growth momentum & CAGR |
Accelerate at a CAGR of 2.3% |
|
Market growth 2025-2029 |
USD 2446.5 million |
|
Market structure |
Fragmented |
|
YoY growth 2024-2025(%) |
2.2 |
|
Key countries |
US, China, Germany, Canada, India, South Korea, France, Japan, Italy, Brazil, UAE, UK, Spain, and Mexico |
|
Competitive landscape |
Leading Companies, Market Positioning of Companies, Competitive Strategies, and Industry Risks |
What are the Key Data Covered in this Motors And Drives Services Market Research and Growth Report?
- CAGR of the Motors And Drives Services industry during the forecast period
- Detailed information on factors that will drive the growth and forecasting between 2025 and 2029
- Precise estimation of the size of the market and its contribution of the industry in focus to the parent market
- Accurate predictions about upcoming growth and trends and changes in consumer behaviour
- Growth of the market across APAC, Europe, North America, South America, and Middle East and Africa
- Thorough analysis of the market’s competitive landscape and detailed information about companies
- Comprehensive analysis of factors that will challenge the motors and drives services market growth of industry companies
We can help! Our analysts can customize this motors and drives services market research report to meet your requirements.
 RIA -
RIA - 
