Motor Management Market Size 2025-2029
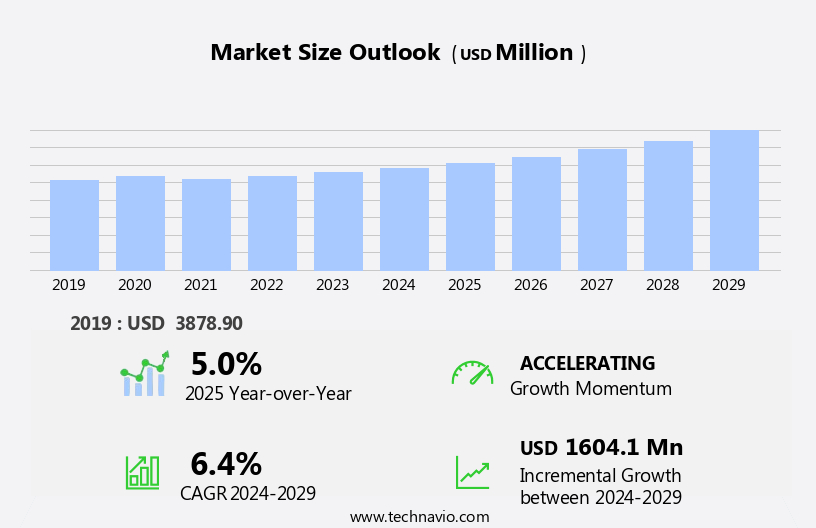
The motor management market size is forecast to increase by USD 1.6 billion at a CAGR of 6.4% between 2024 and 2029.
- The market is experiencing significant growth due to the digitalization of industrial processes and the increasing adoption of smart motor systems. Product launches of advanced motor control technologies are further driving market expansion. However, the high initial costs associated with implementing these systems may hinder market growth for some businesses. The trend towards energy efficiency and sustainability also influences the market, as motor management solutions help reduce energy consumption and minimize maintenance costs. Mobile POS systems, barcode scanner integration, and mobile workforce solutions enable remote data capture and inventory management, while mobile device security ensures the protection of sensitive patient information.
- In addition, the integration of IoT and artificial intelligence technologies in motor management systems is enabling predictive maintenance and optimizing motor performance, making them essential for industries seeking to enhance operational efficiency and productivity. Overall, the market is poised for strong growth, with digitalization, product innovation, and energy efficiency being key drivers.
What will be the Size of the Market During the Forecast Period?
- The market is experiencing significant shifts as a result of increasing commoditization and the integration of advanced technologies. One of the most notable trends is the adoption of inexpensive supplies, such as RFID-printed labels, for use in Point of Sale (POS) systems. This shift towards competitive pricing is driving innovation in the market, with companies focusing on industrializing production processes and on-demand printing. The healthcare sector is a major contributor to this trend, as RFID technology enables more efficient patient flow and data capture. Automatic identification technologies, including RFID and barcode, are becoming increasingly essential for managing assets and optimizing infrastructure in production centers.
- The use of wireless technologies, such as mobile printers and handheld terminals, is also on the rise. These devices offer cost-effectiveness and convenience, allowing businesses to streamline operations and improve user experience. However, the market is becoming increasingly competitive, with companies vying for market share through value-added products and services. The declining prices of RFID and other data capture innovations are making it easier for retail stores to implement these technologies, even in the face of nationwide lockdowns. The use of tags and labels for product security and functionality is becoming more widespread, as businesses seek to enhance their commerce capabilities and improve their overall value proposition.
-
In the transportation and distribution sector, RFID is being used to optimize supply chain management and improve logistics. The use of these technologies is helping to streamline operations and reduce costs, making it an essential component of modern business infrastructure. Overall, the market is undergoing significant change, driven by the need for cost-effectiveness, efficiency, and innovation. The integration of RFID and other advanced technologies is enabling businesses to capture and utilize data in new and exciting ways, improving operational efficacy and enhancing the user experience.
How is this market segmented and which is the largest segment?
The market research report provides comprehensive data (region-wise segment analysis), with forecasts and estimates in "USD billion" for the period 2025-2029, as well as historical data from 2019-2023 for the following segments.
- Type
- AC motors
- DC motors
- End-user
- Oil and gas
- Power generation
- Water and wastewater treatment
- Chemicals and petrochemicals
- Others
- Geography
- APAC
- China
- India
- Japan
- South Korea
- North America
- Canada
- US
- Europe
- Germany
- UK
- France
- South America
- Brazil
- Middle East and Africa
- APAC
By Type Insights
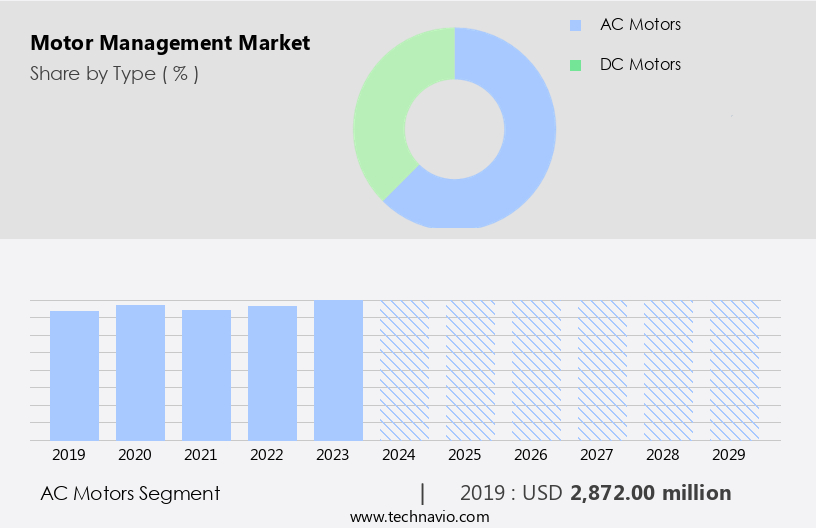
- The AC motors segment is estimated to witness significant growth during the forecast period.
The market encompasses various motor types, with AC motors holding a substantial share due to their extensive usage across industries. AC motors, recognized for their efficiency and dependability, play a pivotal role in the operation of diverse industrial processes. In July 2023, ABB unveiled the latest NEMA motor offering, the AMI 5800, in Finland and Europe. This launch underscores the continuous innovation in AC motor technology, focusing on enhanced energy efficiency and strong performance in challenging conditions. The AMI 5800 adheres to NEMA standards, ensuring compatibility and reliability in severe environments, which is crucial for sectors such as power generation, chemical processing, oil and gas, mining, and metals. This development underscores the market's growth trajectory and the ongoing commitment to advancements in AC motor technology.
Get a glance at the market report of share of various segments Request Free Sample
The AC motors segment was valued at USD 2.87 billion in 2019 and showed a gradual increase during the forecast period.
Regional Analysis
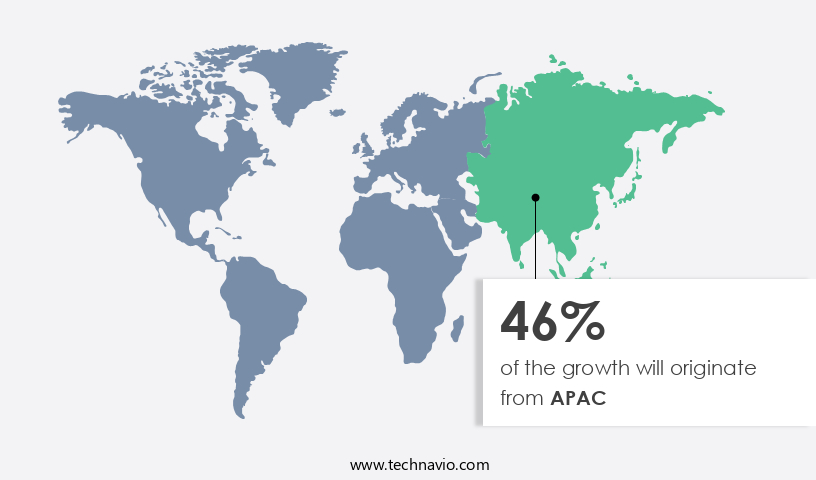
- APAC is estimated to contribute 46% to the growth of the global market during the forecast period.
Technavio's analysts have elaborately explained the regional trends and drivers that shape the market during the forecast period.
For more insights on the market share of various regions Request Free Sample
The Asia Pacific region is a major contributor to The market, driven by substantial investments in renewable energy and government initiatives to enhance energy efficiency and sustainability. Countries such as India and China are leading this transition, implementing ambitious plans to expand their renewable energy capacities and modernize their energy infrastructure. In India, the government has launched various initiatives to promote and accelerate the adoption of renewable energy, with a goal of achieving 500 GW of installed electric capacity from non-fossil sources by 2030.
Motor management solutions, including patient flow optimization, thermal printer software, wireless printing solutions, thermal printer supplies, RFID label printers, and asset tracking software, play a crucial role in the efficient operation and management of renewable energy systems and healthcare facilities in the region. These solutions enable real-time monitoring, data analysis, and automation, contributing to improved energy management, cost savings, and operational efficiency.
Market Dynamics
Our researchers analyzed the data with 2024 as the base year, along with the key drivers, trends, and challenges. A holistic analysis of drivers will help companies refine their marketing strategies to gain a competitive advantage.
What are the key market drivers leading to the rise in adoption of Motor Management Market?
Digitalization of industrial processes is the key driver of the market.
- The digitalization of industrial processes, including motor management, is experiencing significant growth due to the global trend toward increased efficiency, productivity, and innovation. This shift is driven by the widespread adoption of digital transformation strategies across various industries, with digital spending projected to reach USD2.8 trillion by 2025. Digital technologies are playing a crucial role in modernizing motor management, offering substantial growth opportunities. Patient flow optimization is a key area of focus, with thermal printer software and wireless printing solutions enabling real-time data capture and processing. RFID label printers and asset tracking software are essential components of healthcare asset tracking, ensuring accurate and efficient management of medical equipment and supplies.
- Furthermore, patient identification systems, utilizing RFID label design and barcode printing solutions, facilitate cost-effective and secure data capture. High-resolution graphics and mobile printing solutions, including label printing software and wireless printing, enhance the patient experience and streamline healthcare data management.AIDC technology, including RFID tag printing and barcode technology, plays a vital role in product tracking and medicine allergy management.
- In conclusion, mobile device accessories, mobile device management, and mobile device deployment support the implementation of digital transformation strategies in healthcare. Remote access and mobile device repair services ensure uninterrupted operations and minimize downtime. The impact of digital transformation on motor management extends beyond healthcare, with retail experiences, field service management, and mobile device training also benefiting from these advancements. The digitalization of motor management is a critical component of the broader trend toward industrial digitalization, offering significant opportunities for growth and innovation.
What are the market trends shaping the Motor Management Market?
Product launches are the upcoming trends in the market.
- The market in the US healthcare sector is experiencing notable progress, with a focus on enhancing patient flow optimization and data management. Key industry players are introducing innovative solutions to improve energy efficiency and reliability in motor management systems. For instance, ABB launched IEC Low Voltage IE4 cast iron super premium efficiency motors in April 2024, available in 71-132 frame sizes. These motors deliver superior energy efficiency and strong performance. Furthermore, ABB expanded its portfolio with IE3 Aluminum Motors, targeting the Indian market in 71-90 frame sizes. Advancements in thermal printer software and wireless printing solutions are also shaping the market. RFID label printers and asset tracking software are increasingly being adopted for healthcare asset tracking and patient identification systems. High-resolution graphics and barcode printing solutions enable cost-effective printing and data capture.
- Furthermore, RFID tag printing and label design are essential for barcode technology-based product tracking and medicine allergy management. Mobile printing, label printing software, and wireless printing solutions facilitate patient data management and remote data capture. Mobile POS systems, barcode scanner integration, and mobile workforce solutions enable efficient patient tracking and inventory management. Medical equipment tracking, mobile device support, and medical history management are crucial applications for healthcare data collection and mobile devices. Mobile device accessories, mobile device management, and mobile device security are essential for ensuring the functionality and security of healthcare mobile devices. AIDC technology, field service management, mobile device training, and remote access are vital for optimizing the performance of motor management systems and enhancing operational efficiency.
What challenges does Motor Management Market face during the growth?
High initial costs are key challenges affecting the market growth.
- The market encompasses solutions designed to optimize patient flow and manage healthcare assets through technologies such as thermal printer software, wireless printing solutions, RFID label printers, and asset tracking software. These tools facilitate healthcare data management, including patient identification systems, RFID label design, and barcode printing solutions. While cost-effective printing options are available, the initial investment in motor management systems can be substantial, with expenses related to thermal printer solutions, data capture, and RFID label printing adding up. Motor management software, which ranges from USD 5,000 to USD 50,000 per year, is a significant component of these costs. This software is crucial for monitoring motor performance and optimizing energy efficiency.
- However, the high upfront expenses can deter smaller enterprises from implementing these systems. Other costs include motor energy efficiency upgrades and mobile printing solutions, such as mobile POS systems, barcode scanner integration, and mobile workforce solutions. Inventory management, medical equipment tracking, and patient tracking are further benefits of motor management systems, which can lead to improved operational efficiency and cost savings in the long run.
Exclusive Customer Landscape
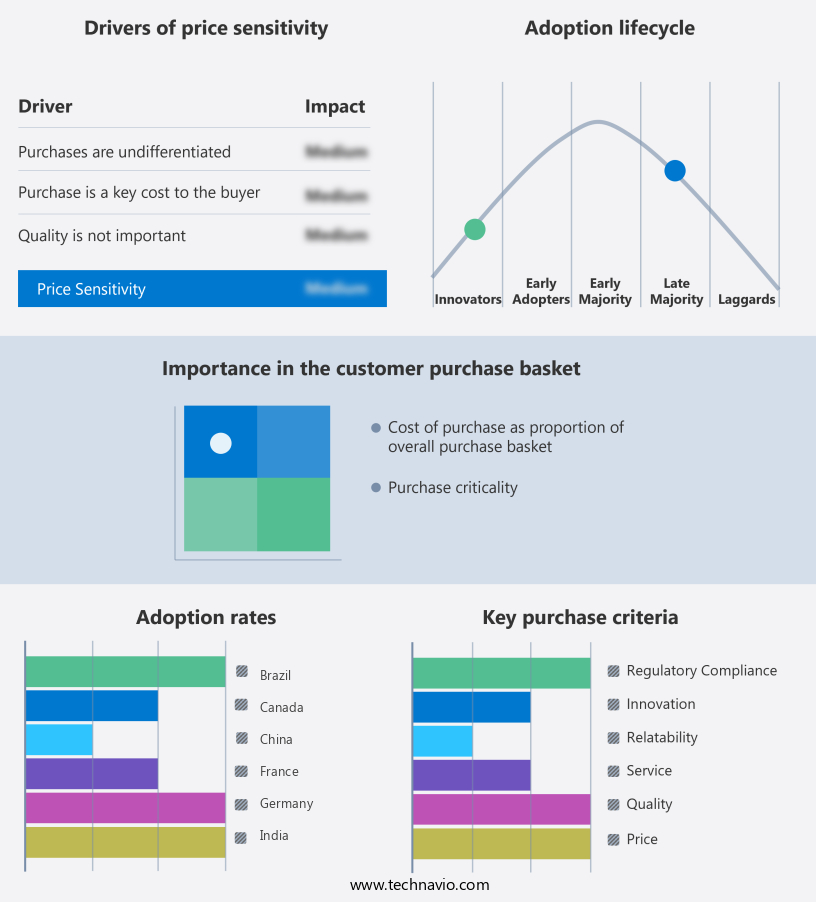
The market forecasting report includes the adoption lifecycle of the market, covering from the innovator's stage to the laggard's stage. It focuses on adoption rates in different regions based on penetration. Furthermore, the market report also includes key purchase criteria and drivers of price sensitivity to help companies evaluate and develop their market growth analysis strategies.
Customer Landscape
Key Companies & Market Insights
Companies are implementing various strategies, such as strategic alliances, market forecast, partnerships, mergers and acquisitions, geographical expansion, and product/service launches, to enhance their presence in the market.
ABB Ltd. - The company offers motor management such as M10x intelligent motor management system, universal motor controllers, and MNS motor management INSUM.
The market research and growth report includes detailed analyses of the competitive landscape of the market and information about key companies, including:
- ABB Ltd.
- AMETEK Inc.
- Danfoss AS
- Eaton Corp plc
- Fuji Electric Co. Ltd.
- GE Vernova Inc.
- Kollmorgen Corp.
- Lenze SE
- Mitsubishi Electric Corp.
- Parker Hannifin Corp.
- Robert Bosch GmbH
- Rockwell Automation Inc.
- Schneider Electric SE
- Siemens AG
- Toshiba Electronic Devices and Storage Corp.
- WEG S.A
Qualitative and quantitative analysis of companies has been conducted to help clients understand the wider business environment as well as the strengths and weaknesses of key market players. Data is qualitatively analyzed to categorize companies as pure play, category-focused, industry-focused, and diversified; it is quantitatively analyzed to categorize companies as dominant, leading, strong, tentative, and weak.
Research Analyst Overview
The market in the healthcare sector is a critical yet intricate domain, encompassing various technologies and solutions that facilitate the smooth operation of healthcare facilities. This market is characterized by continuous innovation and advancements, driven by the need for improved patient care, data management, and operational efficiency. One of the primary focus areas in motor management for healthcare is patient flow optimization. This involves streamlining the process of patient registration, tracking, and identification to ensure a seamless experience for patients and healthcare providers.
Furthermore, thermal printer software and label printing solutions play a pivotal role in this process, enabling the production of accurate and legible labels for patient identification, medication tracking, and asset management. Another essential aspect of motor management in healthcare is thermal printer supplies and RFID label printers. These technologies enable the creation of durable and reliable labels for various applications, such as asset tracking and product tracking. RFID tag printing and design are crucial components of this process, ensuring that the tags are optimally designed for various applications and environments. Healthcare asset tracking is another critical area where motor management solutions have made significant strides.
In summary, RFID technology has emerged as a popular choice for asset tracking, enabling real-time location tracking and automated data capture. This not only improves operational efficiency but also enhances patient safety and security. Barcode printing solutions are another key component of motor management in healthcare. These solutions facilitate cost-effective and efficient data capture, enabling the automation of various processes, such as medication administration, inventory management, and medical history tracking. High-resolution graphics and barcode technology ensure that the data captured is accurate and legible, reducing the risk of errors and improving overall patient care. Mobile printing and label printing software are increasingly becoming essential components of motor management in healthcare.
|
Market Scope |
|
|
Report Coverage |
Details |
|
Page number |
213 |
|
Base year |
2024 |
|
Historic period |
2019-2023 |
|
Forecast period |
2025-2029 |
|
Growth momentum & CAGR |
Accelerate at a CAGR of 6.4% |
|
Market growth 2025-2029 |
USD 1.60 billion |
|
Market structure |
Fragmented |
|
YoY growth 2024-2025(%) |
5.0 |
|
Key countries |
US, China, Japan, Germany, India, Brazil, Canada, UK, South Korea, and France |
|
Competitive landscape |
Leading Companies, Market Positioning of Companies, Competitive Strategies, and Industry Risks |
What are the Key Data Covered in this Market Research and Growth Report?
- CAGR of the market during the forecast period
- Detailed information on factors that will drive the market growth and forecasting between 2025 and 2029
- Precise estimation of the size of the market and its contribution of the market in focus to the parent market
- Accurate predictions about upcoming market growth and trends and changes in consumer behaviour
- Growth of the market across APAC, North America, Europe, South America, and Middle East and Africa
- Thorough analysis of the market's competitive landscape and detailed information about companies
- Comprehensive analysis of factors that will challenge the growth of market companies
We can help! Our analysts can customize this market research report to meet your requirements. Get in touch
 RIA -
RIA - 
