Multi-Cancer Early Detection Market Analysis North America, Europe, Asia, Rest of World (ROW) - US, Germany, Japan, UK, China, Canada, France, India, Italy, Spain - Size and Forecast 2025-2029

Multi-Cancer Early Detection Market Analysis North America, Europe, Asia, Rest of World (ROW) - US, Germany, Japan, UK, China, Canada, France, India, Italy, Spain - Size and Forecast 2025-2029

Published: Nov 2024 202 Pages SKU: IRTNTR80406

Market Overview at a Glance

$1.29 B
Market Opportunity
15.4%
CAGR
14.6
YoY growth 2024-2025(%)

Multi-Cancer Early Detection Market Size 2025-2029 

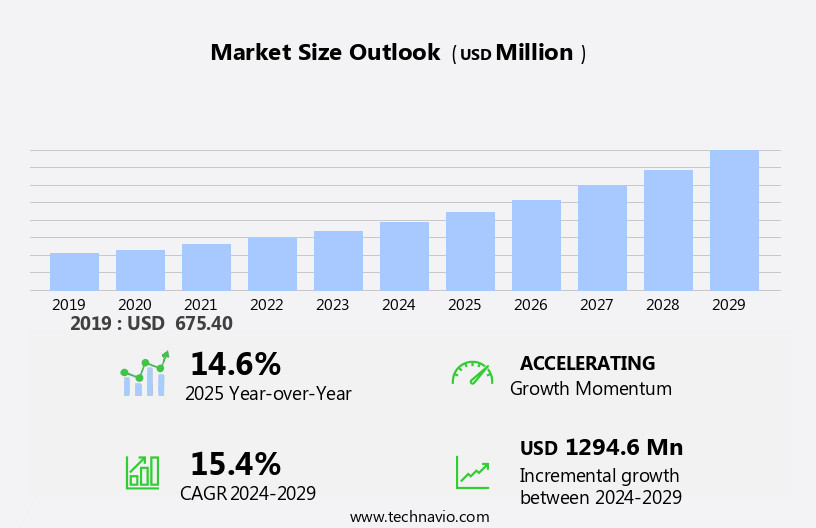
The multi-cancer early detection market size is forecast to increase by USD 1.29 billion at a CAGR of 15.4% between 2024 and 2029.

  • The market is experiencing significant growth due to the rising prevalence of cancer and the focus on developing innovative diagnostic tools. Next-generation sequencing technologies are revolutionizing the identification of cancer-related biomarkers, including DNA, RNA, and proteins, enabling the detection of genetic mutations at an early stage. However, limited insurance coverage poses a challenge to market growth. To address this, data analytics plays a crucial role in improving diagnostic accuracy and reducing healthcare costs. Biomarkers, whether DNA-based or protein-based, are essential for the early detection of various types of cancer. The market is expected to continue its expansion as advancements in technology and research lead to more accurate and cost-effective diagnostic solutions.

What will be the Size of the Market During the Forecast Period?

Multi-Cancer Early Detection Market Size

 Request Free Sample

  • The market is witnessing significant growth due to the increasing prevalence of cancer and the need for effective screening methods. Early detection of cancer can lead to improved patient survival rates and reduced mortality. Several technological advancements are driving the market. These include the use of nanotechnology for enhancing the sensitivity and specificity of diagnostic tools, big data analytics for identifying cancer-related biomarkers, and machine learning algorithms for analyzing genomic and proteomic data. Next-generation sequencing technologies, such as genome sequencing and RNA sequencing, are playing a crucial role in the discovery of genetic mutations associated with various types of cancer.
  • Liquid biopsies, which involve the analysis of DNA, RNA, and proteins present in bodily fluids, are gaining popularity as non-invasive screening methods for early cancer detection. Molecular signatures derived from genomic, proteomic, and biomarker data are being used to develop diagnostic tools for multi-cancer screening. These tools offer the potential for personalized treatment plans based on an individual's unique genetic profile. The integration of data from various sources, including electronic health records and wearable devices, is facilitating the development of more accurate and comprehensive diagnostic tools. This data can be analyzed using advanced data analytics techniques to identify patterns and trends that may indicate the presence of cancer.

How is this market segmented and which is the largest segment?

The market research report provides comprehensive data (region-wise segment analysis), with forecasts and estimates in "USD billion" for 2025-2029, as well as historical data from 2019-2023 for the following segments.
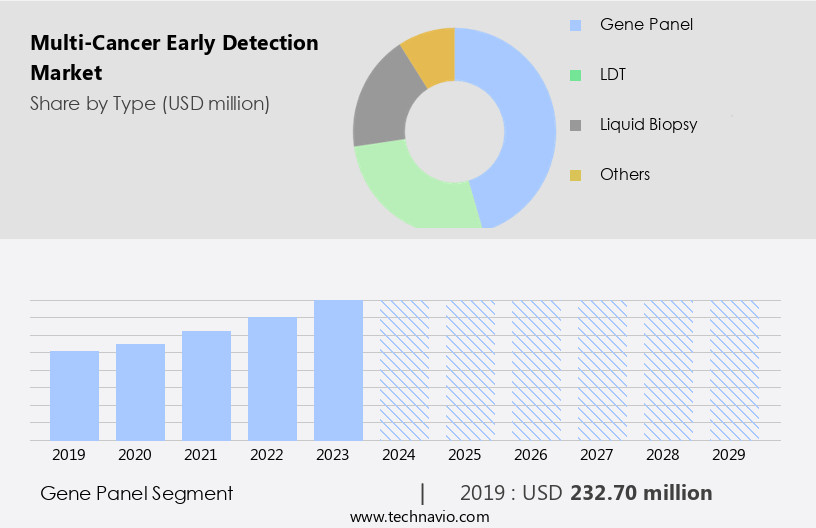
  • Type
    • Gene panel
    • LDT
    • Liquid biopsy
    • Others
  • End-user
    • Hospitals
    • Diagnostic laboratories
    • Others
  • Geography
    • North America
      • Canada
      • US
    • Europe
      • Germany
      • UK
      • France
      • Italy
      • Spain
    • Asia
      • China
      • India
      • Japan
    • Rest of World (ROW)

By Type Insights

  • The gene panel segment is estimated to witness significant growth during the forecast period.

In the realm of preventive healthcare, biotechnology firms are making significant strides in the market through breakthrough device designs. Gene panel testing is a vital segment of this industry, focusing on the analysis of specific genes to identify mutations linked to various cancer types. These panels play a crucial role in personalized cancer screening and prevention by targeting inherited gene alterations. Predictive genetic testing is a key application of gene panel testing. This testing assesses inherited mutations in individuals with a family history of cancer, such as BRCA1 and BRCA2 gene mutations, which increase the risk of breast, ovarian, and other cancers.

Similarly, Lynch syndrome testing identifies mutations in mismatch repair (MMR) genes, linked to colorectal and endometrial cancers. Biotechnology companies securing venture capital investments and collaborating with national screening programs are advancing precision medicine in cancer screening. This approach tailors treatment plans based on an individual's unique genetic makeup, enhancing overall patient care. Genome science is at the forefront of these advancements, offering a more targeted and effective approach to cancer prevention and early detection. In the US market, insurance coverage for gene panel testing is expanding, making these tests more accessible to a broader population. This trend is expected to fuel the growth of the market in the coming years.

Multi-Cancer Early Detection Market Size

Get a glance at the market report of share of various segments Request Free Sample

The Gene panel segment was valued at USD 232.70 million in 2019 and showed a gradual increase during the forecast period.

Regional Analysis

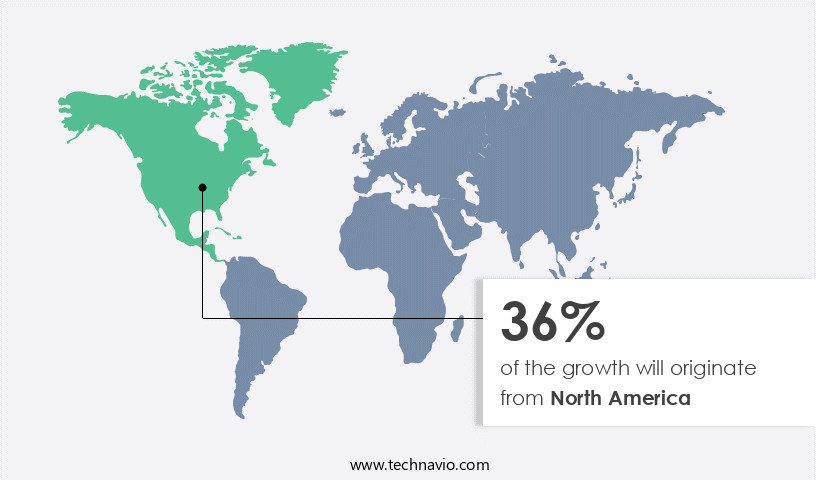
  • North America is estimated to contribute 36% to the growth of the global market during the forecast period.

Technavio's analysts have elaborately explained the regional trends and drivers that shape the market during the forecast period.

Multi-Cancer Early Detection Market Share by Geography

For more insights on the market share of various regions Request Free Sample

The United States plays a pivotal role in The market due to its high cancer incidence, advanced healthcare system, and substantial investments in cutting-edge diagnostic technologies. In 2023, approximately 2 million new cancer cases were diagnosed, and over 600,000 deaths were attributed to cancer in the US. This underscores the necessity for effective early detection methods. One significant initiative propelling the regional market is the POSEIDON program, launched by the US Advanced Research Projects Agency for Health (ARPA-H) on August 1, 2024. This initiative focuses on creating an at-home, synthetic multi-cancer early detection (MCED) test using breath and urine samples.

Nanotechnology, big data analytics, artificial intelligence, machine learning, and genome sequencing are integral components of this test. By employing these advanced technologies, the POSEIDON program aims to improve patient survival rates and decrease mortality rates, ultimately revolutionizing cancer screening methods.

Market Dynamics

Our researchers analyzed the data with 2024 as the base year, along with the key drivers, trends, and challenges. A holistic analysis of drivers will help companies refine their marketing strategies to gain a competitive advantage.

What are the key market drivers leading to the rise in adoption of Multi-Cancer Early Detection Market?

Rising cancer prevalence is the key driver of the market.

  • The market is experiencing significant growth due to the increasing prevalence of cancer. According to recent statistics, there were approximately 20 million new cancer cases diagnosed worldwide in 2022, resulting in 9.7 million deaths. This alarming rate of incidence and mortality highlights the urgent need for effective early detection methods. Cancer affects a substantial portion of the global population, with roughly one in five individuals developing the disease in their lifetime. The mortality rate is also concerning, with one in nine men and one in twelve women losing their lives to cancer. These statistics underscore the significant impact of cancer on individuals and healthcare systems worldwide.
  • Laboratories, hospitals, and diagnostic institutions are at the forefront of developing and implementing advanced multi-cancer early detection methods. These include Gene panels and Laboratory Developed Tests (LDTs), which enable precision oncology and personalized medicine approaches. The adoption of these technologies is increasing as healthcare institutions recognize the potential for early detection to improve patient outcomes and reduce healthcare costs. Multi-cancer early detection methods offer a promising solution to the global cancer crisis. By enabling early detection, these methods can help reduce mortality rates and improve the overall health of populations. As research and development efforts continue, it is expected that multi-cancer early detection will become an essential component of healthcare systems worldwide.

What are the market trends shaping the Multi-Cancer Early Detection Market?

Focus on new product development is the upcoming trend in the market.

  • The market is experiencing a notable advancement in diagnostic solutions, with next-generation sequencing playing a pivotal role. Companies are focusing on the development of innovative products utilizing cancer-related biomarkers derived from DNA, RNA, and proteins. One such recent innovation is LucenceINSIGHT, launched by Lucence on May 9, 2023, at its US headquarters in Palo Alto. This event, graced by the Deputy Prime Minister of Singapore, Heng Swee Keat, signifies a significant stride in the fight against cancer. LucenceINSIGHT is a ctDNA-based liquid biopsy test, designed to screen for ten common cancers through a single blood draw. This groundbreaking product aims to make early cancer detection more accessible and effective, ultimately reducing mortality rates by enabling early treatment. The use of next-generation sequencing technology in this test allows for a comprehensive analysis of genetic mutations, contributing to improved diagnostic accuracy. By focusing on advanced diagnostic tools and data analytics, the market is poised for substantial growth.

What challenges does Multi-Cancer Early Detection Market face during the growth?

Limited insurance coverage is a key challenge affecting the market growth.

  • In the multi-cancer early detection (MCED) market, limited insurance coverage poses a significant obstacle. Currently, the Centers for Medicare and Medicaid Services (CMS) do not cover MCED tests for reimbursement, and most health insurance plans do not provide coverage. As a result, individuals often bear the full cost of these tests, which can be financially burdensome. The average cost of MCED tests is approximately USD900, and additional diagnostic procedures may also result in out-of-pocket expenses. This lack of insurance coverage restricts the widespread adoption and accessibility of MCED tests. Some individuals may forego these potentially lifesaving tests due to the high costs, missing opportunities for early cancer detection and intervention.
  • Collaboration between research organizations and healthcare providers is crucial to address this issue and increase awareness about the importance of MCED tests. Lifestyle factors, such as alcohol consumption and smoking, contribute to cancer mortality. Early-stage cancer screening can significantly reduce cancer-related deaths. However, financial constraints hinder many individuals from accessing these tests. It is essential to advocate for insurance coverage and explore alternative funding options to make MCED tests more accessible and affordable.

Exclusive Customer Landscape

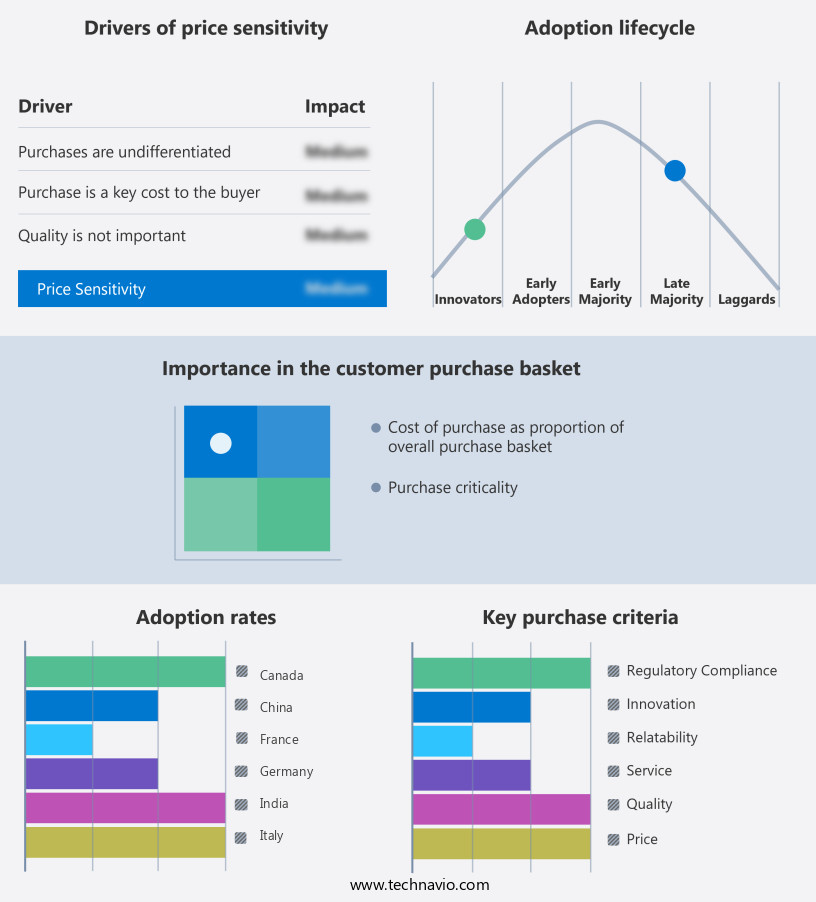
The market forecasting report includes the adoption lifecycle of the market, covering from the innovator's stage to the laggard's stage. It focuses on adoption rates in different regions based on penetration. Furthermore, the market report also includes key purchase criteria and drivers of price sensitivity to help companies evaluate and develop their market growth analysis strategies.

Multi-Cancer Early Detection Market Share by Geography

 Customer Landscape

Key Companies & Market Insights

Companies are implementing various strategies, such as strategic alliances, market forecast , partnerships, mergers and acquisitions, geographical expansion, and product/service launches, to enhance their presence in the market.

Adaptive Biotechnologies Corp. - The company offers multi-cancer early detection such as the clonoSEQ test, which detects MRD in bone marrow and blood from patients with multiple myeloma (MM), B-cell acute lymphoblastic leukaemia (B-ALL), and chronic lymphocytic leukaemia.

The market research and growth report includes detailed analyses of the competitive landscape of the market and information about key companies, including:

  • Adaptive Biotechnologies Corp.
  • Burning Rock Biotech Ltd.
  • EarlyDiagnostics
  • Elypta AB
  • Epigenomics AG
  • Exact Sciences Corp.
  • F. Hoffmann La Roche Ltd.
  • Freenome Holdings Inc.
  • GRAIL Inc.
  • Guardant Health Inc.
  • Lucence Health Inc.
  • Myriad Genetics Inc.
  • Natera Inc.
  • OncoCyte Corp
  • SeekIn Inc.
  • Singlera Genomics Inc.
  • StageZero Life Sciences Ltd.

Qualitative and quantitative analysis of companies has been conducted to help clients understand the wider business environment as well as the strengths and weaknesses of key market players. Data is qualitatively analyzed to categorize companies as pure play, category-focused, industry-focused, and diversified; it is quantitatively analyzed to categorize companies as dominant, leading, strong, tentative, and weak.

Research Analyst Overview

The market is witnessing significant growth due to the increasing burden of cancer worldwide and the advancements in diagnostic technologies. Early detection of cancer can lead to improved patient survival rates and reduced mortality. The integration of nanotechnology, big data analytics, artificial intelligence, and machine learning in cancer research is revolutionizing the field, enabling the development of new diagnostic tools. Liquid biopsies, gene panels, and laboratory developed tests are some of the diagnostic measures being used for early-stage cancer screening. These tests can detect cancer-related biomarkers, including DNA, RNA, proteins, and genetic mutations, in various bodily fluids. Collaboration activities between hospitals, diagnostic laboratories, research organizations, and biotechnology firms are driving innovation in the field.

Breakthrough device designations, venture capital investments, and insurance coverage for these tests are also boosting market growth. Preventive healthcare and personalized medicine are key areas of focus in the healthcare industry, and cancer screening is a critical component of these initiatives. Precision oncology, genome science, and genomics are playing a significant role in the development of personalized treatment plans based on tumor origin and protein profiles. The use of next-generation sequencing and molecular signatures in cancer research is enabling the identification of new biomarkers and diagnostic tools. Non-invasive screening methods are also gaining popularity due to their convenience and ease of use.

The global cancer burden is significant, with various types of cancer affecting millions of people worldwide. Early detection and intervention are crucial for improving patient outcomes and reducing cancer mortality. Lifestyle changes, such as reducing alcohol consumption and smoking, can also help prevent cancer. The integration of data analytics and data integration in cancer research is enabling the development of more accurate and effective diagnostic tools. Clinical trials and research in Alzheimer's disease, proteomics, and single-cancer screening are also contributing to the growth of the market.

Market Scope

Report Coverage

Details

Page number

202

Base year

2024

Historic period

2019-2023

Forecast period

2025-2029

Growth momentum & CAGR

Accelerate at a CAGR of 15.4%

Market growth 2025-2029

USD 1.29 billion

Market structure

Fragmented

YoY growth 2024-2025(%)

14.6

Key countries

US, Germany, Japan, UK, China, Canada, France, India, Italy, and Spain

Competitive landscape

Leading Companies, Market Positioning of Companies, Competitive Strategies, and Industry Risks

Request Free Sample

What are the Key Data Covered in this Market Research and Growth Report?

  • CAGR of the market during the forecast period
  • Detailed information on factors that will drive the market growth and forecasting between 2025 and 2029
  • Precise estimation of the size of the market  and its contribution of the market in focus to the parent market
  • Accurate predictions about upcoming market growth and trends and changes in consumer behaviour
  • Growth of the market across North America, Europe, Asia, and Rest of World (ROW)
  • Thorough analysis of the market's competitive landscape and detailed information about companies
  • Comprehensive analysis of factors that will challenge the growth of market companies

We can help! Our analysts can customize this market research report to meet your requirements. Get in touch

1 Executive Summary

  • 1.1 Market overview
    • Executive Summary - Chart on Market Overview
    • Executive Summary - Data Table on Market Overview
    • Executive Summary - Chart on Global Market Characteristics
    • Executive Summary - Chart on Market by Geography
    • Executive Summary - Chart on Market Segmentation by Type
    • Executive Summary - Chart on Market Segmentation by End-user
    • Executive Summary - Chart on Incremental Growth
    • Executive Summary - Data Table on Incremental Growth
    • Executive Summary - Chart on Company Market Positioning

2 Technavio Analysis

  • 2.1 Analysis of price sensitivity, lifecycle, customer purchase basket, adoption rates, and purchase criteria
    • Analysis of price sensitivity, lifecycle, customer purchase basket, adoption rates, and purchase criteria
  • 2.2 Criticality of inputs and Factors of differentiation
    • Overview on criticality of inputs and factors of differentiation
  • 2.3 Factors of disruption
    • Overview on factors of disruption
  • 2.4 Impact of drivers and challenges
    • Impact of drivers and challenges in 2024 and 2029

3 Market Landscape

  • 3.1 Market ecosystem
    • Parent Market
    • Data Table on - Parent Market
  • 3.2 Market characteristics
    • Market characteristics analysis
  • 3.3 Value chain analysis
    • Value chain analysis

4 Market Sizing

  • 4.1 Market definition
    • Offerings of companies included in the market definition
  • 4.2 Market segment analysis
    • Market segments
  • 4.3 Market size 2024
    • 4.4 Market outlook: Forecast for 2024-2029
      • Chart on Global - Market size and forecast 2024-2029 ($ million)
      • Data Table on Global - Market size and forecast 2024-2029 ($ million)
      • Chart on Global Market: Year-over-year growth 2024-2029 (%)
      • Data Table on Global Market: Year-over-year growth 2024-2029 (%)

    5 Historic Market Size

    • 5.1 Global Multi-Cancer Early Detection Market 2019 - 2023
      • Historic Market Size - Data Table on Global Multi-Cancer Early Detection Market 2019 - 2023 ($ million)
    • 5.2 Type segment analysis 2019 - 2023
      • Historic Market Size - Type Segment 2019 - 2023 ($ million)
    • 5.3 End-user segment analysis 2019 - 2023
      • Historic Market Size - End-user Segment 2019 - 2023 ($ million)
    • 5.4 Geography segment analysis 2019 - 2023
      • Historic Market Size - Geography Segment 2019 - 2023 ($ million)
    • 5.5 Country segment analysis 2019 - 2023
      • Historic Market Size - Country Segment 2019 - 2023 ($ million)

    6 Qualitative Analysis

    • 6.1 Impact of AI on global multi-cancer early detection market

      7 Five Forces Analysis

      • 7.1 Five forces summary
        • Five forces analysis - Comparison between 2024 and 2029
      • 7.2 Bargaining power of buyers
        • Bargaining power of buyers - Impact of key factors 2024 and 2029
      • 7.3 Bargaining power of suppliers
        • Bargaining power of suppliers - Impact of key factors in 2024 and 2029
      • 7.4 Threat of new entrants
        • Threat of new entrants - Impact of key factors in 2024 and 2029
      • 7.5 Threat of substitutes
        • Threat of substitutes - Impact of key factors in 2024 and 2029
      • 7.6 Threat of rivalry
        • Threat of rivalry - Impact of key factors in 2024 and 2029
      • 7.7 Market condition
        • Chart on Market condition - Five forces 2024 and 2029

      8 Market Segmentation by Type

      • 8.1 Market segments
        • Chart on Type - Market share 2024-2029 (%)
        • Data Table on Type - Market share 2024-2029 (%)
      • 8.2 Comparison by Type
        • Chart on Comparison by Type
        • Data Table on Comparison by Type
      • 8.3 Gene panel - Market size and forecast 2024-2029
        • Chart on Gene panel - Market size and forecast 2024-2029 ($ million)
        • Data Table on Gene panel - Market size and forecast 2024-2029 ($ million)
        • Chart on Gene panel - Year-over-year growth 2024-2029 (%)
        • Data Table on Gene panel - Year-over-year growth 2024-2029 (%)
      • 8.4 LDT - Market size and forecast 2024-2029
        • Chart on LDT - Market size and forecast 2024-2029 ($ million)
        • Data Table on LDT - Market size and forecast 2024-2029 ($ million)
        • Chart on LDT - Year-over-year growth 2024-2029 (%)
        • Data Table on LDT - Year-over-year growth 2024-2029 (%)
      • 8.5 Liquid biopsy - Market size and forecast 2024-2029
        • Chart on Liquid biopsy - Market size and forecast 2024-2029 ($ million)
        • Data Table on Liquid biopsy - Market size and forecast 2024-2029 ($ million)
        • Chart on Liquid biopsy - Year-over-year growth 2024-2029 (%)
        • Data Table on Liquid biopsy - Year-over-year growth 2024-2029 (%)
      • 8.6 Others - Market size and forecast 2024-2029
        • Chart on Others - Market size and forecast 2024-2029 ($ million)
        • Data Table on Others - Market size and forecast 2024-2029 ($ million)
        • Chart on Others - Year-over-year growth 2024-2029 (%)
        • Data Table on Others - Year-over-year growth 2024-2029 (%)
      • 8.7 Market opportunity by Type
        • Market opportunity by Type ($ million)
        • Data Table on Market opportunity by Type ($ million)

      9 Market Segmentation by End-user

      • 9.1 Market segments
        • Chart on End-user - Market share 2024-2029 (%)
        • Data Table on End-user - Market share 2024-2029 (%)
      • 9.2 Comparison by End-user
        • Chart on Comparison by End-user
        • Data Table on Comparison by End-user
      • 9.3 Hospitals - Market size and forecast 2024-2029
        • Chart on Hospitals - Market size and forecast 2024-2029 ($ million)
        • Data Table on Hospitals - Market size and forecast 2024-2029 ($ million)
        • Chart on Hospitals - Year-over-year growth 2024-2029 (%)
        • Data Table on Hospitals - Year-over-year growth 2024-2029 (%)
      • 9.4 Diagnostic laboratories - Market size and forecast 2024-2029
        • Chart on Diagnostic laboratories - Market size and forecast 2024-2029 ($ million)
        • Data Table on Diagnostic laboratories - Market size and forecast 2024-2029 ($ million)
        • Chart on Diagnostic laboratories - Year-over-year growth 2024-2029 (%)
        • Data Table on Diagnostic laboratories - Year-over-year growth 2024-2029 (%)
      • 9.5 Others - Market size and forecast 2024-2029
        • Chart on Others - Market size and forecast 2024-2029 ($ million)
        • Data Table on Others - Market size and forecast 2024-2029 ($ million)
        • Chart on Others - Year-over-year growth 2024-2029 (%)
        • Data Table on Others - Year-over-year growth 2024-2029 (%)
      • 9.6 Market opportunity by End-user
        • Market opportunity by End-user ($ million)
        • Data Table on Market opportunity by End-user ($ million)

      10 Customer Landscape

      • 10.1 Customer landscape overview
        • Analysis of price sensitivity, lifecycle, customer purchase basket, adoption rates, and purchase criteria

      11 Geographic Landscape

      • 11.1 Geographic segmentation
        • Chart on Market share by geography 2024-2029 (%)
        • Data Table on Market share by geography 2024-2029 (%)
      • 11.2 Geographic comparison
        • Chart on Geographic comparison
        • Data Table on Geographic comparison
      • 11.3 North America - Market size and forecast 2024-2029
        • Chart on North America - Market size and forecast 2024-2029 ($ million)
        • Data Table on North America - Market size and forecast 2024-2029 ($ million)
        • Chart on North America - Year-over-year growth 2024-2029 (%)
        • Data Table on North America - Year-over-year growth 2024-2029 (%)
      • 11.4 Europe - Market size and forecast 2024-2029
        • Chart on Europe - Market size and forecast 2024-2029 ($ million)
        • Data Table on Europe - Market size and forecast 2024-2029 ($ million)
        • Chart on Europe - Year-over-year growth 2024-2029 (%)
        • Data Table on Europe - Year-over-year growth 2024-2029 (%)
      • 11.5 Asia - Market size and forecast 2024-2029
        • Chart on Asia - Market size and forecast 2024-2029 ($ million)
        • Data Table on Asia - Market size and forecast 2024-2029 ($ million)
        • Chart on Asia - Year-over-year growth 2024-2029 (%)
        • Data Table on Asia - Year-over-year growth 2024-2029 (%)
      • 11.6 Rest of World (ROW) - Market size and forecast 2024-2029
        • Chart on Rest of World (ROW) - Market size and forecast 2024-2029 ($ million)
        • Data Table on Rest of World (ROW) - Market size and forecast 2024-2029 ($ million)
        • Chart on Rest of World (ROW) - Year-over-year growth 2024-2029 (%)
        • Data Table on Rest of World (ROW) - Year-over-year growth 2024-2029 (%)
      • 11.7 US - Market size and forecast 2024-2029
        • Chart on US - Market size and forecast 2024-2029 ($ million)
        • Data Table on US - Market size and forecast 2024-2029 ($ million)
        • Chart on US - Year-over-year growth 2024-2029 (%)
        • Data Table on US - Year-over-year growth 2024-2029 (%)
      • 11.8 Germany - Market size and forecast 2024-2029
        • Chart on Germany - Market size and forecast 2024-2029 ($ million)
        • Data Table on Germany - Market size and forecast 2024-2029 ($ million)
        • Chart on Germany - Year-over-year growth 2024-2029 (%)
        • Data Table on Germany - Year-over-year growth 2024-2029 (%)
      • 11.9 Japan - Market size and forecast 2024-2029
        • Chart on Japan - Market size and forecast 2024-2029 ($ million)
        • Data Table on Japan - Market size and forecast 2024-2029 ($ million)
        • Chart on Japan - Year-over-year growth 2024-2029 (%)
        • Data Table on Japan - Year-over-year growth 2024-2029 (%)
      • 11.10 UK - Market size and forecast 2024-2029
        • Chart on UK - Market size and forecast 2024-2029 ($ million)
        • Data Table on UK - Market size and forecast 2024-2029 ($ million)
        • Chart on UK - Year-over-year growth 2024-2029 (%)
        • Data Table on UK - Year-over-year growth 2024-2029 (%)
      • 11.11 China - Market size and forecast 2024-2029
        • Chart on China - Market size and forecast 2024-2029 ($ million)
        • Data Table on China - Market size and forecast 2024-2029 ($ million)
        • Chart on China - Year-over-year growth 2024-2029 (%)
        • Data Table on China - Year-over-year growth 2024-2029 (%)
      • 11.12 Canada - Market size and forecast 2024-2029
        • Chart on Canada - Market size and forecast 2024-2029 ($ million)
        • Data Table on Canada - Market size and forecast 2024-2029 ($ million)
        • Chart on Canada - Year-over-year growth 2024-2029 (%)
        • Data Table on Canada - Year-over-year growth 2024-2029 (%)
      • 11.13 France - Market size and forecast 2024-2029
        • Chart on France - Market size and forecast 2024-2029 ($ million)
        • Data Table on France - Market size and forecast 2024-2029 ($ million)
        • Chart on France - Year-over-year growth 2024-2029 (%)
        • Data Table on France - Year-over-year growth 2024-2029 (%)
      • 11.14 India - Market size and forecast 2024-2029
        • Chart on India - Market size and forecast 2024-2029 ($ million)
        • Data Table on India - Market size and forecast 2024-2029 ($ million)
        • Chart on India - Year-over-year growth 2024-2029 (%)
        • Data Table on India - Year-over-year growth 2024-2029 (%)
      • 11.15 Italy - Market size and forecast 2024-2029
        • Chart on Italy - Market size and forecast 2024-2029 ($ million)
        • Data Table on Italy - Market size and forecast 2024-2029 ($ million)
        • Chart on Italy - Year-over-year growth 2024-2029 (%)
        • Data Table on Italy - Year-over-year growth 2024-2029 (%)
      • 11.16 Spain - Market size and forecast 2024-2029
        • Chart on Spain - Market size and forecast 2024-2029 ($ million)
        • Data Table on Spain - Market size and forecast 2024-2029 ($ million)
        • Chart on Spain - Year-over-year growth 2024-2029 (%)
        • Data Table on Spain - Year-over-year growth 2024-2029 (%)
      • 11.17 Market opportunity by geography
        • Market opportunity by geography ($ million)
        • Data Tables on Market opportunity by geography ($ million)

      12 Drivers, Challenges, and Opportunity/Restraints

      • 12.1 Market drivers
        • 12.2 Market challenges
          • 12.3 Impact of drivers and challenges
            • Impact of drivers and challenges in 2024 and 2029
          • 12.4 Market opportunities/restraints

            13 Competitive Landscape

            • 13.1 Overview
              • 13.2 Competitive Landscape
                • Overview on criticality of inputs and factors of differentiation
              • 13.3 Landscape disruption
                • Overview on factors of disruption
              • 13.4 Industry risks
                • Impact of key risks on business

              14 Competitive Analysis

              • 14.1 Companies profiled
                • Companies covered
              • 14.2 Company ranking index
                • Company ranking index
              • 14.3 Market positioning of companies
                • Matrix on companies position and classification
              • 14.4 Adaptive Biotechnologies Corp.
                • Adaptive Biotechnologies Corp. - Overview
                • Adaptive Biotechnologies Corp. - Product / Service
                • Adaptive Biotechnologies Corp. - Key news
                • Adaptive Biotechnologies Corp. - Key offerings
                • SWOT
              • 14.5 Burning Rock Biotech Ltd.
                • Burning Rock Biotech Ltd. - Overview
                • Burning Rock Biotech Ltd. - Product / Service
                • Burning Rock Biotech Ltd. - Key offerings
                • SWOT
              • 14.6 EarlyDiagnostics
                • EarlyDiagnostics - Overview
                • EarlyDiagnostics - Product / Service
                • EarlyDiagnostics - Key offerings
                • SWOT
              • 14.7 Exact Sciences Corp.
                • Exact Sciences Corp. - Overview
                • Exact Sciences Corp. - Product / Service
                • Exact Sciences Corp. - Key news
                • Exact Sciences Corp. - Key offerings
                • SWOT
              • 14.8 F. Hoffmann La Roche Ltd.
                • F. Hoffmann La Roche Ltd. - Overview
                • F. Hoffmann La Roche Ltd. - Business segments
                • F. Hoffmann La Roche Ltd. - Key news
                • F. Hoffmann La Roche Ltd. - Key offerings
                • F. Hoffmann La Roche Ltd. - Segment focus
                • SWOT
              • 14.9 Freenome Holdings Inc.
                • Freenome Holdings Inc. - Overview
                • Freenome Holdings Inc. - Product / Service
                • Freenome Holdings Inc. - Key offerings
                • SWOT
              • 14.10 GRAIL Inc.
                • GRAIL Inc. - Overview
                • GRAIL Inc. - Product / Service
                • GRAIL Inc. - Key offerings
                • SWOT
              • 14.11 Guardant Health Inc.
                • Guardant Health Inc. - Overview
                • Guardant Health Inc. - Product / Service
                • Guardant Health Inc. - Key news
                • Guardant Health Inc. - Key offerings
                • SWOT
              • 14.12 Lucence Health Inc.
                • Lucence Health Inc. - Overview
                • Lucence Health Inc. - Product / Service
                • Lucence Health Inc. - Key offerings
                • SWOT
              • 14.13 Myriad Genetics Inc.
                • Myriad Genetics Inc. - Overview
                • Myriad Genetics Inc. - Product / Service
                • Myriad Genetics Inc. - Key news
                • Myriad Genetics Inc. - Key offerings
                • SWOT
              • 14.14 Natera Inc.
                • Natera Inc. - Overview
                • Natera Inc. - Product / Service
                • Natera Inc. - Key news
                • Natera Inc. - Key offerings
                • SWOT
              • 14.15 OncoCyte Corp
                • OncoCyte Corp - Overview
                • OncoCyte Corp - Product / Service
                • OncoCyte Corp - Key offerings
                • SWOT
              • 14.16 SeekIn Inc.
                • SeekIn Inc. - Overview
                • SeekIn Inc. - Product / Service
                • SeekIn Inc. - Key offerings
                • SWOT
              • 14.17 Singlera Genomics Inc.
                • Singlera Genomics Inc. - Overview
                • Singlera Genomics Inc. - Product / Service
                • Singlera Genomics Inc. - Key offerings
                • SWOT
              • 14.18 StageZero Life Sciences Ltd.
                • StageZero Life Sciences Ltd. - Overview
                • StageZero Life Sciences Ltd. - Product / Service
                • StageZero Life Sciences Ltd. - Key offerings
                • SWOT

              15 Appendix

              • 15.1 Scope of the report
                • 15.2 Inclusions and exclusions checklist
                  • Inclusions checklist
                  • Exclusions checklist
                • 15.3 Currency conversion rates for US$
                  • Currency conversion rates for US$
                • 15.4 Research methodology
                  • Research methodology
                • 15.5 Data procurement
                  • Information sources
                • 15.6 Data validation
                  • Data validation
                • 15.7 Validation techniques employed for market sizing
                  • Validation techniques employed for market sizing
                • 15.8 Data synthesis
                  • Data synthesis
                • 15.9 360 degree market analysis
                  • 360 degree market analysis
                • 15.10 List of abbreviations
                  • List of abbreviations

                Research Methodology

                Technavio presents a detailed picture of the market by way of study, synthesis, and summation of data from multiple sources. The analysts have presented the various facets of the market with a particular focus on identifying the key industry influencers. The data thus presented is comprehensive, reliable, and the result of extensive research, both primary and secondary.

                INFORMATION SOURCES

                Primary sources

                • Manufacturers and suppliers
                • Channel partners
                • Industry experts
                • Strategic decision makers

                Secondary sources

                • Industry journals and periodicals
                • Government data
                • Financial reports of key industry players
                • Historical data
                • Press releases

                DATA ANALYSIS

                Data Synthesis

                • Collation of data
                • Estimation of key figures
                • Analysis of derived insights

                Data Validation

                • Triangulation with data models
                • Reference against proprietary databases
                • Corroboration with industry experts

                REPORT WRITING

                Qualitative

                • Market drivers
                • Market challenges
                • Market trends
                • Five forces analysis

                Quantitative

                • Market size and forecast
                • Market segmentation
                • Geographical insights
                • Competitive landscape

                Interested in this report?

                Get your sample now to see our research methodology and insights!

                Download Now

                Frequently Asked Questions

                Multi-Cancer Early Detection market growth will increase by $ 1294.6 mn during 2025-2029 .

                The Multi-Cancer Early Detection market is expected to grow at a CAGR of 15.4% during 2025-2029 .

                Multi-Cancer Early Detection market is segmented by Type( Gene panel, LDT, Liquid biopsy, Others) End-user( Hospitals, Diagnostic laboratories, Others)

                Adaptive Biotechnologies Corp., Burning Rock Biotech Ltd., EarlyDiagnostics, Elypta AB, Epigenomics AG, Exact Sciences Corp., F. Hoffmann La Roche Ltd., Freenome Holdings Inc., GRAIL Inc., Guardant Health Inc., Lucence Health Inc., Myriad Genetics Inc., Natera Inc., OncoCyte Corp, SeekIn Inc., Singlera Genomics Inc., StageZero Life Sciences Ltd. are a few of the key vendors in the Multi-Cancer Early Detection market.

                North America will register the highest growth rate of 36% among the other regions. Therefore, the Multi-Cancer Early Detection market in North America is expected to garner significant business opportunities for the vendors during the forecast period.

                US, Germany, Japan, UK, China, Canada, France, India, Italy, Spain

                • Rising cancer prevalenceThe rising prevalence of cancer is a significant driver in the global multi-cancer early detection market. In 2022 is the driving factor this market.
                • there were approximately 20 million new cancer cases worldwide is the driving factor this market.
                • resulting in 9.7 million deaths. This alarming rate of incidence and mortality underscores the critical need for effective early detection methods. Cancer affects a substantial portion of the global population is the driving factor this market.
                • with about one in five people developing the disease in their lifetime. The mortality rate is also significant is the driving factor this market.
                • with approximately one in nine men and one in twelve women succumbing to cancer. These statistics reflect the pervasive impact of cancer on individuals and healthcare systems globally.Looking ahead is the driving factor this market.
                • the burden of cancer is expected to increase dramatically. By 2050 is the driving factor this market.
                • the number of new cancer cases is projected to rise to over 35 million annually is the driving factor this market.
                • representing a 77% increase from the 20 million cases reported in 2022. This projected rise is driven by factors such as aging populations is the driving factor this market.
                • lifestyle changes is the driving factor this market.
                • and environmental factors is the driving factor this market.
                • which contribute to higher cancer incidence rates.The escalating prevalence of cancer necessitates advancements in early detection technologies. Early detection is crucial for improving survival rates and reducing the overall burden of cancer. By identifying cancer at its earliest stages is the driving factor this market.
                • treatment can be more effective is the driving factor this market.
                • less invasive is the driving factor this market.
                • and more likely to result in positive outcomes. This need drives the development and adoption of innovative MCED tests that can detect multiple cancer types through non-invasive methods is the driving factor this market.
                • such as liquid biopsies and advanced imaging techniques.Thus is the driving factor this market.
                • as the demand for early and accurate cancer detection continues to grow is the driving factor this market.
                • the global multi-cancer early detection market is poised for significant expansion is the driving factor this market.
                • driven by the imperative to improve patient outcomes and manage the global cancer burden more effectively. is the driving factor this market.

                The Multi-Cancer Early Detection market vendors should focus on grabbing business opportunities from the Gene panel segment as it accounted for the largest market share in the base year.