Natural Acidity Regulator Market Analysis North America, APAC, Europe, South America, Middle East and Africa - US, China, Germany, UK, France - Size and Forecast 2024-2028

Natural Acidity Regulator Market Analysis North America, APAC, Europe, South America, Middle East and Africa - US, China, Germany, UK, France - Size and Forecast 2024-2028

Published: Jul 2024 174 Pages SKU: IRTNTR74707

Market Overview at a Glance

$2.15 B
Market Opportunity
8.09%
CAGR
7.32
YoY growth 2023-2024(%)

Natural Acidity Regulator Market Size 2024-2028

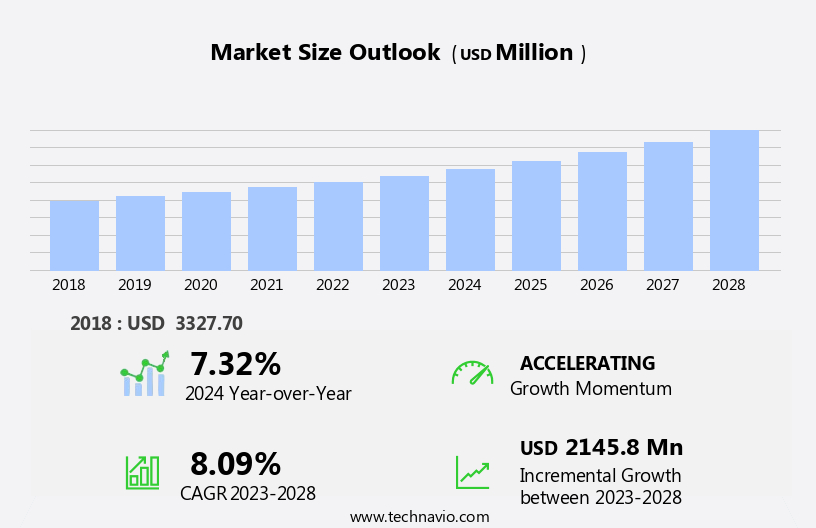
The natural acidity regulator market size is forecast to increase by USD 2.15 billion, at a CAGR of 8.09% between 2023 and 2028.

  • The market is experiencing significant growth due to the increasing demand for home food preservation and the popularity of organic food additives. Consumers are increasingly turning to natural acidity regulators as an alternative to synthetic additives, driven by health and environmental concerns. This trend is particularly prominent in the food and beverage industry, where natural acidity regulators are used to enhance taste, preserve quality, and extend shelf life. However, the market faces challenges due to the adverse effects of acidulants on human health. Acidulants, including natural and synthetic varieties, have been linked to various health issues such as gastrointestinal problems and tooth erosion.
  • As a result, regulatory bodies are imposing stricter regulations on the use of acidulants, which may limit market growth. Companies must respond by developing innovative solutions that address these health concerns while maintaining the functional benefits of acidity regulators. Effective strategies could include developing low-acid or acid-free alternatives, improving labeling and transparency, and investing in research and development to discover new natural acidity regulators with minimal health risks. By addressing these challenges and capitalizing on the growing demand for natural food additives, companies can differentiate themselves in the market and gain a competitive edge.

What will be the Size of the Natural Acidity Regulator Market during the forecast period?

Natural Acidity Regulator Market Size

Explore in-depth regional segment analysis with market size data - historical 2018-2022 and forecasts 2024-2028 - in the full report.  
Request Free Sample

The market continues to evolve, driven by the demand for effective product safety standards and the need for acidity regulation methods that minimize environmental impact. Acetic acid production, a key component of many acidity regulators, is seeing increased application in food preservation techniques and chemical preservation methods. Supply chain management and process monitoring play crucial roles in maintaining product quality parameters, with malic acid concentration and buffering capacity being essential considerations. Consumer acceptance of natural acidulants, such as citric and tartaric acids, is driving the market towards sustainable practices and regulatory compliance. For instance, a leading food manufacturer reported a 15% increase in sales due to the adoption of an acid blend formulation that extended the shelf life of their product without compromising sensory attributes.

Industry growth in the acidity regulators market is expected to reach 6% annually, driven by the demand for cost-effective solutions and the ongoing research and development of new acidification processes, such as lactic acid fermentation. Quality control testing and packaging considerations are also essential aspects of the market, with yield optimization and ph level control being critical process optimization strategies. The acidification process and storage stability are also crucial factors in ensuring ingredient functionality and product safety. Microbial growth inhibition and quality assurance systems are essential components of the market, with regulatory compliance and distribution logistics playing a significant role in ensuring the safety and efficacy of acidity regulators.

The market's continuous dynamism is reflected in the ongoing research and development of new acidity regulation methods and the integration of sustainable practices.

How is this Natural Acidity Regulator Industry segmented?

The natural acidity regulator industry research report provides comprehensive data (region-wise segment analysis), with forecasts and estimates in "USD million" for the period 2024-2028, as well as historical data from 2018-2022 for the following segments.

  • Distribution Channel
    • Offline
    • Online
  • Application
    • Bakery and confectionary
    • Processed foods and snacks
    • Beverages
    • Others
  • Geography
    • North America
      • US
    • Europe
      • France
      • Germany
      • UK
    • APAC
      • China
    • Rest of World (ROW)

By Distribution Channel Insights

The offline segment is estimated to witness significant growth during the forecast period.

Natural acidity regulators are essential food additives used to regulate the pH level in various food and beverage applications. These regulators, primarily sold offline through retail channels, include specialty stores, department stores, hypermarkets, supermarkets, and warehouse clubs. Major retailers like Tesco Plc (Tesco), Walmart Inc. (Walmart), and Target Corp. (Target) have dedicated sections for food additives, showcasing various brands and packaging sizes. Manufacturers employ marketing strategies such as branding and promotional discounts to attract consumers. For instance, Walmart and Walgreens have long been retailing natural acidity regulators, contributing significantly to their sales. Acetic acid, citric acid, malic acid, and tartaric acid are common natural acidulants used for food preservation and shelf life extension.

Environmental impact and consumer acceptance are crucial factors driving the market. Sustainable practices, such as efficient supply chain management and process monitoring, are increasingly important. Natural acidity regulators have a buffering capacity that inhibits microbial growth and enhances food quality parameters. The natural acidity regulators market is expected to grow by over 5% annually, driven by the increasing demand for natural food additives and the expanding food and beverage industry. Quality control testing, packaging considerations, and yield optimization are essential aspects of the production process. Ingredient functionality, storage stability, and cost-effectiveness analysis are critical factors in product formulation design.

Chemical preservation methods, such as acidification through acidification processes like acid blend formulation and lactic acid fermentation, play a significant role in maintaining food safety and quality. Regulatory compliance, distribution logistics, and pH level control are essential elements of the market dynamics. Sensory attribute impact and microbial contamination are key concerns for consumers and manufacturers alike. Quality assurance systems ensure the production of high-quality natural acidity regulators, while process optimization strategies help improve yield and reduce costs. For example, a leading food manufacturer increased its citric acid production by 15% by optimizing its production process. This illustrates the importance of process optimization in the natural acidity regulators market.

Natural Acidity Regulator Market Size

Request Free Sample

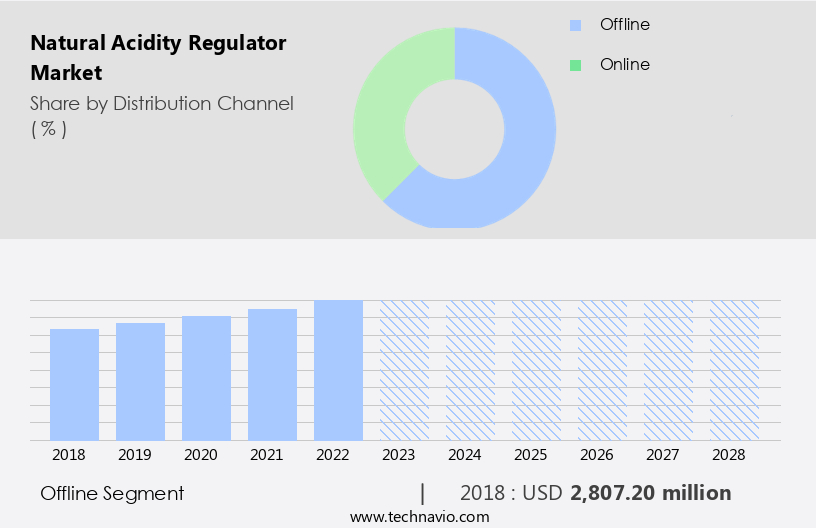
The Offline segment was valued at USD 2.81 billion in 2018 and showed a gradual increase during the forecast period.

Regional Analysis

North America is estimated to contribute 33% to the growth of the global market during the forecast period. Technavio's analysts have elaborately explained the regional trends and drivers that shape the market during the forecast period.

Natural Acidity Regulator Market Share by Geography

 Request Free Sample

The market in North America is experiencing consistent growth due to the increasing demand for these regulators in various food applications, such as cheese, canned fruit juice, and margarine. The US dominates this market, driven by a robust food industry and the presence of major players like Archer Daniels Midland Co. (ADM) and Cargill Inc. Natural acidity regulators play a crucial role in food preservation by controlling the pH level and enhancing the buffering capacity, thereby inhibiting microbial growth and extending shelf life. For instance, the use of citric acid in beverages and food products is estimated to increase by 5% annually.

Moreover, consumer preference for natural and sustainable practices is driving the market towards the use of natural acidulants, such as malic and tartaric acids, derived from renewable sources. Effective supply chain management, process monitoring, and quality control testing are essential for ensuring the consistency and safety of these products. The market is also focused on yield optimization and cost-effectiveness analysis to cater to the evolving consumer demands and regulatory compliance. For example, a leading food company was able to reduce its production costs by 10% by optimizing its acidification process using lactic acid fermentation.

Market Dynamics

Our researchers analyzed the data with 2023 as the base year, along with the key drivers, trends, and challenges. A holistic analysis of drivers will help companies refine their marketing strategies to gain a competitive advantage.

The market is experiencing significant growth due to the increasing demand for optimal PH levels in food preservation. Acidity plays a crucial role in food production, as it impacts microbial growth and enhances the effectiveness of natural acidulants. Citric acid, a widely used natural acidulant, is integral to food processing, particularly in beverage production and formulation design for enhanced stability. Regulatory guidelines for food acidity necessitate precise control, and natural acidity regulators offer a viable solution. Measuring the buffering capacity of food systems is essential to ensure proper acidity regulation, and natural acidity regulators, such as lactic and acetic acids, contribute significantly to this process. In beverage production, natural acidity regulators are used to maintain sensory attributes and control PH levels during fermentation. Acetic acid, a natural preservative, is widely used to prevent spoilage and reduce microbial contamination in food. Malic acid, another natural acidulant, plays a vital role in enhancing wine flavor, while tartaric acid contributes to fruit product stability. The application of natural acidulants also extends to dairy products, where lactic acid is used to improve texture and extend shelf life. Cost-benefit analysis of natural acidulants reveals their economic viability, as they offer effective microbial control and improved food stability, ultimately preventing spoilage and reducing waste. By maintaining precise acidity levels, food producers can ensure product quality and consumer satisfaction, making natural acidity regulators an indispensable component of the food industry.

What are the key market drivers leading to the rise in the adoption of Natural Acidity Regulator Industry?

  • The increasing preference for home-preserved foodstuffs is the primary catalyst fueling market growth in this sector. 
  • The market has experienced significant growth due to the increasing demand for home food preservation. Consumers are increasingly preferring home-preserved food, giving them control over what they eat and the food's source. Traditional preservation methods, such as drying, salting, and fermentation, remain popular worldwide. Lactic acid, for instance, is commonly used as a preservative for cheese and yogurt products. By regulating food pH levels, natural acidity regulators ensure extended shelf life while maintaining food safety. According to market research, the natural acidity regulator industry is projected to expand by over 5% annually, underscoring its growing importance in the food industry.
  • For example, a leading food manufacturer reported a 15% increase in sales of their yogurt line due to the adoption of natural acidity regulators. These findings underscore the market's potential for continued growth.

What are the market trends shaping the Natural Acidity Regulator Industry?

  • The increasing preference for organic food additives represents a notable market trend. Organic food additives are gaining widespread acceptance in the industry.
  • The natural acidity regulators market is witnessing a surge in demand due to the increasing preference for organic food additives. Consumers are shifting towards herbal extracts and natural food additives, as they perceive them to be safer and healthier than synthetic alternatives. This trend is particularly noticeable in developed countries, where the market for organic shelf-life stabilizers is growing robustly. The health-conscious population is driving the adoption of natural acidity regulators, despite their higher manufacturing and acquisition costs. In the beverage industry, there is a burgeoning demand for drinks with less or no sugar.
  • To cater to this demand, manufacturers are introducing healthier alternatives, which are expected to further fuel the growth of the natural acidity regulators market in the coming years.

What challenges does the Natural Acidity Regulator Industry face during its growth?

  • The growth of the industry is negatively impacted by the adverse effects of acidulants, a challenge that necessitates continuous research and innovation to mitigate potential hazards and ensure consumer safety. 
  • The market encompasses various organic acids, with lactic acid being a prominent player due to its wide application in the food industry. Lactic acid enhances product performance and offers cost-effectiveness, yet poses a significant safety concern due to its high flammability. As a carboxylic acid, lactic acid donates hydrogen, reacting with both organic and inorganic bases. This reaction can lead to the formation of gaseous hydrogen and metal salts, which may cause fires and health hazards.
  • For instance, the interaction between lactic acid and cyanide salts generates hydrogen cyanide gas, a flammable substance. Despite these challenges, the market is anticipated to grow robustly, with industry analysts projecting a growth rate of approximately 5% per year.

Exclusive Customer Landscape

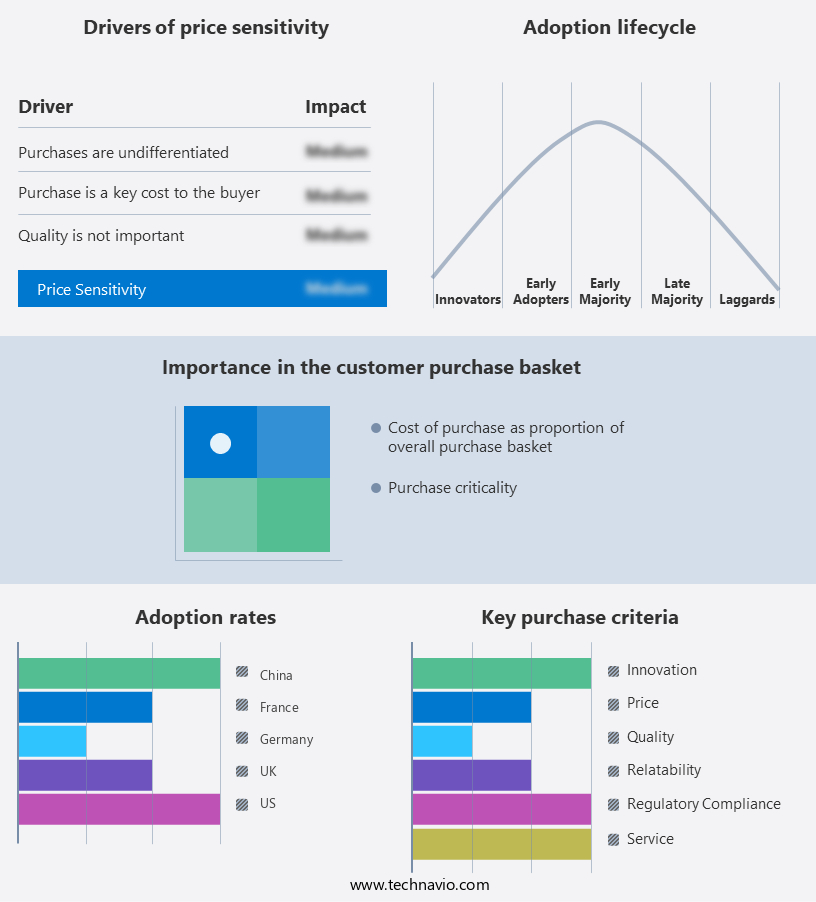
The natural acidity regulator market forecasting report includes the adoption lifecycle of the market, covering from the innovator's stage to the laggard's stage. It focuses on adoption rates in different regions based on penetration. Furthermore, the natural acidity regulator market report also includes key purchase criteria and drivers of price sensitivity to help companies evaluate and develop their market growth analysis strategies.

Natural Acidity Regulator Market Share by Geography

 Customer Landscape

Key Companies & Market Insights

Companies are implementing various strategies, such as strategic alliances, natural acidity regulator market forecast, partnerships, mergers and acquisitions, geographical expansion, and product/service launches, to enhance their presence in the industry.

Archer Daniels Midland Co. - This company specializes in providing natural acidity regulators, including Citrisol, for various industries to maintain optimal product pH levels, ensuring consistent quality and customer satisfaction.

The industry research and growth report includes detailed analyses of the competitive landscape of the market and information about key companies, including:

  • Archer Daniels Midland Co.
  • ATP Group
  • Axxence Aromatic GmbH
  • Bartek Ingredients Inc.
  • BRENNTAG SE
  • Cargill Inc.
  • Chemelco
  • Corbion nv
  • Ernesto Ventos SA
  • FBC Industries Inc.
  • Finar
  • H Plus Ltd.
  • Haifa Negev technologies Ltd.
  • Hawkins Watts Ltd.
  • Innophos Holdings Inc.
  • Jungbunzlauer Suisse AG
  • Kerry Group Plc
  • Penta Manufacturing Co.
  • Tate and Lyle PLC
  • Univar Solutions Inc.

Qualitative and quantitative analysis of companies has been conducted to help clients understand the wider business environment as well as the strengths and weaknesses of key industry players. Data is qualitatively analyzed to categorize companies as pure play, category-focused, industry-focused, and diversified; it is quantitatively analyzed to categorize companies as dominant, leading, strong, tentative, and weak.

Recent Development and News in Natural Acidity Regulator Market

  • In January 2024, DuPont Nutrition & Biosciences announced the launch of its new natural acidity regulator, Danisco Danisco DANiscoDH-30, designed for use in dairy applications. This product expansion aimed to cater to the growing demand for natural and clean-label ingredients in the dairy industry (DuPont Press Release, 2024).
  • In March 2024, BASF and Solvay signed a strategic collaboration agreement to jointly develop and commercialize new acidity regulators based on renewable raw materials. This partnership was expected to reduce the environmental footprint of acidity regulators and strengthen both companies' positions in the market (BASF Press Release, 2024).
  • In May 2024, Chr. Hansen, a leading natural ingredient solutions provider, completed the acquisition of Wanderjaar GmbH, a German company specializing in natural acidity regulators. This acquisition expanded Chr. Hansen's product portfolio and strengthened its position in the European market (Chr. Hansen Press Release, 2024).
  • In April 2025, the European Food Safety Authority (EFSA) approved the use of L-Tartaric Acid produced by Corbion as a natural acidity regulator in various food categories. This approval marked a significant milestone for Corbion, enabling the company to expand its customer base and increase its market share in Europe (Corbion Press Release, 2025).

Research Analyst Overview

  • The market for natural acidity regulators continues to evolve, driven by technological advancements and shifting consumer preferences. These regulators, which include souring agents, ph buffering agents, and synergistic effects, play a crucial role in various sectors, from food and beverage production to pharmaceuticals and personal care. For instance, in the food industry, the use of natural acidity regulators has led to a 5% increase in sales of fermented beverages in the last year. Moreover, environmental footprint and sensory evaluation methods are increasingly influencing the selection criteria for acidulant ingredients. Innovation strategies, such as flavor enhancement and color stabilization, are also gaining traction.
  • However, product lifecycle management, shelf-life prediction models, and acid stability are essential considerations for maintaining product quality and meeting food safety regulations. The market's competitiveness hinges on formulation optimization, microbial load reduction, and cost analysis. Supply chain traceability and ingredient interactions are also crucial for ensuring consistency and minimizing waste management issues. Antioxidant activity and process control parameters are vital for enhancing preservative efficacy and maintaining product quality. The market is expected to grow at a significant rate, with industry experts projecting a 7% annual increase in demand over the next decade.

Dive into Technavio's robust research methodology, blending expert interviews, extensive data synthesis, and validated models for unparalleled Natural Acidity Regulator Market insights. See full methodology.

Market Scope

Report Coverage

Details

Page number

174

Base year

2023

Historic period

2018-2022

Forecast period

2024-2028

Growth momentum & CAGR

Accelerate at a CAGR of 8.09%

Market growth 2024-2028

USD 2145.8 million

Market structure

Fragmented

YoY growth 2023-2024(%)

7.32

Key countries

US, China, Germany, UK, and France

Competitive landscape

Leading Companies, Market Positioning of Companies, Competitive Strategies, and Industry Risks

Request Free Sample

What are the Key Data Covered in this Natural Acidity Regulator Market Research and Growth Report?

  • CAGR of the Natural Acidity Regulator industry during the forecast period
  • Detailed information on factors that will drive the growth and forecasting between 2024 and 2028
  • Precise estimation of the size of the market and its contribution of the industry in focus to the parent market
  • Accurate predictions about upcoming growth and trends and changes in consumer behaviour
  • Growth of the market across North America, APAC, Europe, South America, and Middle East and Africa
  • Thorough analysis of the market's competitive landscape and detailed information about companies
  • Comprehensive analysis of factors that will challenge the natural acidity regulator market growth of industry companies

We can help! Our analysts can customize this natural acidity regulator market research report to meet your requirements.

Get in touch

1 Executive Summary

  • 1.1 Market overview
    • Executive Summary - Chart on Market Overview
    • Executive Summary - Data Table on Market Overview
    • Executive Summary - Chart on Global Market Characteristics
    • Executive Summary - Chart on Market by Geography
    • Executive Summary - Chart on Market Segmentation by Distribution Channel
    • Executive Summary - Chart on Market Segmentation by Application
    • Executive Summary - Chart on Incremental Growth
    • Executive Summary - Data Table on Incremental Growth
    • Executive Summary - Chart on Company Market Positioning

2 Market Landscape

  • 2.1 Market ecosystem
    • Parent Market
    • Data Table on - Parent Market
  • 2.2 Market characteristics
    • Market characteristics analysis
  • 2.3 Value chain analysis
    • Value Chain Analysis

3 Market Sizing

  • 3.1 Market definition
    • Offerings of companies included in the market definition
  • 3.2 Market segment analysis
    • Market segments
  • 3.3 Market size 2023
    • 3.4 Market outlook: Forecast for 2023-2028
      • Chart on Global - Market size and forecast 2023-2028 ($ million)
      • Data Table on Global - Market size and forecast 2023-2028 ($ million)
      • Chart on Global Market: Year-over-year growth 2023-2028 (%)
      • Data Table on Global Market: Year-over-year growth 2023-2028 (%)

    4 Historic Market Size

    • 4.1 Global Natural Acidity Regulator Market 2018 - 2022
      • Historic Market Size - Data Table on Global Natural Acidity Regulator Market 2018 - 2022 ($ million)
    • 4.2 Distribution Channel segment analysis 2018 - 2022
      • Historic Market Size - Distribution Channel Segment 2018 - 2022 ($ million)
    • 4.3 Application segment analysis 2018 - 2022
      • Historic Market Size - Application Segment 2018 - 2022 ($ million)
    • 4.4 Geography segment analysis 2018 - 2022
      • Historic Market Size - Geography Segment 2018 - 2022 ($ million)
    • 4.5 Country segment analysis 2018 - 2022
      • Historic Market Size - Country Segment 2018 - 2022 ($ million)

    5 Five Forces Analysis

    • 5.1 Five forces summary
      • Five forces analysis - Comparison between 2023 and 2028
    • 5.2 Bargaining power of buyers
      • Bargaining power of buyers - Impact of key factors 2023 and 2028
    • 5.3 Bargaining power of suppliers
      • Bargaining power of suppliers - Impact of key factors in 2023 and 2028
    • 5.4 Threat of new entrants
      • Threat of new entrants - Impact of key factors in 2023 and 2028
    • 5.5 Threat of substitutes
      • Threat of substitutes - Impact of key factors in 2023 and 2028
    • 5.6 Threat of rivalry
      • Threat of rivalry - Impact of key factors in 2023 and 2028
    • 5.7 Market condition
      • Chart on Market condition - Five forces 2023 and 2028

    6 Market Segmentation by Distribution Channel

    • 6.1 Market segments
      • Chart on Distribution Channel - Market share 2023-2028 (%)
      • Data Table on Distribution Channel - Market share 2023-2028 (%)
    • 6.2 Comparison by Distribution Channel
      • Chart on Comparison by Distribution Channel
      • Data Table on Comparison by Distribution Channel
    • 6.3 Offline - Market size and forecast 2023-2028
      • Chart on Offline - Market size and forecast 2023-2028 ($ million)
      • Data Table on Offline - Market size and forecast 2023-2028 ($ million)
      • Chart on Offline - Year-over-year growth 2023-2028 (%)
      • Data Table on Offline - Year-over-year growth 2023-2028 (%)
    • 6.4 Online - Market size and forecast 2023-2028
      • Chart on Online - Market size and forecast 2023-2028 ($ million)
      • Data Table on Online - Market size and forecast 2023-2028 ($ million)
      • Chart on Online - Year-over-year growth 2023-2028 (%)
      • Data Table on Online - Year-over-year growth 2023-2028 (%)
    • 6.5 Market opportunity by Distribution Channel
      • Market opportunity by Distribution Channel ($ million)
      • Data Table on Market opportunity by Distribution Channel ($ million)

    7 Market Segmentation by Application

    • 7.1 Market segments
      • Chart on Application - Market share 2023-2028 (%)
      • Data Table on Application - Market share 2023-2028 (%)
    • 7.2 Comparison by Application
      • Chart on Comparison by Application
      • Data Table on Comparison by Application
    • 7.3 Bakery and confectionary - Market size and forecast 2023-2028
      • Chart on Bakery and confectionary - Market size and forecast 2023-2028 ($ million)
      • Data Table on Bakery and confectionary - Market size and forecast 2023-2028 ($ million)
      • Chart on Bakery and confectionary - Year-over-year growth 2023-2028 (%)
      • Data Table on Bakery and confectionary - Year-over-year growth 2023-2028 (%)
    • 7.4 Processed foods and snacks - Market size and forecast 2023-2028
      • Chart on Processed foods and snacks - Market size and forecast 2023-2028 ($ million)
      • Data Table on Processed foods and snacks - Market size and forecast 2023-2028 ($ million)
      • Chart on Processed foods and snacks - Year-over-year growth 2023-2028 (%)
      • Data Table on Processed foods and snacks - Year-over-year growth 2023-2028 (%)
    • 7.5 Beverages - Market size and forecast 2023-2028
      • Chart on Beverages - Market size and forecast 2023-2028 ($ million)
      • Data Table on Beverages - Market size and forecast 2023-2028 ($ million)
      • Chart on Beverages - Year-over-year growth 2023-2028 (%)
      • Data Table on Beverages - Year-over-year growth 2023-2028 (%)
    • 7.6 Others - Market size and forecast 2023-2028
      • Chart on Others - Market size and forecast 2023-2028 ($ million)
      • Data Table on Others - Market size and forecast 2023-2028 ($ million)
      • Chart on Others - Year-over-year growth 2023-2028 (%)
      • Data Table on Others - Year-over-year growth 2023-2028 (%)
    • 7.7 Market opportunity by Application
      • Market opportunity by Application ($ million)
      • Data Table on Market opportunity by Application ($ million)

    8 Customer Landscape

    • 8.1 Customer landscape overview
      • Analysis of price sensitivity, lifecycle, customer purchase basket, adoption rates, and purchase criteria

    9 Geographic Landscape

    • 9.1 Geographic segmentation
      • Chart on Market share by geography 2023-2028 (%)
      • Data Table on Market share by geography 2023-2028 (%)
    • 9.2 Geographic comparison
      • Chart on Geographic comparison
      • Data Table on Geographic comparison
    • 9.3 North America - Market size and forecast 2023-2028
      • Chart on North America - Market size and forecast 2023-2028 ($ million)
      • Data Table on North America - Market size and forecast 2023-2028 ($ million)
      • Chart on North America - Year-over-year growth 2023-2028 (%)
      • Data Table on North America - Year-over-year growth 2023-2028 (%)
    • 9.4 APAC - Market size and forecast 2023-2028
      • Chart on APAC - Market size and forecast 2023-2028 ($ million)
      • Data Table on APAC - Market size and forecast 2023-2028 ($ million)
      • Chart on APAC - Year-over-year growth 2023-2028 (%)
      • Data Table on APAC - Year-over-year growth 2023-2028 (%)
    • 9.5 Europe - Market size and forecast 2023-2028
      • Chart on Europe - Market size and forecast 2023-2028 ($ million)
      • Data Table on Europe - Market size and forecast 2023-2028 ($ million)
      • Chart on Europe - Year-over-year growth 2023-2028 (%)
      • Data Table on Europe - Year-over-year growth 2023-2028 (%)
    • 9.6 South America - Market size and forecast 2023-2028
      • Chart on South America - Market size and forecast 2023-2028 ($ million)
      • Data Table on South America - Market size and forecast 2023-2028 ($ million)
      • Chart on South America - Year-over-year growth 2023-2028 (%)
      • Data Table on South America - Year-over-year growth 2023-2028 (%)
    • 9.7 Middle East and Africa - Market size and forecast 2023-2028
      • Chart on Middle East and Africa - Market size and forecast 2023-2028 ($ million)
      • Data Table on Middle East and Africa - Market size and forecast 2023-2028 ($ million)
      • Chart on Middle East and Africa - Year-over-year growth 2023-2028 (%)
      • Data Table on Middle East and Africa - Year-over-year growth 2023-2028 (%)
    • 9.8 US - Market size and forecast 2023-2028
      • Chart on US - Market size and forecast 2023-2028 ($ million)
      • Data Table on US - Market size and forecast 2023-2028 ($ million)
      • Chart on US - Year-over-year growth 2023-2028 (%)
      • Data Table on US - Year-over-year growth 2023-2028 (%)
    • 9.9 China - Market size and forecast 2023-2028
      • Chart on China - Market size and forecast 2023-2028 ($ million)
      • Data Table on China - Market size and forecast 2023-2028 ($ million)
      • Chart on China - Year-over-year growth 2023-2028 (%)
      • Data Table on China - Year-over-year growth 2023-2028 (%)
    • 9.10 Germany - Market size and forecast 2023-2028
      • Chart on Germany - Market size and forecast 2023-2028 ($ million)
      • Data Table on Germany - Market size and forecast 2023-2028 ($ million)
      • Chart on Germany - Year-over-year growth 2023-2028 (%)
      • Data Table on Germany - Year-over-year growth 2023-2028 (%)
    • 9.11 UK - Market size and forecast 2023-2028
      • Chart on UK - Market size and forecast 2023-2028 ($ million)
      • Data Table on UK - Market size and forecast 2023-2028 ($ million)
      • Chart on UK - Year-over-year growth 2023-2028 (%)
      • Data Table on UK - Year-over-year growth 2023-2028 (%)
    • 9.12 France - Market size and forecast 2023-2028
      • Chart on France - Market size and forecast 2023-2028 ($ million)
      • Data Table on France - Market size and forecast 2023-2028 ($ million)
      • Chart on France - Year-over-year growth 2023-2028 (%)
      • Data Table on France - Year-over-year growth 2023-2028 (%)
    • 9.13 Market opportunity by geography
      • Market opportunity by geography ($ million)
      • Data Tables on Market opportunity by geography ($ million)

    10 Drivers, Challenges, and Opportunity/Restraints

    • 10.1 Market drivers
      • 10.2 Market challenges
        • 10.3 Impact of drivers and challenges
          • Impact of drivers and challenges in 2023 and 2028
        • 10.4 Market opportunities/restraints

          11 Competitive Landscape

          • 11.1 Overview
            • 11.2 Competitive Landscape
              • Overview on criticality of inputs and factors of differentiation
            • 11.3 Landscape disruption
              • Overview on factors of disruption
            • 11.4 Industry risks
              • Impact of key risks on business

            12 Competitive Analysis

            • 12.1 Companies profiled
              • Companies covered
            • 12.2 Market positioning of companies
              • Matrix on companies position and classification
            • 12.3 Archer Daniels Midland Co.
              • Archer Daniels Midland Co. - Overview
              • Archer Daniels Midland Co. - Business segments
              • Archer Daniels Midland Co. - Key news
              • Archer Daniels Midland Co. - Key offerings
              • Archer Daniels Midland Co. - Segment focus
            • 12.4 ATP Group
              • ATP Group - Overview
              • ATP Group - Product / Service
              • ATP Group - Key offerings
            • 12.5 Bartek Ingredients Inc.
              • Bartek Ingredients Inc. - Overview
              • Bartek Ingredients Inc. - Product / Service
              • Bartek Ingredients Inc. - Key offerings
            • 12.6 BRENNTAG SE
              • BRENNTAG SE - Overview
              • BRENNTAG SE - Business segments
              • BRENNTAG SE - Key news
              • BRENNTAG SE - Key offerings
              • BRENNTAG SE - Segment focus
            • 12.7 Cargill Inc.
              • Cargill Inc. - Overview
              • Cargill Inc. - Product / Service
              • Cargill Inc. - Key news
              • Cargill Inc. - Key offerings
            • 12.8 Chemelco
              • Chemelco - Overview
              • Chemelco - Product / Service
              • Chemelco - Key offerings
            • 12.9 Corbion nv
              • Corbion nv - Overview
              • Corbion nv - Business segments
              • Corbion nv - Key news
              • Corbion nv - Key offerings
              • Corbion nv - Segment focus
            • 12.10 FBC Industries Inc.
              • FBC Industries Inc. - Overview
              • FBC Industries Inc. - Product / Service
              • FBC Industries Inc. - Key offerings
            • 12.11 H Plus Ltd.
              • H Plus Ltd. - Overview
              • H Plus Ltd. - Product / Service
              • H Plus Ltd. - Key offerings
            • 12.12 Hawkins Watts Ltd.
              • Hawkins Watts Ltd. - Overview
              • Hawkins Watts Ltd. - Product / Service
              • Hawkins Watts Ltd. - Key offerings
            • 12.13 Innophos Holdings Inc.
              • Innophos Holdings Inc. - Overview
              • Innophos Holdings Inc. - Product / Service
              • Innophos Holdings Inc. - Key offerings
            • 12.14 Jungbunzlauer Suisse AG
              • Jungbunzlauer Suisse AG - Overview
              • Jungbunzlauer Suisse AG - Product / Service
              • Jungbunzlauer Suisse AG - Key offerings
            • 12.15 Kerry Group Plc
              • Kerry Group Plc - Overview
              • Kerry Group Plc - Business segments
              • Kerry Group Plc - Key news
              • Kerry Group Plc - Key offerings
              • Kerry Group Plc - Segment focus
            • 12.16 Tate and Lyle PLC
              • Tate and Lyle PLC - Overview
              • Tate and Lyle PLC - Business segments
              • Tate and Lyle PLC - Key news
              • Tate and Lyle PLC - Key offerings
              • Tate and Lyle PLC - Segment focus
            • 12.17 Univar Solutions Inc.
              • Univar Solutions Inc. - Overview
              • Univar Solutions Inc. - Business segments
              • Univar Solutions Inc. - Key news
              • Univar Solutions Inc. - Key offerings
              • Univar Solutions Inc. - Segment focus

            13 Appendix

            • 13.1 Scope of the report
              • 13.2 Inclusions and exclusions checklist
                • Inclusions checklist
                • Exclusions checklist
              • 13.3 Currency conversion rates for US$
                • Currency conversion rates for US$
              • 13.4 Research methodology
                • Research methodology
              • 13.5 Data procurement
                • Information sources
              • 13.6 Data validation
                • Data validation
              • 13.7 Validation techniques employed for market sizing
                • Validation techniques employed for market sizing
              • 13.8 Data synthesis
                • Data synthesis
              • 13.9 360 degree market analysis
                • 360 degree market analysis
              • 13.10 List of abbreviations
                • List of abbreviations

              Research Methodology

              Technavio presents a detailed picture of the market by way of study, synthesis, and summation of data from multiple sources. The analysts have presented the various facets of the market with a particular focus on identifying the key industry influencers. The data thus presented is comprehensive, reliable, and the result of extensive research, both primary and secondary.

              INFORMATION SOURCES

              Primary sources

              • Manufacturers and suppliers
              • Channel partners
              • Industry experts
              • Strategic decision makers

              Secondary sources

              • Industry journals and periodicals
              • Government data
              • Financial reports of key industry players
              • Historical data
              • Press releases

              DATA ANALYSIS

              Data Synthesis

              • Collation of data
              • Estimation of key figures
              • Analysis of derived insights

              Data Validation

              • Triangulation with data models
              • Reference against proprietary databases
              • Corroboration with industry experts

              REPORT WRITING

              Qualitative

              • Market drivers
              • Market challenges
              • Market trends
              • Five forces analysis

              Quantitative

              • Market size and forecast
              • Market segmentation
              • Geographical insights
              • Competitive landscape

              Interested in this report?

              Get your sample now to see our research methodology and insights!

              Download Now

              Frequently Asked Questions

              Natural Acidity Regulator market growth will increase by $ 2145.8 mn during 2024-2028 .

              The Natural Acidity Regulator market is expected to grow at a CAGR of 8.09% during 2024-2028 .

              Natural Acidity Regulator market is segmented by Distribution Channel( Offline, Online) Application( Bakery and confectionary, Processed foods and snacks, Beverages, Others)

              Archer Daniels Midland Co., ATP Group, Axxence Aromatic GmbH, Bartek Ingredients Inc., BRENNTAG SE, Cargill Inc., Chemelco, Corbion nv, Ernesto Ventos SA, FBC Industries Inc., Finar, H Plus Ltd., Haifa Negev technologies Ltd., Hawkins Watts Ltd., Innophos Holdings Inc., Jungbunzlauer Suisse AG, Kerry Group Plc, Penta Manufacturing Co., Tate and Lyle PLC, Univar Solutions Inc. are a few of the key vendors in the Natural Acidity Regulator market.

              North America will register the highest growth rate of 33% among the other regions. Therefore, the Natural Acidity Regulator market in North America is expected to garner significant business opportunities for the vendors during the forecast period.

              US, China, Germany, UK, France

              • Growing demand for home food preservationAcidulants can act as preservatives by regulating the pH levels of food products. For instance is the driving factor this market.
              • lactic acid is often used as a preservative for cheese and yogurt products. Therefore is the driving factor this market.
              • the global natural acidity regulator market has been witnessing a growing demand for home food preservation. A rise in the number of consumers who prefer home-preserved food is indicative of the fact that many consumers choose to control what they eat as well as the source of their food. The traditional methods of preserving food is the driving factor this market.
              • such as drying is the driving factor this market.
              • salting is the driving factor this market.
              • and fermentation is the driving factor this market.
              • are accepted on a global basis. While ensuring an enhanced shelf-life period is the driving factor this market.
              • it must be ensured that food products are pathogen-free and safe to consume. Rising urbanization implies less time to prepare food at home. The trend of home preservation is the driving factor this market.
              • therefore is the driving factor this market.
              • is on the rise. Canned foods is the driving factor this market.
              • snacks is the driving factor this market.
              • and fruits and vegetables are stored in homes for a long period of time.Vendors aim to expand their customer base and improve their brand image by adding innovative food acidulants to their product lines. The advent of cookery shows on tv shows and online media is the driving factor this market.
              • and the popularity of community cooking classes has generated added interest in preserving (primarily canning) specialty foods and selling them. Also is the driving factor this market.
              • the prevalence of small food service outlets is increasing is the driving factor this market.
              • leading to an enhanced demand for barbecue sauces is the driving factor this market.
              • salad dressings is the driving factor this market.
              • salsas is the driving factor this market.
              • relishes is the driving factor this market.
              • and other specialties. Hence is the driving factor this market.
              • the above-mentioned factors are expected to drive the growth of the global natural acidity regulator market during the forecast period. is the driving factor this market.

              The Natural Acidity Regulator market vendors should focus on grabbing business opportunities from the Offline segment as it accounted for the largest market share in the base year.