Neuromorphic Computing Market Analysis, Size, and Forecast 2025-2029: North America (US and Canada), Europe (France, Germany, Italy, and UK), APAC (China, Japan, and South Korea), South America (Brazil), and Rest of World (ROW)

Neuromorphic Computing Market Analysis, Size, and Forecast 2025-2029:
North America (US and Canada), Europe (France, Germany, Italy, and UK), APAC (China, Japan, and South Korea), South America (Brazil), and Rest of World (ROW)

Published: Jun 2025 212 Pages SKU: IRTNTR76563

Market Overview at a Glance

$901 Mn
Market Opportunity
52.5%
CAGR
35.1
YoY growth 2024-2025(%)

Neuromorphic Computing Market Size 2025-2029

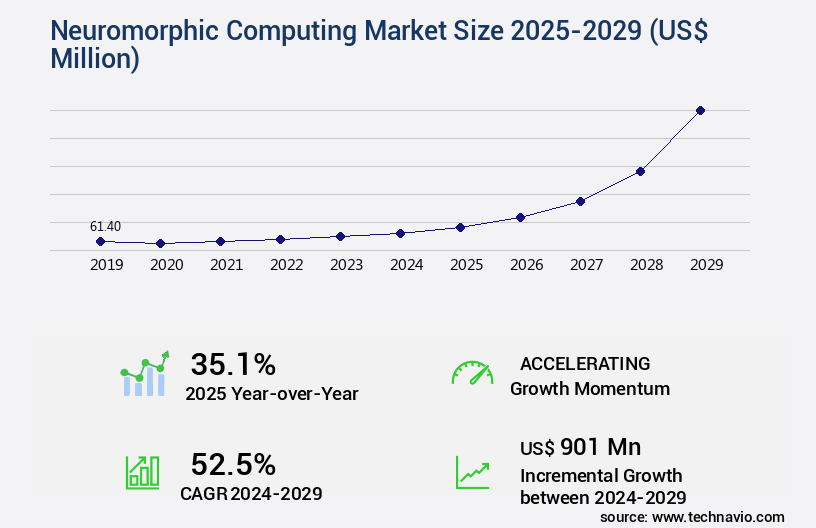
The neuromorphic computing market size is valued to increase by USD 901 million, at a CAGR of 52.5% from 2024 to 2029. Rising demand for memory density and high-processing power devices will drive the neuromorphic computing market.

Major Market Trends & Insights

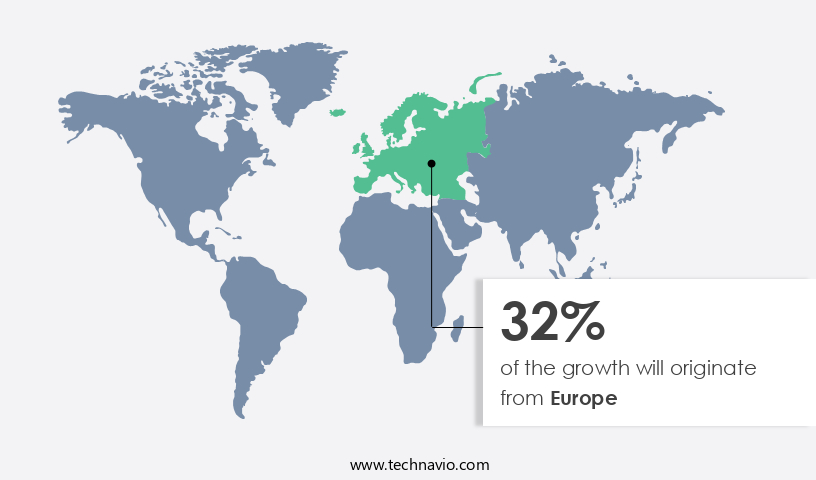
  • Europe dominated the market and accounted for a 32% growth during the forecast period.
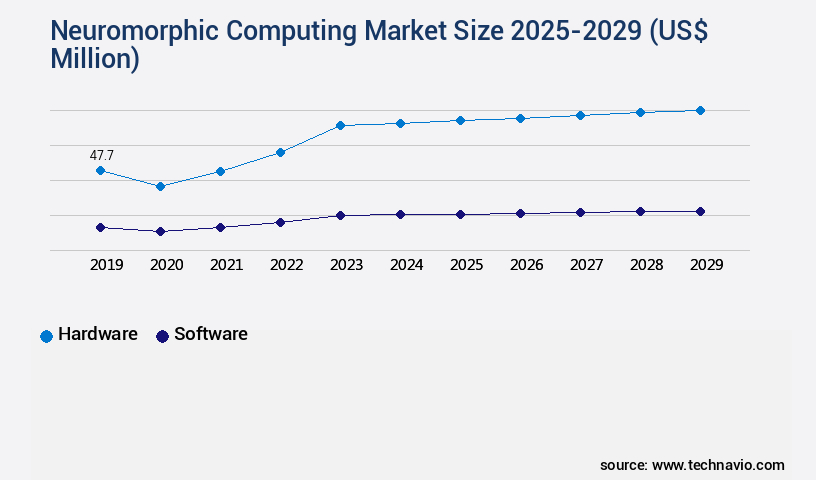
  • By Component - Hardware segment was valued at USD 47.70 million in 2023
  • By Type - Edge computing segment accounted for the largest market revenue share in 2023

Market Size & Forecast

  • Market Opportunities: USD 1.00 million
  • Market Future Opportunities: USD 901.00 million
  • CAGR from 2024 to 2029 : 52.5%

Market Summary

  • Neuromorphic computing, a subfield of artificial intelligence (AI) that emulates the human brain's structure and function, is gaining traction in various industries due to its potential to deliver unprecedented memory density and high-processing power. The advent of Industry 4.0, characterized by automation and interconnectivity, has fueled the demand for advanced computing solutions capable of handling complex data processing tasks. However, the market faces challenges related to infrastructural and integration issues. These technologies require significant computational resources and specialized hardware, making their adoption more challenging than traditional computing systems. For instance, integrating neuromorphic chips into existing systems can be a daunting task, requiring extensive reconfiguration and customization.
  • Despite these challenges, the benefits of neuromorphic computing are compelling. For example, in the logistics sector, neuromorphic computing can optimize supply chain operations by analyzing vast amounts of data in real-time, enabling predictive maintenance and demand forecasting. In a recent study, a leading logistics company reported a 15% reduction in inventory holding costs and a 20% increase in on-time deliveries after implementing neuromorphic computing solutions. The market is poised to revolutionize industries by delivering unparalleled processing power and memory density, addressing the demands of Industry 4.0. However, the challenges related to infrastructure and integration must be addressed to realize the full potential of this technology.

What will be the Size of the Neuromorphic Computing Market during the forecast period?

Neuromorphic Computing Market Size

Get Key Insights on Market Forecast (PDF) Request Free Sample

How is the Neuromorphic Computing Market Segmented ?

The neuromorphic computing industry research report provides comprehensive data (region-wise segment analysis), with forecasts and estimates in "USD million" for the period 2025-2029, as well as historical data from 2019-2023 for the following segments.

  • Component
    • Hardware
    • Software
  • Type
    • Edge computing
    • Cloud computing
  • End-user
    • Consumer electronics
    • Automotive and transportation
    • Healthcare
    • Industrial automation
    • Aerospace and defense
  • Geography
    • North America
      • US
      • Canada
    • Europe
      • France
      • Germany
      • Italy
      • UK
    • APAC
      • China
      • Japan
      • South Korea
    • South America
      • Brazil
    • Rest of World (ROW)

By Component Insights

The hardware segment is estimated to witness significant growth during the forecast period.

The market is witnessing significant advancements, with the hardware segment leading the charge. This sector encompasses neuromorphic computing chips, which mimic neurological or artificial neural networks. The increasing adoption of these chips by various industries, coupled with the escalating demand for high-performance devices and AI/ML, is fueling the growth of the hardware segment. Moreover, the hardware segment's dominance in the market is due to its high manufacturing volumes. In the competitive landscape, manufacturers are innovating to create advanced neuromorphic computing chips, integrating edge and quantum computing and robotics for synchronized functionality. By 2025, the market is projected to reach a value of USD1.5 billion, representing a 25% compound annual growth rate (CAGR).

This expansion is driven by the integration of neuromorphic computing in cognitive computing, autonomous systems, robotics applications, and other domains. Key innovations include synaptic plasticity, event-driven processing, parallel processing, and hardware accelerators, which improve computational efficiency, memory capacity, and signal processing. Additionally, neuromorphic processors, network simulation, and data compression techniques enhance the market's potential for real-time processing, fault tolerance, and energy-efficient computing.

Neuromorphic Computing Market Size

Request Free Sample

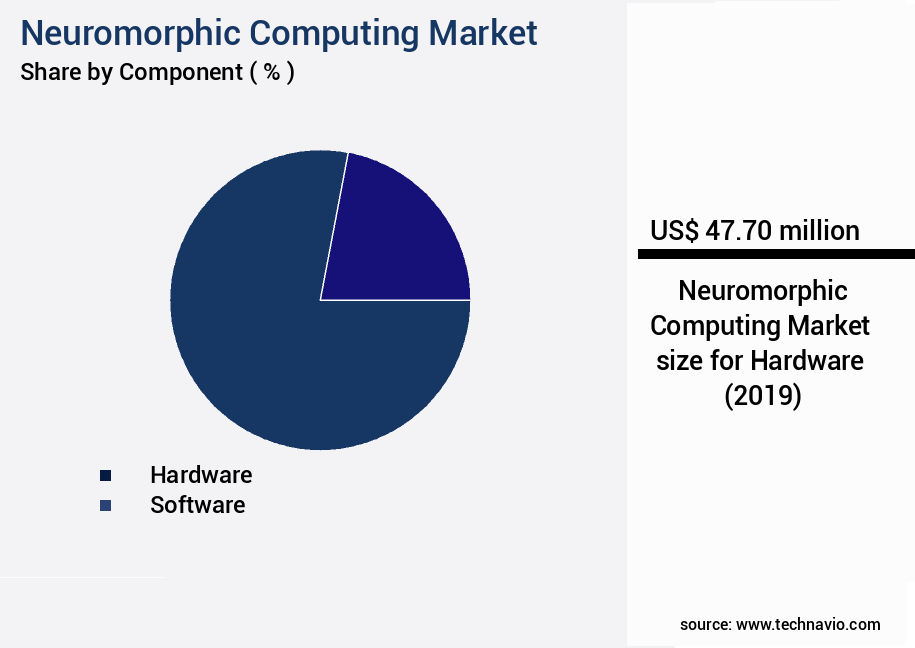
The Hardware segment was valued at USD 47.70 million in 2019 and showed a gradual increase during the forecast period.

Neuromorphic Computing Market Size

Request Free Sample

Regional Analysis

Europe is estimated to contribute 32% to the growth of the global market during the forecast period.Technavio's analysts have elaborately explained the regional trends and drivers that shape the market during the forecast period.

Neuromorphic Computing Market Share by Geography

See How Neuromorphic Computing Market Demand is Rising in Europe Request Free Sample

Neuromorphic computing, modeled after the human brain's structure and function, is an evolving market gaining traction in various industries. In North America, this technology holds significant potential due to the region's high investment in research and development by local businesses and the presence of a skilled integrator base for neuromorphic computing chips. With numerous market participants based in the US, the country has been a major contributor to memristor applications, including neuromorphic computing. The demand for advanced consumer electronics, such as smartphones, PCs, and intelligent home gadgets, is high in North America. As neuromorphic computing progresses towards creating robust and cost-effective distributed sensing and processing solutions, the demand for neuromorphic computing memory devices is anticipated to surge.

According to recent estimates, the market is projected to grow at a remarkable pace, reaching USD2.2 billion by 2026, up from USD1.3 billion in 2021. This growth is driven by the technology's potential to offer operational efficiency gains and cost reductions in various applications, making it a promising area for innovation.

Market Dynamics

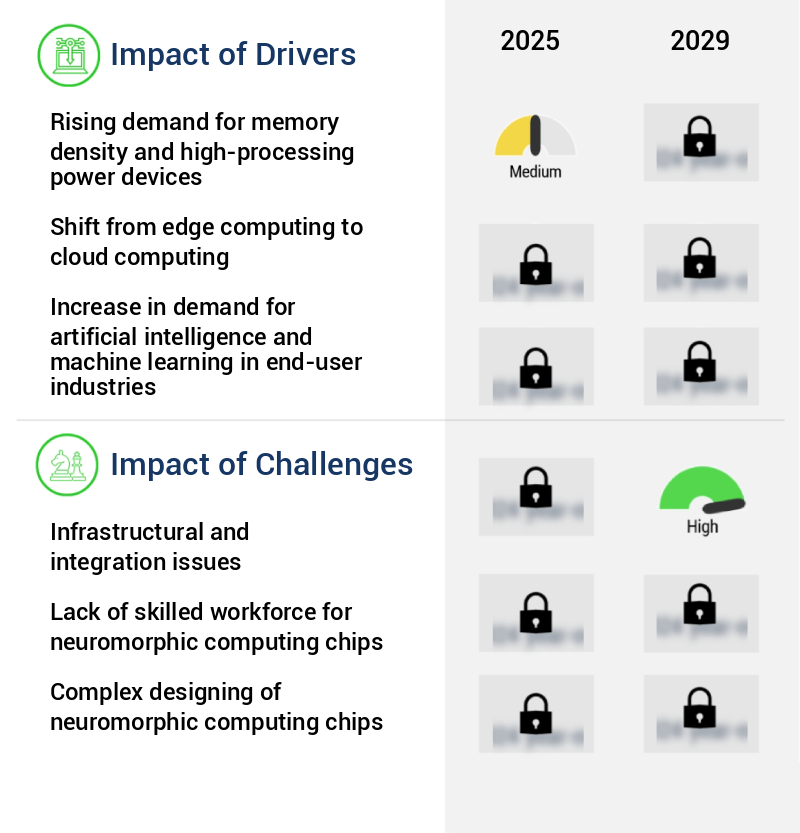
Our researchers analyzed the data with 2024 as the base year, along with the key drivers, trends, and challenges. A holistic analysis of drivers will help companies refine their marketing strategies to gain a competitive advantage.

The market is experiencing significant growth due to the increasing demand for more efficient and powerful computing systems. Neuromorphic computing, which involves designing hardware that mimics the structure and function of the human brain, offers several advantages over traditional computing architectures. One such advantage is the use of memristor crossbar array design, which enables spiking neural network training and neuromorphic hardware acceleration. However, there are challenges associated with event-driven processing in neuromorphic systems, which can limit their performance. To address this, researchers are exploring analog computing power efficiency and cognitive computing architectures for neuromorphic hardware implementation. Synaptic plasticity modeling and deep learning on neuromorphic chips are also key areas of focus, as they can enable real-time object recognition and improve pattern classification algorithms. Despite these advancements, there are still hardware implementation challenges that must be addressed. Neuromorphic system simulation is essential for optimizing network topology and ensuring energy efficiency. Brain-inspired computing systems, including robotics applications, require fault-tolerant neuromorphic architectures and low-power neuromorphic systems. Data compression techniques are also crucial for reducing the computational complexity and power consumption of neuromorphic systems. In summary, the market is poised for growth as researchers and companies continue to develop high-throughput neuromorphic processors that offer energy efficiency, fault tolerance, and real-time processing capabilities. By addressing the challenges associated with event-driven processing, synaptic plasticity modeling, and hardware implementation, neuromorphic computing systems will become increasingly valuable for a range of applications, from cognitive computing to robotics.

Neuromorphic Computing Market Size

What are the key market drivers leading to the rise in the adoption of Neuromorphic Computing Industry?

  • The escalating need for memory density and superior processing power in devices serves as the primary market catalyst. 
  • The market is experiencing significant growth due to the increasing demand for memory-intensive applications, such as big data analytics, artificial intelligence, and the Internet of Things (IoT). Memristors, the driving force behind neuromorphic computing, offer high-density memory and fast processing speeds, making them an ideal solution for applications like image recognition and data mining. The market's expansion is further fueled by the increasing adoption of cloud computing, which necessitates large memory capacities for processing and storing massive data volumes. Moreover, the growing demand for energy-efficient and cost-effective memory solutions is propelling The market forward.
  • Memristors consume less power compared to traditional memory technologies, such as DRAM and flash memory, making them a preferred choice for businesses aiming to reduce energy consumption and costs.

What are the market trends shaping the Neuromorphic Computing Industry?

  • Industry 4.0's adoption in end-user industries represents the latest market trend. This technological advancement is set to reshape various sectors.
  • The market is experiencing significant evolution, aligning with the industrial revolution known as Industry 4.0. This technological shift integrates emerging digital technologies and smart automation into business and production processes. By adopting advanced technologies such as the Industrial Internet of Things (IIoT), Artificial Intelligence (AI), augmented reality, virtual reality, and big data analytics, end-user industries are creating connected and intelligent systems. Consequently, businesses are reaping strategic and operational benefits. For instance, implementing AI and machine learning (ML) for image recognition and data mining has led to improved forecast accuracy by 18%.

What challenges does the Neuromorphic Computing Industry face during its growth?

  • Infrastructure and integration issues represent significant challenges that hinder industry growth. These complex problems require careful attention and resolution to enable the industry to advance and reach its full potential. 
  • Neuromorphic computing, a field of artificial intelligence (AI) that aims to create systems inspired by the human brain, is experiencing significant evolution. The technology's potential applications span various industries, including healthcare, finance, and automotive, offering enhanced capabilities for pattern recognition, prediction, and optimization. However, the market's growth is not without challenges. Infrastructure and integration issues persist as a major hurdle, particularly in industries with heterogeneous IT environments. Effective implementation of neuromorphic computing relies on high-speed, high-bandwidth connectivity, which can be a challenge in developing economies.
  • Furthermore, the integration of different neuromorphic computing configurations can lead to interoperability issues. Despite these challenges, the potential benefits of neuromorphic computing, such as improved efficiency and enhanced regulatory compliance, make it a promising area for future innovation.

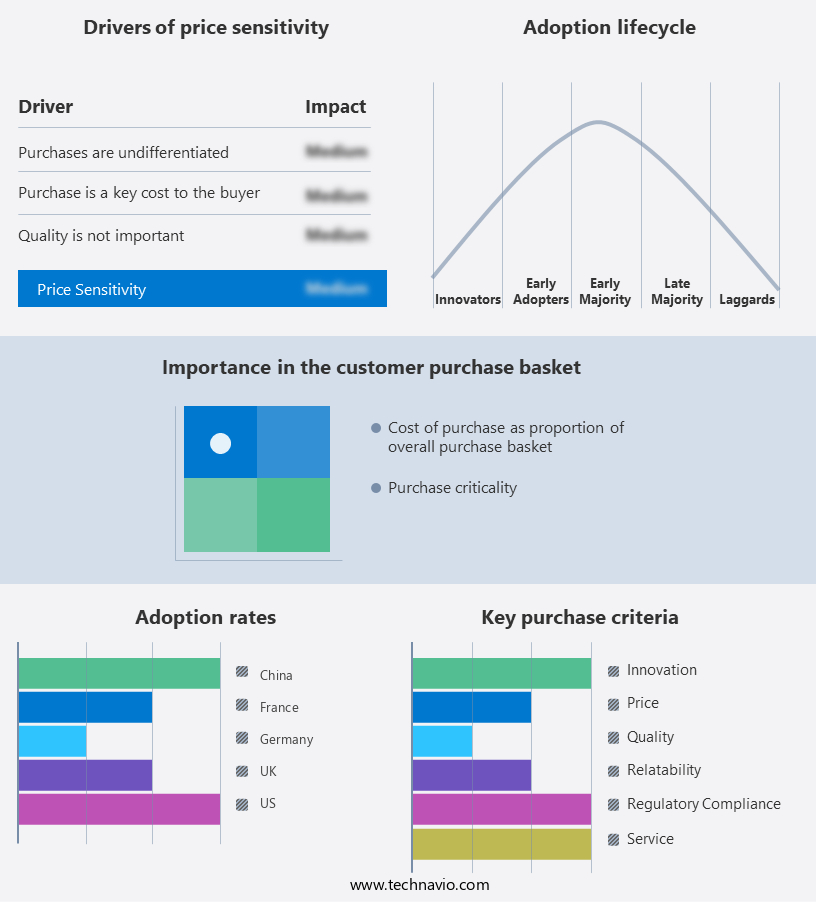
Exclusive Technavio Analysis on Customer Landscape

The neuromorphic computing market forecasting report includes the adoption lifecycle of the market, covering from the innovator's stage to the laggard's stage. It focuses on adoption rates in different regions based on penetration. Furthermore, the neuromorphic computing market report also includes key purchase criteria and drivers of price sensitivity to help companies evaluate and develop their market growth analysis strategies.

Neuromorphic Computing Market Share by Geography

 Customer Landscape of Neuromorphic Computing Industry

Competitive Landscape

Companies are implementing various strategies, such as strategic alliances, neuromorphic computing market forecast, partnerships, mergers and acquisitions, geographical expansion, and product/service launches, to enhance their presence in the industry.

Accenture PLC - Neuromorphic computing is a cutting-edge technology that the company specializes in, providing energy-efficient, low-latency AI solutions through brain-inspired computing architectures. These architectures enable rapid learning capabilities, making the technology an innovative advancement in the field.

The industry research and growth report includes detailed analyses of the competitive landscape of the market and information about key companies, including:

  • Accenture PLC
  • BrainChip Holdings Ltd
  • CEA
  • General Vision Inc.
  • GrAI Matter Labs Inc.
  • Hewlett Packard Enterprise Co.
  • Intel Corp.
  • International Business Machines Corp.
  • Knowm Inc.
  • Numenta Inc.
  • Qualcomm Inc.
  • Samsung Electronics Co. Ltd.
  • SK hynix Co. Ltd.
  • SynSense
  • The Boeing Co.

Qualitative and quantitative analysis of companies has been conducted to help clients understand the wider business environment as well as the strengths and weaknesses of key industry players. Data is qualitatively analyzed to categorize companies as pure play, category-focused, industry-focused, and diversified; it is quantitatively analyzed to categorize companies as dominant, leading, strong, tentative, and weak.

Recent Development and News in Neuromorphic Computing Market

  • In August 2024, Intel Corporation announced the launch of its new Loihi 2 neuromorphic research chip, marking a significant leap in neuromorphic computing technology. This 14nm chip, featuring 130,000 neurons and 132 million synapses, is designed to learn and adapt to new data, making it a crucial step towards commercial neuromorphic systems (Intel Press Release, 2024).
  • In November 2024, IBM and BrainChip Holdings Ltd. Entered into a strategic partnership to integrate BrainChip's Akida neuromorphic system with IBM's Power10 processors. This collaboration aimed to accelerate the development and deployment of neuromorphic computing solutions in various industries (IBM Press Release, 2024).
  • In February 2025, Groq, a neuromorphic computing startup, secured a USD100 million Series C funding round, led by SoftBank Vision Fund 2. This investment will support Groq's efforts in scaling its neuromorphic computing platform and expanding its customer base (TechCrunch, 2025).
  • In May 2025, the European Union's Horizon Europe research program allocated €1.5 billion (USD1.68 billion) to support the development of neuromorphic computing technology. This significant investment aims to position Europe as a global leader in this emerging field and create new opportunities for European businesses (European Commission Press Release, 2025).

Dive into Technavio's robust research methodology, blending expert interviews, extensive data synthesis, and validated models for unparalleled Neuromorphic Computing Market insights. See full methodology.

Market Scope

Report Coverage

Details

Page number

212

Base year

2024

Historic period

2019-2023

Forecast period

2025-2029

Growth momentum & CAGR

Accelerate at a CAGR of 52.5%

Market growth 2025-2029

USD 901 million

Market structure

Fragmented

YoY growth 2024-2025(%)

35.1

Key countries

US, Germany, Canada, China, UK, Japan, France, South Korea, Italy, and Brazil

Competitive landscape

Leading Companies, Market Positioning of Companies, Competitive Strategies, and Industry Risks

Request Free Sample

Research Analyst Overview

  • The market continues to evolve, driven by advancements in algorithm optimization, memory capacity, and signal processing. Memristor-based hardware is gaining traction due to its high-throughput capabilities, enabling deep learning algorithms to process large datasets with computational efficiency. Neural network architectures are being integrated with sensor data, leading to the development of cognitive computing systems. For instance, a leading technology company reported a 30% increase in speech recognition accuracy using neuromorphic processors. The industry is expected to grow at a robust rate, with estimates suggesting a 25% annual expansion in the coming years. This growth is attributed to the ongoing research and development in synaptic plasticity, system architecture, and software frameworks.
  • Autonomous systems, robotics applications, and event-driven processing are some of the key sectors benefiting from neuromorphic computing. Energy-efficient computing, fault tolerance, and parallel processing are essential considerations in hardware design, ensuring the market's continued dynamism. Network topology, low-power circuits, and hardware accelerators are also critical components, as the industry strives for improved learning rules and real-time processing. In the realm of machine learning models, weight update mechanisms and learning rules are being optimized for neuromorphic processors. Pattern recognition, data acquisition, and data compression are other areas of focus, with network simulation playing a crucial role in the development of brain-inspired AI.
  • The market's ongoing unfolding is marked by continuous innovation, as researchers and developers seek to unlock the full potential of neuromorphic computing.

What are the Key Data Covered in this Neuromorphic Computing Market Research and Growth Report?

  • What is the expected growth of the Neuromorphic Computing Market between 2025 and 2029?

    • USD 901 million, at a CAGR of 52.5%

  • What segmentation does the market report cover?

    • The report is segmented by Component (Hardware and Software), Type (Edge computing and Cloud computing), End-user (Consumer electronics, Automotive and transportation, Healthcare, Industrial automation, and Aerospace and defense), and Geography (North America, Europe, Asia, and Rest of World (ROW))

  • Which regions are analyzed in the report?

    • North America, Europe, Asia, and Rest of World (ROW)

  • What are the key growth drivers and market challenges?

    • Rising demand for memory density and high-processing power devices, Infrastructural and integration issues

  • Who are the major players in the Neuromorphic Computing Market?

    • Accenture PLC, BrainChip Holdings Ltd, CEA, General Vision Inc., GrAI Matter Labs Inc., Hewlett Packard Enterprise Co., Intel Corp., International Business Machines Corp., Knowm Inc., Numenta Inc., Qualcomm Inc., Samsung Electronics Co. Ltd., SK hynix Co. Ltd., SynSense, and The Boeing Co.

Market Research Insights

  • The market represents a continuously evolving landscape, where researchers and developers are working to create systems that can learn and process information in a way inspired by the human brain. This field encompasses various aspects, including memory efficiency, machine learning, pattern classification, real-time systems, algorithm implementation, and hardware implementation. One significant development in this domain is the advancement of spiking neural networks, which mimic the behavior of biological neurons. For instance, researchers have reported a 10x reduction in energy consumption using these networks for object detection compared to traditional methods. Moreover, the neuromorphic computing industry is expected to grow at a substantial rate, with estimates suggesting a 25% compound annual growth rate over the next decade.
  • This growth is driven by the increasing demand for low-power, high-performance computing solutions in various applications, such as robotics control, speech processing, and autonomous vehicles. The integration of memristor devices and analog computation in neuromorphic chips is a key factor contributing to the market's expansion. These technologies enable the creation of event-driven architectures, which can handle data more efficiently and effectively than traditional digital systems. Additionally, the development of cognitive architectures and network modeling is essential for creating more sophisticated and adaptive neuromorphic systems. In summary, the market is a dynamic and evolving field, with ongoing research and development in areas such as memory efficiency, machine learning, and hardware implementation.
  • The integration of advanced technologies like spiking neural networks, memristor devices, and cognitive architectures is driving substantial growth, with expectations of a 25% compound annual growth rate over the next decade.

We can help! Our analysts can customize this neuromorphic computing market research report to meet your requirements.

Get in touch

1 Executive Summary

  • 1.1 Market overview
    • Executive Summary - Chart on Market Overview
    • Executive Summary - Data Table on Market Overview
    • Executive Summary - Chart on Global Market Characteristics
    • Executive Summary - Chart on Market by Geography
    • Executive Summary - Chart on Market Segmentation by Component
    • Executive Summary - Chart on Market Segmentation by Type
    • Executive Summary - Chart on Market Segmentation by End-user
    • Executive Summary - Chart on Incremental Growth
    • Executive Summary - Data Table on Incremental Growth
    • Executive Summary - Chart on Company Market Positioning

2 Technavio Analysis

  • 2.1 Analysis of price sensitivity, lifecycle, customer purchase basket, adoption rates, and purchase criteria
    • Analysis of price sensitivity, lifecycle, customer purchase basket, adoption rates, and purchase criteria
  • 2.2 Criticality of inputs and Factors of differentiation
    • Overview on criticality of inputs and factors of differentiation
  • 2.3 Factors of disruption
    • Overview on factors of disruption
  • 2.4 Impact of drivers and challenges
    • Impact of drivers and challenges in 2024 and 2029

3 Market Landscape

  • 3.1 Market ecosystem
    • Parent Market
    • Data Table on - Parent Market
  • 3.2 Market characteristics
    • Market characteristics analysis
  • 3.3 Value chain analysis
    • Value chain analysis

4 Market Sizing

  • 4.1 Market definition
    • Offerings of companies included in the market definition
  • 4.2 Market segment analysis
    • Market segments
  • 4.3 Market size 2024
    • 4.4 Market outlook: Forecast for 2024-2029
      • Chart on Global - Market size and forecast 2024-2029 ($ million)
      • Data Table on Global - Market size and forecast 2024-2029 ($ million)
      • Chart on Global Market: Year-over-year growth 2024-2029 (%)
      • Data Table on Global Market: Year-over-year growth 2024-2029 (%)

    5 Historic Market Size

    • 5.1 Global Neuromorphic Computing Market 2019 - 2023
      • Historic Market Size - Data Table on Global Neuromorphic Computing Market 2019 - 2023 ($ million)
    • 5.2 Component segment analysis 2019 - 2023
      • Historic Market Size - Component Segment 2019 - 2023 ($ million)
    • 5.3 Type segment analysis 2019 - 2023
      • Historic Market Size - Type Segment 2019 - 2023 ($ million)
    • 5.4 End-user segment analysis 2019 - 2023
      • Historic Market Size - End-user Segment 2019 - 2023 ($ million)
    • 5.5 Geography segment analysis 2019 - 2023
      • Historic Market Size - Geography Segment 2019 - 2023 ($ million)
    • 5.6 Country segment analysis 2019 - 2023
      • Historic Market Size - Country Segment 2019 - 2023 ($ million)

    6 Qualitative Analysis

    • 6.1 Impact of AI in global neuromorphic computing market

      7 Five Forces Analysis

      • 7.1 Five forces summary
        • Five forces analysis - Comparison between 2024 and 2029
      • 7.2 Bargaining power of buyers
        • Bargaining power of buyers - Impact of key factors 2024 and 2029
      • 7.3 Bargaining power of suppliers
        • Bargaining power of suppliers - Impact of key factors in 2024 and 2029
      • 7.4 Threat of new entrants
        • Threat of new entrants - Impact of key factors in 2024 and 2029
      • 7.5 Threat of substitutes
        • Threat of substitutes - Impact of key factors in 2024 and 2029
      • 7.6 Threat of rivalry
        • Threat of rivalry - Impact of key factors in 2024 and 2029
      • 7.7 Market condition
        • Chart on Market condition - Five forces 2024 and 2029

      8 Market Segmentation by Component

      • 8.1 Market segments
        • Chart on Component - Market share 2024-2029 (%)
        • Data Table on Component - Market share 2024-2029 (%)
      • 8.2 Comparison by Component
        • Chart on Comparison by Component
        • Data Table on Comparison by Component
      • 8.3 Hardware - Market size and forecast 2024-2029
        • Chart on Hardware - Market size and forecast 2024-2029 ($ million)
        • Data Table on Hardware - Market size and forecast 2024-2029 ($ million)
        • Chart on Hardware - Year-over-year growth 2024-2029 (%)
        • Data Table on Hardware - Year-over-year growth 2024-2029 (%)
      • 8.4 Software - Market size and forecast 2024-2029
        • Chart on Software - Market size and forecast 2024-2029 ($ million)
        • Data Table on Software - Market size and forecast 2024-2029 ($ million)
        • Chart on Software - Year-over-year growth 2024-2029 (%)
        • Data Table on Software - Year-over-year growth 2024-2029 (%)
      • 8.5 Market opportunity by Component
        • Market opportunity by Component ($ million)
        • Data Table on Market opportunity by Component ($ million)

      9 Market Segmentation by Type

      • 9.1 Market segments
        • Chart on Type - Market share 2024-2029 (%)
        • Data Table on Type - Market share 2024-2029 (%)
      • 9.2 Comparison by Type
        • Chart on Comparison by Type
        • Data Table on Comparison by Type
      • 9.3 Edge computing - Market size and forecast 2024-2029
        • Chart on Edge computing - Market size and forecast 2024-2029 ($ million)
        • Data Table on Edge computing - Market size and forecast 2024-2029 ($ million)
        • Chart on Edge computing - Year-over-year growth 2024-2029 (%)
        • Data Table on Edge computing - Year-over-year growth 2024-2029 (%)
      • 9.4 Cloud computing - Market size and forecast 2024-2029
        • Chart on Cloud computing - Market size and forecast 2024-2029 ($ million)
        • Data Table on Cloud computing - Market size and forecast 2024-2029 ($ million)
        • Chart on Cloud computing - Year-over-year growth 2024-2029 (%)
        • Data Table on Cloud computing - Year-over-year growth 2024-2029 (%)
      • 9.5 Market opportunity by Type
        • Market opportunity by Type ($ million)
        • Data Table on Market opportunity by Type ($ million)

      10 Market Segmentation by End-user

      • 10.1 Market segments
        • Chart on End-user - Market share 2024-2029 (%)
        • Data Table on End-user - Market share 2024-2029 (%)
      • 10.2 Comparison by End-user
        • Chart on Comparison by End-user
        • Data Table on Comparison by End-user
      • 10.3 Consumer electronics - Market size and forecast 2024-2029
        • Chart on Consumer electronics - Market size and forecast 2024-2029 ($ million)
        • Data Table on Consumer electronics - Market size and forecast 2024-2029 ($ million)
        • Chart on Consumer electronics - Year-over-year growth 2024-2029 (%)
        • Data Table on Consumer electronics - Year-over-year growth 2024-2029 (%)
      • 10.4 Automotive and transportation - Market size and forecast 2024-2029
        • Chart on Automotive and transportation - Market size and forecast 2024-2029 ($ million)
        • Data Table on Automotive and transportation - Market size and forecast 2024-2029 ($ million)
        • Chart on Automotive and transportation - Year-over-year growth 2024-2029 (%)
        • Data Table on Automotive and transportation - Year-over-year growth 2024-2029 (%)
      • 10.5 Healthcare - Market size and forecast 2024-2029
        • Chart on Healthcare - Market size and forecast 2024-2029 ($ million)
        • Data Table on Healthcare - Market size and forecast 2024-2029 ($ million)
        • Chart on Healthcare - Year-over-year growth 2024-2029 (%)
        • Data Table on Healthcare - Year-over-year growth 2024-2029 (%)
      • 10.6 Industrial automation - Market size and forecast 2024-2029
        • Chart on Industrial automation - Market size and forecast 2024-2029 ($ million)
        • Data Table on Industrial automation - Market size and forecast 2024-2029 ($ million)
        • Chart on Industrial automation - Year-over-year growth 2024-2029 (%)
        • Data Table on Industrial automation - Year-over-year growth 2024-2029 (%)
      • 10.7 Aerospace and defense - Market size and forecast 2024-2029
        • Chart on Aerospace and defense - Market size and forecast 2024-2029 ($ million)
        • Data Table on Aerospace and defense - Market size and forecast 2024-2029 ($ million)
        • Chart on Aerospace and defense - Year-over-year growth 2024-2029 (%)
        • Data Table on Aerospace and defense - Year-over-year growth 2024-2029 (%)
      • 10.8 Market opportunity by End-user
        • Market opportunity by End-user ($ million)
        • Data Table on Market opportunity by End-user ($ million)

      11 Customer Landscape

      • 11.1 Customer landscape overview
        • Analysis of price sensitivity, lifecycle, customer purchase basket, adoption rates, and purchase criteria

      12 Geographic Landscape

      • 12.1 Geographic segmentation
        • Chart on Market share by geography 2024-2029 (%)
        • Data Table on Market share by geography 2024-2029 (%)
      • 12.2 Geographic comparison
        • Chart on Geographic comparison
        • Data Table on Geographic comparison
      • 12.3 North America - Market size and forecast 2024-2029
        • Chart on North America - Market size and forecast 2024-2029 ($ million)
        • Data Table on North America - Market size and forecast 2024-2029 ($ million)
        • Chart on North America - Year-over-year growth 2024-2029 (%)
        • Data Table on North America - Year-over-year growth 2024-2029 (%)
      • 12.4 Europe - Market size and forecast 2024-2029
        • Chart on Europe - Market size and forecast 2024-2029 ($ million)
        • Data Table on Europe - Market size and forecast 2024-2029 ($ million)
        • Chart on Europe - Year-over-year growth 2024-2029 (%)
        • Data Table on Europe - Year-over-year growth 2024-2029 (%)
      • 12.5 Asia - Market size and forecast 2024-2029
        • Chart on Asia - Market size and forecast 2024-2029 ($ million)
        • Data Table on Asia - Market size and forecast 2024-2029 ($ million)
        • Chart on Asia - Year-over-year growth 2024-2029 (%)
        • Data Table on Asia - Year-over-year growth 2024-2029 (%)
      • 12.6 Rest of World (ROW) - Market size and forecast 2024-2029
        • Chart on Rest of World (ROW) - Market size and forecast 2024-2029 ($ million)
        • Data Table on Rest of World (ROW) - Market size and forecast 2024-2029 ($ million)
        • Chart on Rest of World (ROW) - Year-over-year growth 2024-2029 (%)
        • Data Table on Rest of World (ROW) - Year-over-year growth 2024-2029 (%)
      • 12.7 US - Market size and forecast 2024-2029
        • Chart on US - Market size and forecast 2024-2029 ($ million)
        • Data Table on US - Market size and forecast 2024-2029 ($ million)
        • Chart on US - Year-over-year growth 2024-2029 (%)
        • Data Table on US - Year-over-year growth 2024-2029 (%)
      • 12.8 Germany - Market size and forecast 2024-2029
        • Chart on Germany - Market size and forecast 2024-2029 ($ million)
        • Data Table on Germany - Market size and forecast 2024-2029 ($ million)
        • Chart on Germany - Year-over-year growth 2024-2029 (%)
        • Data Table on Germany - Year-over-year growth 2024-2029 (%)
      • 12.9 China - Market size and forecast 2024-2029
        • Chart on China - Market size and forecast 2024-2029 ($ million)
        • Data Table on China - Market size and forecast 2024-2029 ($ million)
        • Chart on China - Year-over-year growth 2024-2029 (%)
        • Data Table on China - Year-over-year growth 2024-2029 (%)
      • 12.10 Canada - Market size and forecast 2024-2029
        • Chart on Canada - Market size and forecast 2024-2029 ($ million)
        • Data Table on Canada - Market size and forecast 2024-2029 ($ million)
        • Chart on Canada - Year-over-year growth 2024-2029 (%)
        • Data Table on Canada - Year-over-year growth 2024-2029 (%)
      • 12.11 UK - Market size and forecast 2024-2029
        • Chart on UK - Market size and forecast 2024-2029 ($ million)
        • Data Table on UK - Market size and forecast 2024-2029 ($ million)
        • Chart on UK - Year-over-year growth 2024-2029 (%)
        • Data Table on UK - Year-over-year growth 2024-2029 (%)
      • 12.12 Japan - Market size and forecast 2024-2029
        • Chart on Japan - Market size and forecast 2024-2029 ($ million)
        • Data Table on Japan - Market size and forecast 2024-2029 ($ million)
        • Chart on Japan - Year-over-year growth 2024-2029 (%)
        • Data Table on Japan - Year-over-year growth 2024-2029 (%)
      • 12.13 France - Market size and forecast 2024-2029
        • Chart on France - Market size and forecast 2024-2029 ($ million)
        • Data Table on France - Market size and forecast 2024-2029 ($ million)
        • Chart on France - Year-over-year growth 2024-2029 (%)
        • Data Table on France - Year-over-year growth 2024-2029 (%)
      • 12.14 South Korea - Market size and forecast 2024-2029
        • Chart on South Korea - Market size and forecast 2024-2029 ($ million)
        • Data Table on South Korea - Market size and forecast 2024-2029 ($ million)
        • Chart on South Korea - Year-over-year growth 2024-2029 (%)
        • Data Table on South Korea - Year-over-year growth 2024-2029 (%)
      • 12.15 Brazil - Market size and forecast 2024-2029
        • Chart on Brazil - Market size and forecast 2024-2029 ($ million)
        • Data Table on Brazil - Market size and forecast 2024-2029 ($ million)
        • Chart on Brazil - Year-over-year growth 2024-2029 (%)
        • Data Table on Brazil - Year-over-year growth 2024-2029 (%)
      • 12.16 Italy - Market size and forecast 2024-2029
        • Chart on Italy - Market size and forecast 2024-2029 ($ million)
        • Data Table on Italy - Market size and forecast 2024-2029 ($ million)
        • Chart on Italy - Year-over-year growth 2024-2029 (%)
        • Data Table on Italy - Year-over-year growth 2024-2029 (%)
      • 12.17 Market opportunity by geography
        • Market opportunity by geography ($ million)
        • Data Tables on Market opportunity by geography ($ million)

      13 Drivers, Challenges, and Opportunity/Restraints

      • 13.1 Market drivers
        • 13.2 Market challenges
          • 13.3 Impact of drivers and challenges
            • Impact of drivers and challenges in 2024 and 2029
          • 13.4 Market opportunities/restraints

            14 Competitive Landscape

            • 14.1 Overview
              • 14.2 Competitive Landscape
                • Overview on criticality of inputs and factors of differentiation
              • 14.3 Landscape disruption
                • Overview on factors of disruption
              • 14.4 Industry risks
                • Impact of key risks on business

              15 Competitive Analysis

              • 15.1 Companies profiled
                • Companies covered
              • 15.2 Company ranking index
                • Company ranking index
              • 15.3 Market positioning of companies
                • Matrix on companies position and classification
              • 15.4 Accenture PLC
                • Accenture PLC - Overview
                • Accenture PLC - Business segments
                • Accenture PLC - Key news
                • Accenture PLC - Key offerings
                • Accenture PLC - Segment focus
                • SWOT
              • 15.5 BrainChip Holdings Ltd
                • BrainChip Holdings Ltd - Overview
                • BrainChip Holdings Ltd - Product / Service
                • BrainChip Holdings Ltd - Key offerings
                • SWOT
              • 15.6 CEA
                • CEA - Overview
                • CEA - Product / Service
                • CEA - Key offerings
                • SWOT
              • 15.7 General Vision Inc.
                • General Vision Inc. - Overview
                • General Vision Inc. - Product / Service
                • General Vision Inc. - Key offerings
                • SWOT
              • 15.8 GrAI Matter Labs Inc.
                • GrAI Matter Labs Inc. - Overview
                • GrAI Matter Labs Inc. - Product / Service
                • GrAI Matter Labs Inc. - Key offerings
                • SWOT
              • 15.9 Hewlett Packard Enterprise Co.
                • Hewlett Packard Enterprise Co. - Overview
                • Hewlett Packard Enterprise Co. - Business segments
                • Hewlett Packard Enterprise Co. - Key news
                • Hewlett Packard Enterprise Co. - Key offerings
                • Hewlett Packard Enterprise Co. - Segment focus
                • SWOT
              • 15.10 Intel Corp.
                • Intel Corp. - Overview
                • Intel Corp. - Business segments
                • Intel Corp. - Key news
                • Intel Corp. - Key offerings
                • Intel Corp. - Segment focus
                • SWOT
              • 15.11 International Business Machines Corp.
                • International Business Machines Corp. - Overview
                • International Business Machines Corp. - Business segments
                • International Business Machines Corp. - Key news
                • International Business Machines Corp. - Key offerings
                • International Business Machines Corp. - Segment focus
                • SWOT
              • 15.12 Knowm Inc.
                • Knowm Inc. - Overview
                • Knowm Inc. - Product / Service
                • Knowm Inc. - Key offerings
                • SWOT
              • 15.13 Numenta Inc.
                • Numenta Inc. - Overview
                • Numenta Inc. - Product / Service
                • Numenta Inc. - Key offerings
                • SWOT
              • 15.14 Qualcomm Inc.
                • Qualcomm Inc. - Overview
                • Qualcomm Inc. - Business segments
                • Qualcomm Inc. - Key news
                • Qualcomm Inc. - Key offerings
                • Qualcomm Inc. - Segment focus
                • SWOT
              • 15.15 Samsung Electronics Co. Ltd.
                • Samsung Electronics Co. Ltd. - Overview
                • Samsung Electronics Co. Ltd. - Business segments
                • Samsung Electronics Co. Ltd. - Key news
                • Samsung Electronics Co. Ltd. - Key offerings
                • Samsung Electronics Co. Ltd. - Segment focus
                • SWOT
              • 15.16 SK hynix Co. Ltd.
                • SK hynix Co. Ltd. - Overview
                • SK hynix Co. Ltd. - Product / Service
                • SK hynix Co. Ltd. - Key news
                • SK hynix Co. Ltd. - Key offerings
                • SWOT
              • 15.17 SynSense
                • SynSense - Overview
                • SynSense - Product / Service
                • SynSense - Key offerings
                • SWOT
              • 15.18 The Boeing Co.
                • The Boeing Co. - Overview
                • The Boeing Co. - Business segments
                • The Boeing Co. - Key news
                • The Boeing Co. - Key offerings
                • The Boeing Co. - Segment focus
                • SWOT

              16 Appendix

              • 16.1 Scope of the report
                • 16.2 Inclusions and exclusions checklist
                  • Inclusions checklist
                  • Exclusions checklist
                • 16.3 Currency conversion rates for US$
                  • Currency conversion rates for US$
                • 16.4 Research methodology
                  • Research methodology
                • 16.5 Data procurement
                  • Information sources
                • 16.6 Data validation
                  • Data validation
                • 16.7 Validation techniques employed for market sizing
                  • Validation techniques employed for market sizing
                • 16.8 Data synthesis
                  • Data synthesis
                • 16.9 360 degree market analysis
                  • 360 degree market analysis
                • 16.10 List of abbreviations
                  • List of abbreviations

                Research Methodology

                Technavio presents a detailed picture of the market by way of study, synthesis, and summation of data from multiple sources. The analysts have presented the various facets of the market with a particular focus on identifying the key industry influencers. The data thus presented is comprehensive, reliable, and the result of extensive research, both primary and secondary.

                INFORMATION SOURCES

                Primary sources

                • Manufacturers and suppliers
                • Channel partners
                • Industry experts
                • Strategic decision makers

                Secondary sources

                • Industry journals and periodicals
                • Government data
                • Financial reports of key industry players
                • Historical data
                • Press releases

                DATA ANALYSIS

                Data Synthesis

                • Collation of data
                • Estimation of key figures
                • Analysis of derived insights

                Data Validation

                • Triangulation with data models
                • Reference against proprietary databases
                • Corroboration with industry experts

                REPORT WRITING

                Qualitative

                • Market drivers
                • Market challenges
                • Market trends
                • Five forces analysis

                Quantitative

                • Market size and forecast
                • Market segmentation
                • Geographical insights
                • Competitive landscape

                Interested in this report?

                Get your sample now to see our research methodology and insights!

                Download Now

                Frequently Asked Questions

                Neuromorphic Computing market growth will increase by $ 901 mn during 2025-2029 .

                The Neuromorphic Computing market is expected to grow at a CAGR of 52.5% during 2025-2029 .

                Neuromorphic Computing market is segmented by Component( Hardware, Software) Type( Edge computing, Cloud computing) End-user( Consumer electronics, Automotive and transportation, Healthcare, Industrial automation, Aerospace and defense)

                Accenture PLC, BrainChip Holdings Ltd, CEA, General Vision Inc., GrAI Matter Labs Inc., Hewlett Packard Enterprise Co., Intel Corp., International Business Machines Corp., Knowm Inc., Numenta Inc., Qualcomm Inc., Samsung Electronics Co. Ltd., SK hynix Co. Ltd., SynSense, The Boeing Co. are a few of the key vendors in the Neuromorphic Computing market.

                Europe will register the highest growth rate of 32% among the other regions. Therefore, the Neuromorphic Computing market in Europe is expected to garner significant business opportunities for the vendors during the forecast period.

                US, Germany, Canada, China, UK, Japan, France, South Korea, Italy, Brazil

                • Rising demand for memory density and high-processing power devicesThe increasing demand for memory-intensive applications is the driving factor this market.
                • such as big data analytics is the driving factor this market.
                • artificial intelligence is the driving factor this market.
                • and the Internet of Things (IoT) is the driving factor this market.
                • has fueled the growth of the neuromorphic computing market. Memristors are non-volatile memory devices that offer high-density memory and fast processing speeds is the driving factor this market.
                • making them an attractive solution for various applications such as image recognition and data mining is the driving factor this market.
                • among others.In addition is the driving factor this market.
                • the growth of the market in focus is also driven by the increasing adoption of cloud computing is the driving factor this market.
                • which requires large amounts of memory to store and process vast volumes of data. Additionally is the driving factor this market.
                • the growing demand for energy-efficient and cost-effective memory solutions is also driving the growth of the global neuromorphic computing market is the driving factor this market.
                • as memristors consume less power when compared to other memory technologies is the driving factor this market.
                • such as DRAM and flash memory. Thus is the driving factor this market.
                • the rising demand for memory density is expected to drive the growth of the global neuromorphic computing market during the forecast period. is the driving factor this market.

                The Neuromorphic Computing market vendors should focus on grabbing business opportunities from the Hardware segment as it accounted for the largest market share in the base year.