Digital Diabetes Management Market Size 2025-2029
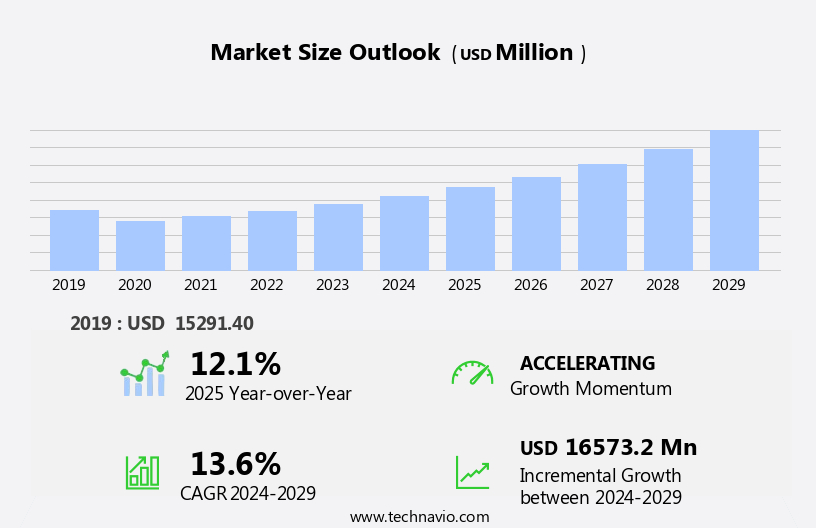
The digital diabetes management market size is forecast to increase by USD 16.57 billion, at a CAGR of 13.6% between 2024 and 2029.
- The market is witnessing significant growth due to the rising global burden of diabetes. The increasing prevalence of diabetes and the need for effective management solutions have created a substantial demand for digital diabetes management systems. Another key driver is the integration of Artificial Intelligence (AI) in wearable medical devices, enabling real-time monitoring and analysis of patient data, thereby improving diabetes management and outcomes.
- Companies must navigate these regulatory hurdles while ensuring the highest standards of data security and patient privacy to capitalize on the market opportunities and provide effective digital diabetes management solutions. However, the market faces challenges from stringent regulatory frameworks in digital diabetes management. Regulatory bodies are emphasizing data security and privacy concerns, which can hinder market growth.
What will be the Size of the Digital Diabetes Management Market during the forecast period?
Get Key Insights on Market Forecast (PDF)
Request Free Sample
- The market continues to evolve, offering innovative solutions for effective diabetes care across various sectors. Diabetes education resources, such as glycemic control algorithms and insulin pump therapy, have revolutionized type 1 diabetes management. The use of technology and digital tools to help people with diabetes track and control their disease is referred to as digital diabetes management. This covers gadgets, including glucometers, insulin pumps, continuous glucose monitoring systems, and mobile software. The oversight of the appropriate use of these technological instruments and the provision of thorough testing services for diabetes management are crucial functions of diagnostic centers.
- . For instance, a leading diabetes telehealth platform reported a 30% increase in patient engagement through remote monitoring and artificial pancreas systems. Lifestyle modification programs and predictive diabetes models further support patients in managing their condition effectively. Wearable sensor technology and continuous glucose monitoring contribute to improved glycemic control and prevent diabetes complications. Industry growth in digital diabetes management is expected to reach 15% annually, fueled by the integration of secure data transmission and health data interoperability.
How is this Digital Diabetes Management Industry segmented?
The digital diabetes management industry research report provides comprehensive data (region-wise segment analysis), with forecasts and estimates in "USD million" for the period 2025-2029, as well as historical data from 2019-2023 for the following segments.
- End-user
- Hospitals
- Home settings
- Diagnostic centers
- Type
- Wearable devices
- Hand-held devices
- Product
- SMBG meters
- Insulin pumps
- CGM devices
- CGM sensors
- Others
- Geography
- North America
- US
- Canada
- Europe
- France
- Germany
- Italy
- UK
- APAC
- China
- Japan
- South Korea
- South America
- Brazil
- Rest of World (ROW)
- North America
By End-user Insights
The Hospitals segment is estimated to witness significant growth during the forecast period. The hospital segment in the global digital diabetes management market refers to the use of digital tools and technologies for the management and treatment of diabetes within a hospital setting. This segment includes various digital solutions such as mobile applications, online platforms, electronic health records (EHRs), medical devices, and telehealth services that are used by healthcare professionals and patients to manage diabetes. The following are some key aspects of the hospital segment in the digital diabetes management market: Remote patient monitoring: Hospitals use technological instruments to remotely check diabetic patients blood glucose levels. Patients can achieve this by using glucose monitoring devices and sending information to medical personnel. It enables continuous monitoring of blood sugar levels, enabling prompt action and individualized treatment advice.
The home settings segment in the global digital diabetes management market refers to the use of digital technologies and devices for managing diabetes in the comfort of an individuals home. It encompasses various digital solutions that enable patients to monitor their blood glucose levels, track their insulin or medication intake, record their diet and exercise, and communicate with healthcare professionals remotely. Some key components of the home-settings segment in digital diabetes management include the following: Blood glucose monitoring tools: Without the necessity for conventional finger-prick testing, these tools enable patients to measure their blood glucose levels reliably and often. They frequently employ wearable or sensor-based technologies that can display real-time glucose measurements on a smartphone or other linked devices. Patient engagement strategies, such as medication adherence tools and personalized diabetes plans, enhance patient portal integration and data analytics dashboards
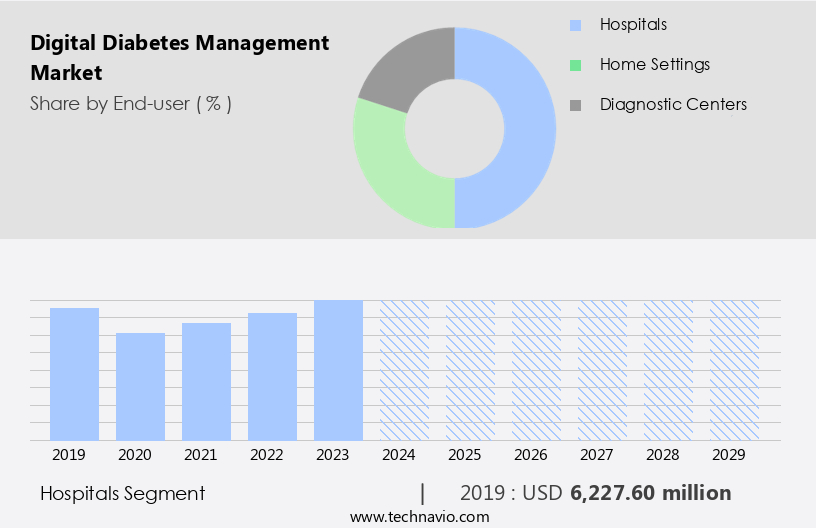
The Hospitals segment was valued at USD 6.23 billion in 2019 and showed a gradual increase during the forecast period.
The different diagnostics and testing services provided by healthcare institutions with a focus on diabetes management are referred to as diagnostic center services in the global digital diabetes management market. As it assists in the precise diagnosis, monitoring, and treatment of the condition, this part is essential to the overall management of diabetes. Cloud-based platforms enable remote patient monitoring, providing real-time hypoglycemia detection and insulin delivery systems. Type 2 diabetes management also benefits from digital advancements, including exercise recommendations, mental health support, and diabetes self-management education.
Regional Analysis
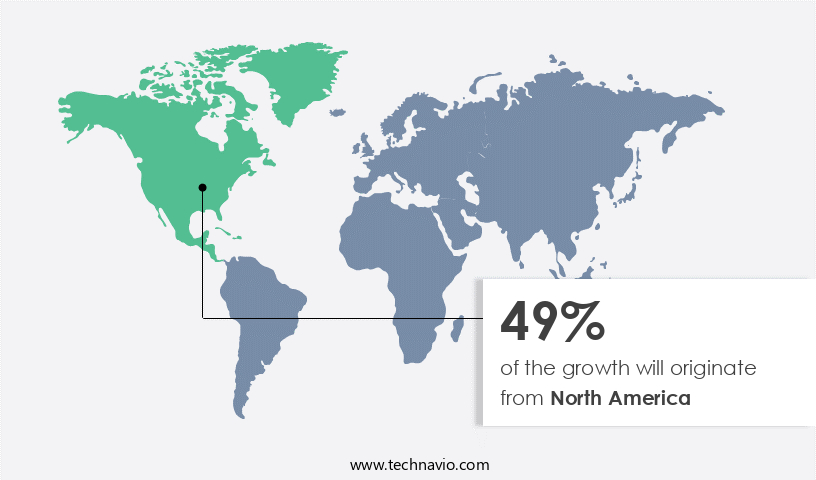
North America is estimated to contribute 49% to the growth of the global market during the forecast period. Technavio’s analysts have elaborately explained the regional trends and drivers that shape the market during the forecast period.
See How digital diabetes management market Demand is Rising in North America Request Free Sample
The market in North America is experiencing significant growth, driven by the increasing prevalence of diabetes and the region's adoption of smartphones and wearable technology. According to recent studies, over 34.2 million Americans have diabetes, and this number is projected to reach 48 million by 2034. In response, the market is expanding, offering solutions for medication management, food and exercise tracking, personalized insights, and remote blood sugar monitoring. Telemedicine platforms and remote patient monitoring equipment are also gaining popularity due to the demand for remote consultations and monitoring.
The market is expected to reach USD 36.5 billion by 2027, representing a 15.4% share of the global digital health market. This growth underscores the market's potential to revolutionize diabetes care and improve patient outcomes. Data-driven features such as patient data visualization and actionable health insights improve decision-making. Enhanced mobile app usability and glucose variability analysis tools are central to improving diabetes self management. Continuous innovation is focused on improving CGM data accuracy, integrating insulin pump data, and enhancing mobile health applications for better outcomes. Increased patient engagement in diabetes care is driven by intuitive diabetes data visualization tools and precise algorithm accuracy in glucose control.
Market Dynamics
Our researchers analyzed the data with 2024 as the base year, along with the key drivers, trends, and challenges. A holistic analysis of drivers will help companies refine their marketing strategies to gain a competitive advantage. The Digital Diabetes Management Market is transforming patient care through innovative technologies and data-driven tools. Enhanced blood glucose meter accuracy ensures precise readings, while diabetes telehealth platforms and mobile health applications enable continuous, remote support. Advanced carb counting software assists with meal planning, supported by hyperglycemia alerts for timely interventions. Integration of closed-loop insulin systems with cloud-based diabetes platforms provides seamless connectivity, while nutrition guidance and diabetes complications prevention programs empower patients in proactive health management.
Assessing telehealth platform effectiveness helps refine diabetes management system features, while initiatives for improving diabetes treatment adherence and personalizing diabetes care plans ensure tailored support. Interoperability is enhanced through patient portal integration methods and the adoption of a cloud-based diabetes management platform with robust data security in diabetes management safeguards. Comprehensive analysis through a diabetes data analytics dashboard enables care optimization. The adoption of predictive modeling for diabetes facilitates earlier interventions, and remote monitoring of diabetes patients strengthens clinical oversight.
Wearable innovations such as wearable sensor technology for diabetes improve continuous tracking, contributing to improving diabetes complications prevention. The market also leverages advanced analytics for diabetes management to derive actionable patterns and improve patient outcomes. Together, these solutions create an integrated ecosystem where clinical accuracy, patient engagement, and advanced technology converge to deliver personalized, efficient, and effective diabetes care in the digital era.
What are the key market drivers leading to the rise in the adoption of Digital Diabetes Management Industry?
- The escalating global prevalence of diabetes serves as the primary catalyst for market growth. Diabetes, a chronic condition characterized by the body's inability to effectively use insulin, is a growing health concern worldwide. With an estimated 463 million people living with diabetes globally, this number is projected to double in the next 25 years. The economic burden of diabetes is substantial, accounting for approximately 9% of total healthcare expenditures. In the US, the average annual medical expenditure for individuals with diagnosed diabetes reaches USD 7,900.
- This market is expected to experience a robust growth of around 25% over the next five years, offering innovative solutions such as remote monitoring systems, telehealth services, and mobile applications to effectively manage diabetes and improve patient outcomes. For instance, a recent study reported a 10% improvement in glycemic control through the use of a digital diabetes management system. The increasing incidence of both type 1 and type 2 diabetes will significantly escalate healthcare costs. The market is a promising response to this challenge.
What are the market trends shaping the Digital Diabetes Management Industry?
- The integration of artificial intelligence (AI) represents a significant trend in the development of wearable medical devices. Wearable medical devices, enhanced by AI, are becoming increasingly prevalent in the healthcare industry. The market is experiencing significant innovation, driven by advancements in technology and increasing consumer demand for compact, wearable devices. Manufacturers are leveraging technologies such as system-on-chip (SoC) and chip-scale package (CSP) to create smaller, more ergonomic healthcare wearables.
- This market is anticipated to grow substantially, with industry experts projecting a 20% expansion in the next five years. For instance, the introduction of systems like the MiniMed 670G, which offers automated insulin delivery that mimics the functions of a healthy pancreas, underscores the potential of this sector. Technological advancements, including 32-bit advanced RISC machines (ARM) architecture and wireless technologies like ANT and Bluetooth low energy (BLE), enable the development of devices that consume minimal power and offer extended battery life.
What challenges does the Digital Diabetes Management Industry face during its growth?
- The stringent regulatory framework poses a significant challenge to the growth of the digital diabetes management industry, requiring robust compliance to ensure effective implementation and patient safety. The market is experiencing significant growth due to the increasing prevalence of diabetes and the advancement of technology. According to a report, the global diabetes care devices market is projected to reach USD 33.6 billion by 2025, growing at a robust rate. Medical device regulations play a crucial role in ensuring the quality, efficiency, and safety of these technologies.
- Failure to comply with these regulations or causing complications can result in product recalls. A notable example is the recall of over 36,000 insulin pumps due to potential battery issues. Companies must navigate these regulatory hurdles to bring innovative solutions to market and improve patient care. Strict regulatory networks in regions such as Europe and the US present challenges for companies offering advanced digital diabetes management devices. For instance, the US Food and Drug Administration (FDA) classifies diabetes care management devices, including insulin pumps, infusion sets, and insulin bolus, under the Class II category.
Exclusive Customer Landscape
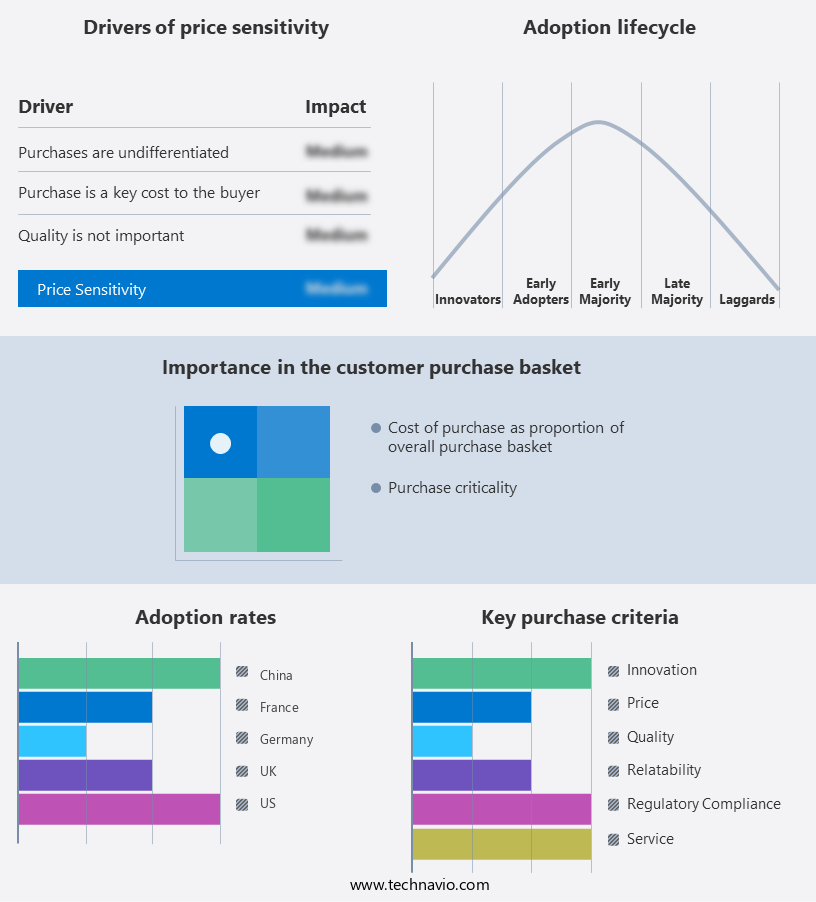
The digital diabetes management market forecasting report includes the adoption lifecycle of the market, covering from the innovator’s stage to the laggard’s stage. It focuses on adoption rates in different regions based on penetration. Furthermore, the digital diabetes management market report also includes key purchase criteria and drivers of price sensitivity to help companies evaluate and develop their market growth analysis strategies.
Customer Landscape
Key Companies & Market Insights
Companies are implementing various strategies, such as strategic alliances, digital diabetes management market forecast, partnerships, mergers and acquisitions, geographical expansion, and product/service launches, to enhance their presence in the industry.
Abbott Laboratories - The company specializes in digital diabetes management, specifically the FreeStyle Libre system, a revolutionary diabetes management product that provides real-time glucose monitoring and trend analysis for individuals with diabetes.
The industry research and growth report includes detailed analyses of the competitive landscape of the market and information about key companies, including:
- Abbott Laboratories
- B.Braun SE
- Becton Dickinson and Co.
- DarioHealth Corp.
- Dassault Systemes SE
- decide Clinical Software GmbH
- Dexcom Inc.
- F. Hoffmann La Roche Ltd.
- Glooko Inc.
- GlucoMe Ltd.
- Informed Data Systems Inc. and One Drop.
- Insulet Corp.
- LifeScan IP Holdings LLC
- Medtronic Plc
- Orpyx Medical Technologies Inc.
- PHC Holdings Corp.
- Sharecare Inc.
- SOCIALDIABETES SL
- Tandem Diabetes Care Inc.
- WaveForm Technologies Inc.
Qualitative and quantitative analysis of companies has been conducted to help clients understand the wider business environment as well as the strengths and weaknesses of key industry players. Data is qualitatively analyzed to categorize companies as pure play, category-focused, industry-focused, and diversified; it is quantitatively analyzed to categorize companies as dominant, leading, strong, tentative, and weak.
Recent Development and News in Digital Diabetes Management Market
- In January 2024, Medtronic, a leading medical technology company, announced the FDA approval of its MiniMed 780G Advanced Hybrid Closed Loop System, marking a significant technological advancement in digital diabetes management (Medtronic Press Release, 2024). This system uses real-time sensor data and algorithms to automatically adjust insulin delivery, enhancing the management of Type 1 diabetes.
- In March 2024, Abbott, a global healthcare company, launched the FreeStyle Libre 3 system, featuring a continuous glucose monitoring sensor with a 16-hour sensor lifespan and a 14-day wear duration (Abbott Press Release, 2024). This innovation offers increased convenience and accuracy for diabetes patients.
- In April 2025, Roche Diabetes Care and Google announced a strategic partnership to integrate Roche's Accu-Chek diabetes management solutions with Google Fit and Google Assistant (Roche Diabetes Care Press Release, 2025). This collaboration aims to provide seamless data integration and improved accessibility for diabetes patients.
- In May 2025, Dexcom, a leading continuous glucose monitoring company, raised USD 300 million in a funding round led by Fidelity Management & Research Company (Dexcom Press Release, 2025). The investment will support the development of new products and expand the company's global reach in the market.
Research Analyst Overview
- The market continues to evolve, with innovations in health coach interactions, patient support services, and remote monitoring efficacy driving growth. For instance, a recent study showed that remote care interventions led to a 21% reduction in HbA1c levels among diabetes patients. This trend is further fueled by the increasing availability of clinical trial data, predictive modeling accuracy, and patient reported outcomes. Blood glucose patterns and treatment adherence tracking are becoming essential health outcome measures, with real-time glucose data and patient feedback mechanisms enabling more personalized treatment plans. Algorithm accuracy metrics and telemedicine integration are also critical components, as are CGM integration APIs, diabetes management software, and longitudinal health data.
- However, system integration challenges, insulin dose calculations, and data privacy compliance remain significant hurdles. The industry is expected to grow at a rate of 12% annually, with advancements in sensor calibration methods, diabetes risk assessment, device interconnectivity, and advanced analytics models shaping the future landscape.
Dive into Technavio’s robust research methodology, blending expert interviews, extensive data synthesis, and validated models for unparalleled Digital Diabetes Management Market insights. See full methodology.
|
Market Scope |
|
|
Report Coverage |
Details |
|
Page number |
232 |
|
Base year |
2024 |
|
Historic period |
2019-2023 |
|
Forecast period |
2025-2029 |
|
Growth momentum & CAGR |
Accelerate at a CAGR of 13.6% |
|
Market growth 2025-2029 |
USD 16.57 billion |
|
Market structure |
Fragmented |
|
YoY growth 2024-2025(%) |
12.1 |
|
Key countries |
US, Germany, Canada, UK, China, France, Japan, Italy, Brazil, and South Korea |
|
Competitive landscape |
Leading Companies, Market Positioning of Companies, Competitive Strategies, and Industry Risks |
What are the Key Data Covered in this Digital Diabetes Management Market Research and Growth Report?
- CAGR of the Digital Diabetes Management industry during the forecast period
- Detailed information on factors that will drive the growth and forecasting between 2025 and 2029
- Precise estimation of the size of the market and its contribution of the industry in focus to the parent market
- Accurate predictions about upcoming growth and trends and changes in consumer behaviour
- Growth of the market across North America, Europe, Asia, and Rest of World (ROW)
- Thorough analysis of the market’s competitive landscape and detailed information about companies
- Comprehensive analysis of factors that will challenge the digital diabetes management market growth of industry companies
We can help! Our analysts can customize this digital diabetes management market research report to meet your requirements.
 RIA -
RIA - 
