
US Online Household Furniture Market Size 2025-2029
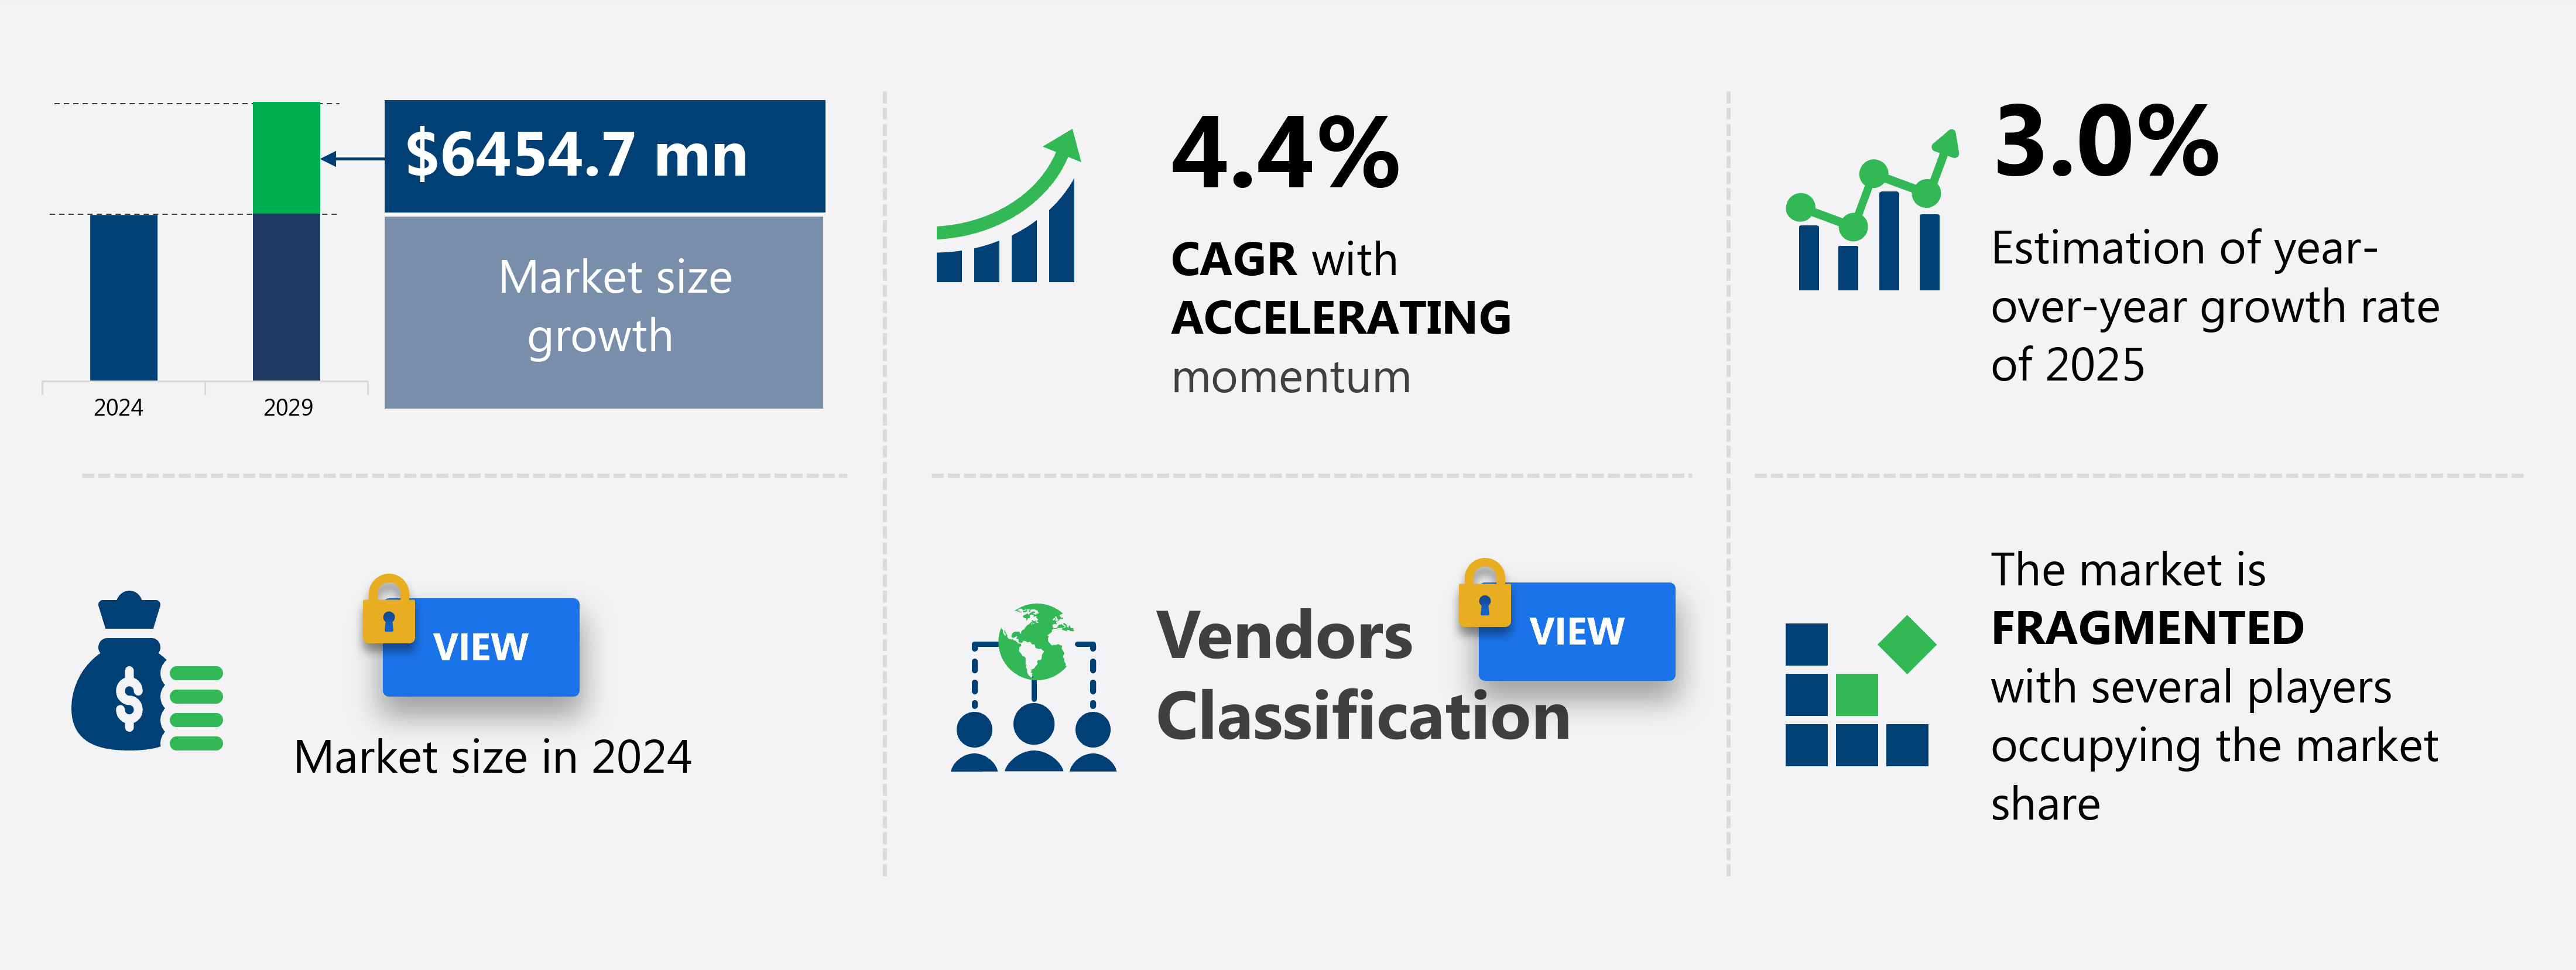
The US online household furniture market size is forecast to increase by USD 6.45 billion at a CAGR of 4.4% between 2024 and 2029.
- The US online household furniture market is growing, driven by consumer demand for convenience in home shopping and advancements in mobile platforms that simplify purchases. This report delivers valuable insights through detailed market size data, growth forecasts, and analysis of key segments like bedroom furniture, which leads due to its frequent online sale/e-commerce shopping. It highlights a key trend in personalized product offerings, meeting diverse customer tastes, while addressing a challenge from supply chain disruptions, which can delay deliveries. With data on regional dynamics, vendor approaches, and buyer preferences, this report enables businesses to optimize operations, enhance client experiences, and stay competitive in a fast-paced global landscape by navigating customization and logistics hurdles.
What will be the Size of the Market During the Forecast Period?
- In the digital world, online shopping has become a preferred choice for consumers seeking convenience and a wide range of options. Furniture shopping is no exception to this trend. The extensive furniture collections available online cater to diverse consumer preferences, from modern designs to rustic pieces made of traditional woods, metals, composites, and glass. The convenience of online furniture shopping allows consumers to browse and purchase from the comfort of their homes, eliminating the time-consuming excursion to brick-and-mortar stores. Smartphones and laptops have made it easier than ever to access these collections, enabling consumers to compare prices and features at their leisure.
- In addition, online furniture retailers offer customisation options, enabling consumers to tailor their furniture to their personal tastes. This level of customisation is not always possible in traditional settings. Moreover, consumers can take advantage of discounts and sales, ensuring they get the best value for their money. The rise of online furniture shopping has disrupted the traditional furniture market. Consumers now have access to a vast array of furniture options, allowing them to make informed decisions based on their preferences and budgets. The convenience and flexibility offered by online shopping have made it an attractive alternative to the traditional shopping experience.
How is this market segmented and which is the largest segment?
The market research report provides comprehensive data (region-wise segment analysis), with forecasts and estimates in "USD billion" for the period 2025-2029, as well as historical data from 2019-2023 for the following segments.
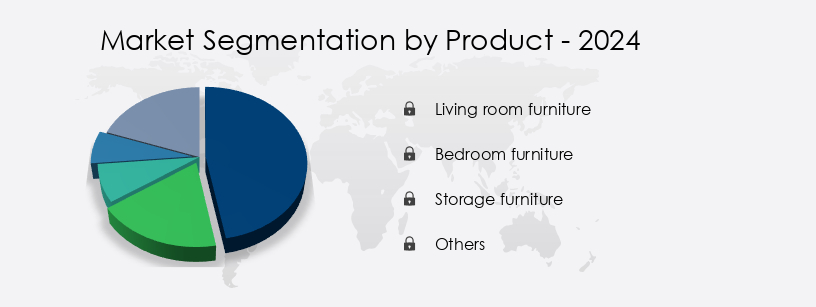
- Product
- Living room furniture
- Bedroom furniture
- Storage furniture
- Others
- Material
- Wood
- Metal
- Others
- Type
- Non-ready to assemble
- Ready to assemble
- Geography
- US
By Product Insights
The living room furniture segment is estimated to witness significant growth during the forecast period.The market holds substantial growth potential, particularly within the living room furniture segment. Consumers with elevated purchasing power are investing significantly in modern living room designs, featuring extensive furniture collections. These collections encompass a blend of traditional woods, metals, and rustic pieces. Multifunctional and multipurpose furniture, such as sofas and couches, are increasingly popular due to the trend of downsizing living spaces. Large families are adapting to smaller dwellings, necessitating seating solutions that offer versatility, such as chairs that can double as mini sofas or sectional sofas. This shift has driven the demand for online household furniture retailers, offering a wide range of modern designs and convenient shopping experiences.
Get a glance at the market report of share of various segments Request Free Sample
Market Dynamics
The online household furniture market in the US is driven by demand for ergonomic design, fabric durability, and cushion support to enhance user comfort. Frame strength, weight lightness, and eco-friendly materials ensure long-lasting and sustainable choices. Consumers prioritize delivery speed, assembly time, and packaging care for convenience. Space optimization, storage features, and design flexibility cater to modern living needs, while color retention, stain proofing, and surface protection improve longevity. With a focus on cost efficiency, comfort rating, maintenance ease, and noise reduction, the market continues to expand with versatile and high-quality offerings.
Firstly, the increasing preference for convenient online shopping experiences is driving sales in this sector. Secondly, the trend towards innovative and customized furniture designs is gaining traction, with consumers seeking unique pieces to enhance their home interiors. Lastly, the diversified preferences of customers for various styles and types of household furniture are expanding the market's scope. These trends are expected to continue shaping the market in the coming years. Sleeping furniture, such as beds, mattresses, pillows, headboards, and bedding, are essential for creating a comfortable living space. Overall, the market's growth is underpinned by the shift towards digital shopping channels, the demand for personalized furniture solutions, and the evolving consumer preferences.
Our market researchers analyzed the data with 2024 as the base year, along with the key drivers, trends, and challenges. A holistic analysis of drivers will help companies refine their marketing strategies to gain a competitive advantage.
What are the key market drivers leading to the rise in adoption of US Online Household Furniture Market?
- Increasing online sales of household furniture is the key driver of the market.The market is experiencing significant growth due to the increasing number of consumers utilizing smartphones and laptops for furniture shopping. With over two billion active users, the US leads in smartphone adoption, making it an attractive market for furniture retailers. This digital shift in consumer behavior is driving sales in the online household furniture sector. Consumers can now access extensive furniture collections featuring modern designs and sustainable materials from the comfort of their homes. These collections cater to various personal tastes, including rustic pieces made of traditional woods, metals, composites, and glass. Customization options allow consumers to tailor furniture to their specific preferences.
- In addition, online shopping offers several advantages over traditional brick-and-mortar stores, such as time-saving convenience, comparison shopping, and discounts during sales. The online marketplace offers a wide range of seating furniture, including chairs, sofas, couches, ottomans, footstools, benches, and stools, as well as chaise lounges and rocking chairs. Home office furniture and outdoor seating options are also popular choices for online shoppers. Storage furniture, including cabinets and shelves, is another essential category that caters to the needs of consumers in the digital world. The market in the US continues to evolve, offering consumers a more convenient, personalized, and cost-effective shopping experience.
What are the market trends shaping the US Online Household Furniture Market?
- Growing importance of innovative and customized furniture is the upcoming trend in the market.In the digital world, online furniture shopping has emerged as a preferred choice for consumers in the US, offering extensive collections of modern designs and sustainable materials. With the convenience of smartphones and laptops, consumers can now purchase furniture from the comfort of their homes, eliminating the time-consuming excursions to brick-and-mortar stores. The market caters to diverse consumer preferences, providing customization options for furniture, allowing individuals to tailor pieces to their personal tastes. Furniture manufacturers are embracing technology, offering smart furniture that integrates gadgets such as laptops and peripherals. Beds are now equipped with pull-out shelves, USB ports, and outlets to charge devices.
- Furthermore, consumers are drawn to these features, enhancing their furniture's functionality and aesthetic appeal. Traditional woods, metals, composites, and glass are still popular choices, but the market offers a wide range of furniture made from sustainable materials. The furniture industry continues to evolve, providing consumers with a vast selection of seating furniture, including chairs, sofas, couches, ottomans, footstools, benches, and stools, as well as chaise lounges and rocking chairs. Home office furniture and outdoor seating are also popular categories, catering to the growing need for flexible workspaces and outdoor living spaces. Sleeping furniture, including beds, mattresses, pillows, headboards, and bedding, is another significant category, with a focus on comfort and durability.
What challenges doesUS Online Household Furniture Market face during the growth?
- Diversified customer preferences for household furniture is a key challenge affecting the market growth.The market is experiencing a significant transformation due to the evolving consumer behavior. With the widespread use of smartphones and laptops for online shopping, furniture purchasing has become more convenient than ever. Consumers now prefer the digital world over traditional brick-and-mortar stores for their extensive furniture collections, modern designs, and customization options. However, the increasing demand for personalized furniture tailored to individual tastes poses a challenge for manufacturers. Millennials, in particular, are driving this trend, prioritizing comfort and aesthetic appeal over traditional woods, metals, composites, and glass. They desire customizable pieces and are less concerned about the sustainability of materials.
-
In addition, this shift in consumer preferences necessitates manufacturers to innovate and offer a wide range of furniture types, including seating furniture, home office, outdoor seating, sleeping furniture, and storage furniture. Moreover, consumers are no longer willing to endure time-consuming excursions to physical stores for furniture shopping. Instead, they compare prices, discounts, and sales across various online platforms to make informed decisions. As a result, manufacturers must be prepared to offer competitive pricing and trending designs to cater to this market. In conclusion, the market is witnessing a paradigm shift, with consumers prioritizing convenience, personalization, and affordability. Manufacturers must adapt to these changing trends to remain competitive in this dynamic market.
Exclusive Customer Landscape
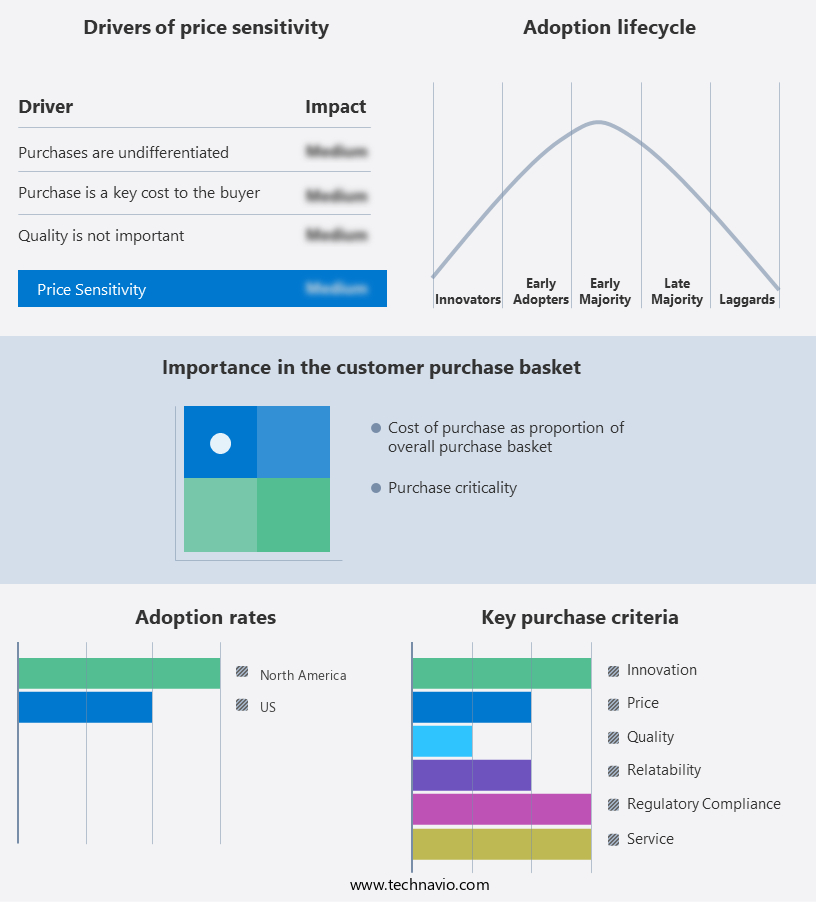
The market forecasting report includes the adoption lifecycle of the market, covering from the innovator's stage to the laggard's stage. It focuses on adoption rates in different regions based on penetration. Furthermore, the market report also includes key purchase criteria and drivers of price sensitivity to help companies evaluate and develop their market growth analysis strategies.
Customer Landscape
Key Companies & Market Insights
Companies are implementing various strategies, such as strategic alliances, market forecast , partnerships, mergers and acquisitions, geographical expansion, and product/service launches, to enhance their presence in the market.
Amazon.com Inc. - The company offers online household furniture such as Rivet Sheena Glam tufted velvet shell chair, Rivet revolve modern upholstered sofa with reversible sectional chaise, Rivet Revolve modern sofa couch, Stone and Beam Hillman mid century sofa couch with wood base and legs.
The market research and growth report includes detailed analyses of the competitive landscape of the market and information about key companies, including:
- Bed Bath and Beyond Inc.
- Costco Wholesale Corp.
- Etsy Inc.
- Floyd Inc.
- Home Depot Inc.
- Inter IKEA Holding BV
- Lulu and Georgia Inc.
- Macys Inc.
- Medley
- Serena and Lily Inc.
- Society Social Inc.
- Target Corp.
- The Roomplace
- Walmart Inc.
- Wayfair Inc.
- Williams Sonoma Inc.
- World Market
Qualitative and quantitative analysis of companies has been conducted to help clients understand the wider business environment as well as the strengths and weaknesses of key market players. Data is qualitatively analyzed to categorize companies as pure play, category-focused, industry-focused, and diversified; it is quantitatively analyzed to categorize companies as dominant, leading, strong, tentative, and weak.
Research Analyst Overview
In today's digital world, consumers have the power to shop for household furniture from the comfort of their own homes. This shift from traditional brick-and-mortar stores to online platforms offers numerous benefits, including convenience, extensive collections, and personalised options. The furniture market, once a time-consuming excursion, has transformed into an engaging and interactive experience. With the rise of smartphones and laptops, consumers can now browse modern designs and rustic pieces, made from various materials such as traditional woods, metals, composites, and glass. These digital platforms cater to a diverse range of personal tastes, allowing consumers to tailor their furniture selections to their unique preferences.
Furthermore, one significant advantage of online shopping is the ability to compare prices and features from multiple retailers at once. Consumers can easily switch between websites, assessing the offerings and taking advantage of discounts and sales. This level of comparison shopping is not possible in a traditional setting, making online furniture shopping a more efficient and cost-effective option. Moreover, the digital landscape offers a wealth of customisation options. Seating furniture, such as chairs, sofas, couches, ottomans, footstools, and benches, can be customised to fit specific spaces and personal styles. Consumers can choose from various colours, fabrics, and sizes, ensuring their furniture aligns with their aesthetic appeal and comfort requirements.
In addition, the home office sector is another area that has seen an increase in online sales. With the increasing trend of remote work, consumers are investing in ergonomic chairs, desks, and storage solutions. These products not only enhance productivity but also contribute to a more comfortable and personalised work environment. Outdoor seating and sleeping furniture are other popular categories in the online furniture market. Consumers can now purchase beds, mattresses, pillows, headboards, and bedding from the comfort of their homes, ensuring they make informed decisions based on their comfort preferences. Additionally, outdoor furniture, including chaise lounges, rocking chairs, and benches, can be purchased online, allowing consumers to create their dream outdoor living spaces.
|
Market Scope |
|
|
Report Coverage |
Details |
|
Page number |
174 |
|
Base year |
2024 |
|
Historic period |
2019-2023 |
|
Forecast period |
2025-2029 |
|
Growth momentum & CAGR |
Accelerate at a CAGR of 4.4% |
|
Market growth 2025-2029 |
USD 6.45 billion |
|
Market structure |
Fragmented |
|
YoY growth 2024-2025(%) |
3.0 |
|
Key countries |
US and North America |
|
Competitive landscape |
Leading Companies, Market Positioning of Companies, Competitive Strategies, and Industry Risks |
What are the Key Data Covered in this Market Research and Growth Report?
- CAGR of the market during the forecast period
- Detailed information on factors that will drive the market growth and forecasting between 2025 and 2029
- Precise estimation of the size of the market and its contribution of the market in focus to the parent market
- Accurate predictions about upcoming market growth and trends and changes in consumer behaviour
- Growth of the market across US
- Thorough analysis of the market's competitive landscape and detailed information about companies
- Comprehensive analysis of factors that will challenge the growth of market companies
We can help! Our analysts can customize this market research report to meet your requirements. Get in touch
 RIA -
RIA - 
