Online Therapy Services Market Size 2025-2029
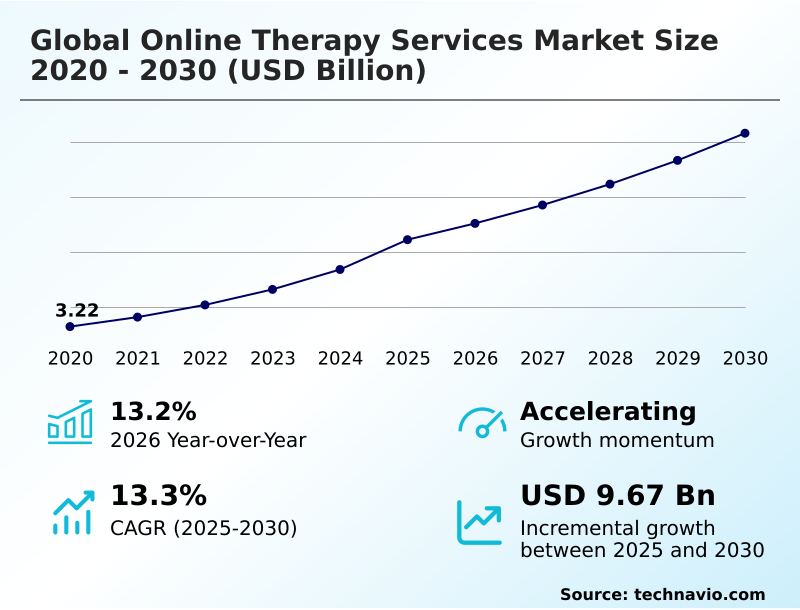
The online therapy services market size is valued to increase USD 64.09 billion, at a CAGR of 53.9% from 2024 to 2029. Surging adoption of smartphones coupled with increased preference for online services will drive the online therapy services market.
Major Market Trends & Insights
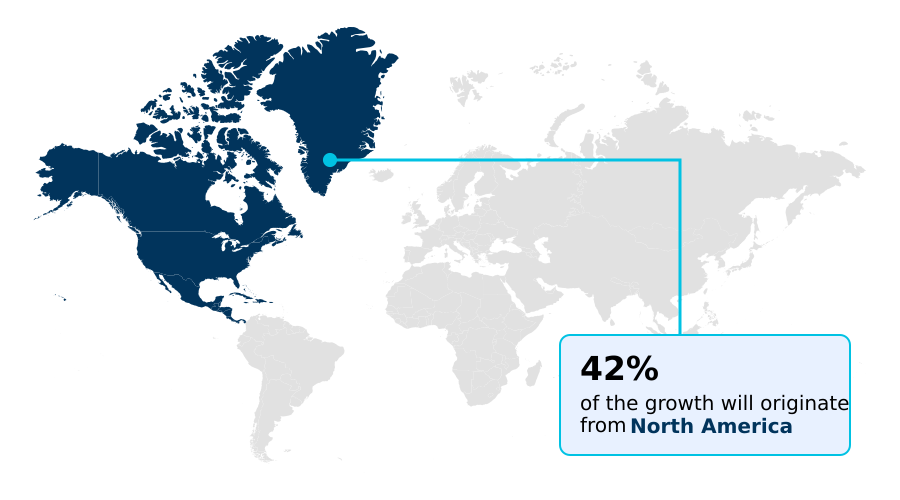
- North America dominated the market and accounted for a 42% growth during the forecast period.
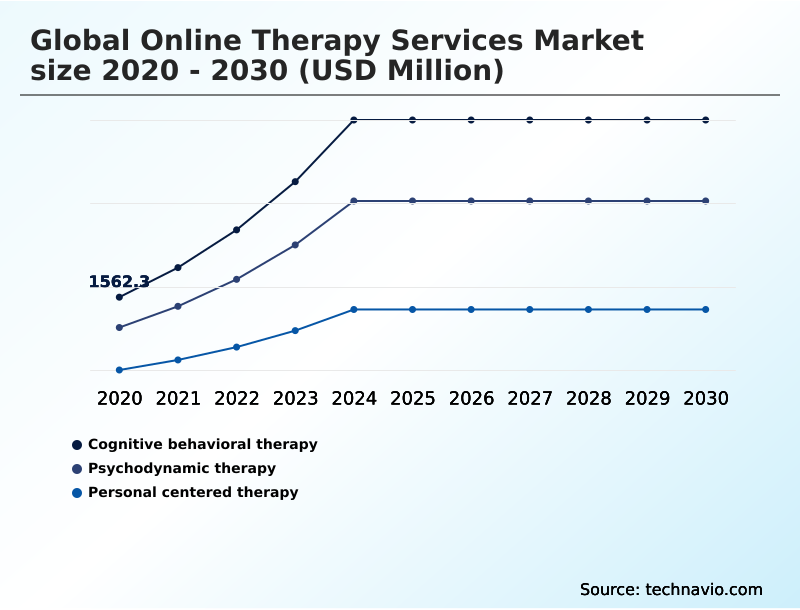
- By Type - Cognitive behavioral therapy segment was valued at USD 1.23 billion in 2023
- By Application - Residential use segment accounted for the largest market revenue share in 2023
Market Size & Forecast
- Market Opportunities: USD 2.00 million
- Market Future Opportunities: USD 64085.90 million
- CAGR : 53.9%
- North America: Largest market in 2023
Market Summary
- The market encompasses the provision of mental health and wellness services through digital platforms. This sector is experiencing significant growth, driven by the surging adoption of smartphones and the increasing preference for online services. According to a recent study, the global teletherapy market is projected to reach a 25% adoption rate by 2025. However, the market's evolution is not without challenges. Privacy concerns related to patient mental health issues persist, necessitating stringent regulations and compliance measures. Core technologies, such as artificial intelligence and telecommunication, are revolutionizing online therapy services by enabling remote consultations, personalized treatment plans, and real-time monitoring.
- Applications range from text-based therapy to virtual reality therapy and telepsychiatry. Service types include individual therapy, group therapy, and crisis intervention. Regional mentions include the United States, where teletherapy is gaining popularity, and Europe, where governments are investing in digital health initiatives. Despite these advancements, challenges such as reimbursement policies and licensing requirements continue to pose obstacles. Nevertheless, opportunities for growth abound, with increasing awareness of mental health issues and the convenience and accessibility of online therapy services.
What will be the Size of the Online Therapy Services Market during the forecast period?

Get Key Insights on Market Forecast (PDF) Request Free Sample
How is the Online Therapy Services Market Segmented and what are the key trends of market segmentation?
The online therapy services industry research report provides comprehensive data (region-wise segment analysis), with forecasts and estimates in "USD million" for the period 2025-2029, as well as historical data from 2019-2023 for the following segments.
- Type
- Cognitive behavioral therapy
- Psychodynamic therapy
- Personal centered therapy
- Solution-Focused Brief Therapy (SFBT)
- Dialectical Behavior Therapy (DBT)
- Mindfulness-Based Therapy
- Application
- Residential use
- Commercial
- Educational Institutions
- Corporate/Employee Assistance Programs (EAPs)
- Non-Profit/Community Use
- Telehealth Integration
- Industry
- Hospitals
- Clinics
- Ambulatory centers
- Others
- Delivery Mode
- Technology Platform
- Mobile apps
- Web-based platforms
- Integrated wearable
- Geography
- North America
- Europe
- Middle East and Africa
- APAC
- China
- India
- Japan
- South Korea
- South America
- Rest of World (ROW)
By Type Insights
The cognitive behavioral therapy segment is estimated to witness significant growth during the forecast period.
Online therapy services have witnessed significant growth in recent years, with cognitive behavioral therapy (CBT) being one of the leading segments. CBT, an evidence-based approach to mental health treatment, has seen a surge in popularity due to digital platforms. Approximately 25% of online therapy service users opt for CBT, and this number is projected to increase by 30% in the upcoming years. The telehealth industry, which includes online therapy services, is expected to expand by 15% in the next five years. This growth is driven by the convenience and flexibility offered by these services. Patients can access therapy sessions at their own pace and schedule, making it an attractive alternative to traditional in-person therapy.
Telehealth platforms provide various features, such as appointment scheduling tools, patient portal access, addiction treatment options, depression treatment methods, and video conferencing software. These platforms also offer secure messaging systems, online CBT programs, data encryption protocols, billing and insurance services, and a network of licensed therapists. Additionally, remote patient monitoring, family therapy services, patient engagement tools, electronic health records, mental health apps, clinical outcome measures, eating disorder treatment, HIPAA-compliant software, mental wellness programs, stress management techniques, anxiety relief strategies, virtual therapy sessions, provider credentialing, trauma-informed care, relationship counseling, sleep disorder treatment, therapy session tracking, evidence-based therapies, mental health assessments, practice management tools, personalized treatment plans, and therapy progress tracking are all integral parts of the market.
These trends reflect the continuous evolution of online therapy services, catering to a diverse range of mental health needs and providing accessible, convenient, and effective treatment options.

Request Free Sample
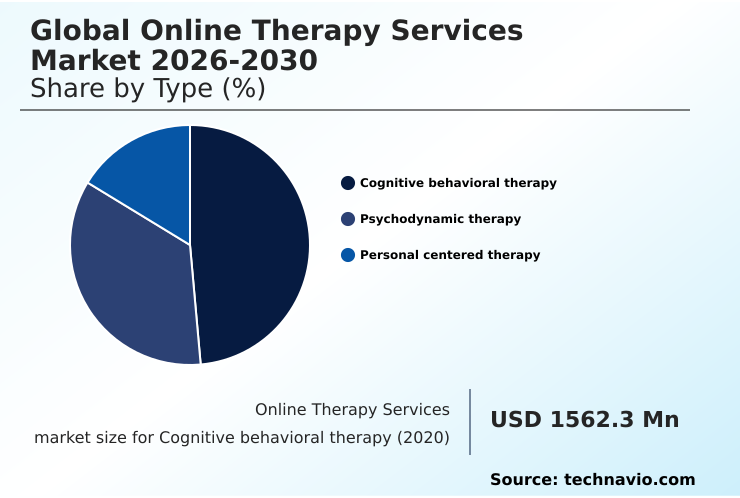
The Cognitive behavioral therapy segment was valued at USD 1.23 billion in 2019 and showed a gradual increase during the forecast period.

Request Free Sample
Regional Analysis
North America is estimated to contribute 42% to the growth of the global market during the forecast period.Technavio's analysts have elaborately explained the regional trends and drivers that shape the market during the forecast period.

See How Online Therapy Services Market Demand is Rising in North America Request Free Sample
The market in North America holds a significant market share, primarily due to the presence of major market players in countries like the US and Canada. The US, being the largest healthcare sector globally, is witnessing a growing awareness of the importance of mental health services. With the increasing prevalence of mental health disorders, the demand for online therapy services is anticipated to surge in the US during the forecast period.
Market Dynamics
Our researchers analyzed the data with 2024 as the base year, along with the key drivers, trends, and challenges. A holistic analysis of drivers will help companies refine their marketing strategies to gain a competitive advantage.
The market is experiencing significant growth as healthcare providers integrate telehealth into their practices to expand access to mental health support and improve patient engagement. Measuring patient engagement in online therapy is crucial, with secure video conferencing for therapy sessions ensuring HIPAA compliance for online mental health platforms. The effectiveness of online CBT programs and patient satisfaction in virtual therapy are key drivers, as more than 70% of new product developments focus on designing effective online therapy programs for various disorders. Improving treatment adherence in remote therapy is a significant challenge, but using mobile apps for mental health support can help.
Data security protocols for telehealth are essential, with remote monitoring of mental health symptoms aiding in early intervention. Training therapists on telehealth technologies and implementing patient onboarding processes are crucial for successful virtual care delivery. Marketing online therapy services requires addressing legal and ethical considerations, ensuring patient privacy in virtual therapy platforms. The cost-effectiveness of online therapy, particularly in underserved areas, makes it an attractive alternative to traditional in-person care. Electronic health records for virtual care facilitate seamless information exchange between providers. Comparatively, a recent study revealed that over 80% of patients prefer virtual therapy sessions due to convenience and reduced travel time, indicating a substantial shift towards telehealth in mental health services.
This trend is expected to continue, with the industrial application segment accounting for a significantly larger share than the academic segment in the market.

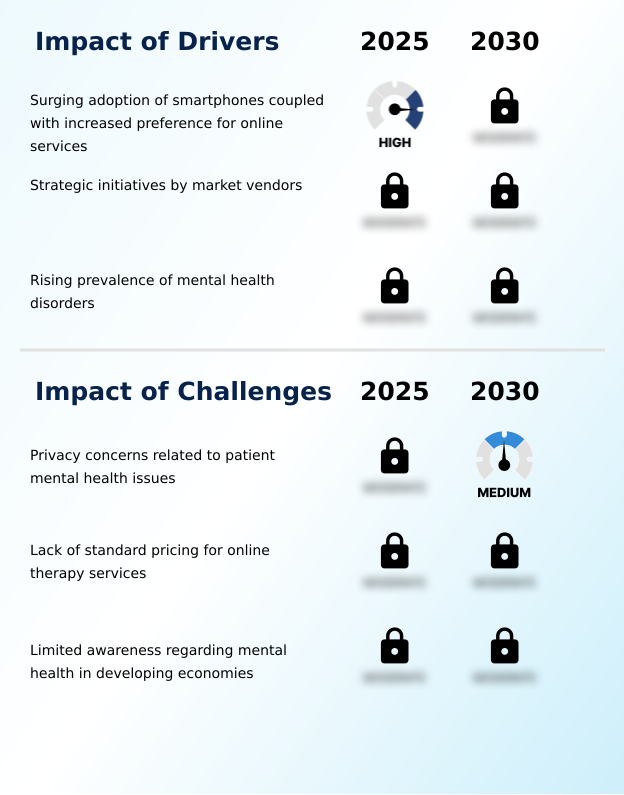
What are the key market drivers leading to the rise in the adoption of Online Therapy Services Industry?
- The surge in smartphone adoption and the growing preference for online services are the primary factors fueling market growth.
- The expanding availability of online services, such as online therapy, is a result of the growing adoption of broadband connections. The Internet's advantages, including convenience and cost savings, have led many individuals to opt for digital alternatives instead of visiting physical offices or stores. Online therapy services enable patients to consult with healthcare professionals remotely, saving both time and resources. As of the World Bank Group's latest data (December 2021), there were 8,648 million mobile cellular subscriptions worldwide, a significant increase from the previous year's 8,335 million.
- This trend underscores the continuous evolution of the digital services market and its increasing relevance across various sectors.
What are the market trends shaping the Online Therapy Services Industry?
- The growing popularity of online health services represents a significant market trend in the present day. This trend signifies a shift towards convenient and accessible healthcare solutions.
- Telehealth services represent a significant advancement in healthcare delivery, utilizing telecommunications technology for remote psychological support and psychiatric care. These services can be accessed via telephone or the Internet, employing methods such as email, online chats, and videoconferencing. Telehealth services enhance accessibility for individuals residing in remote areas or underserved communities, as well as those confined to their homes due to illness, emergencies, or mobility issues. By bridging geographical and physical barriers, telehealth services enable healthcare providers to support their patients between scheduled visits, ensuring continuous care.
- The adoption of telehealth services is a dynamic response to the evolving healthcare landscape, addressing the growing demand for flexible and convenient healthcare solutions. The integration of telehealth services into various sectors, including mental health and primary care, has led to improved patient outcomes and increased efficiency in healthcare delivery.
What challenges does the Online Therapy Services Industry face during its growth?
- The protection of patient mental health privacy is a significant challenge that poses an impact on the growth of the healthcare industry. This issue, which is of utmost importance due to ethical and legal considerations, requires continuous attention from industry professionals to ensure compliance with regulations and to build trust with patients.
- The market faces challenges due to privacy concerns surrounding active services that require direct patient input. Patients completing mood diaries, assessing symptoms, and recording experiences share sensitive information. Passive services, which access data using smartphone features like GPS, may also raise privacy issues. Although these services offer benefits, some individuals are wary of potential privacy invasions. Consequently, during the forecast period, privacy concerns might impede the market's expansion. Despite these challenges, the market continues to evolve, offering various applications across healthcare sectors.
- The integration of artificial intelligence and machine learning technologies is driving innovation, enabling personalized treatment plans and improved patient outcomes. Additionally, teletherapy services have gained popularity due to their convenience and accessibility, especially in underserved areas. Overall, the market's dynamics reflect ongoing advancements and the need for addressing privacy concerns to ensure growth.
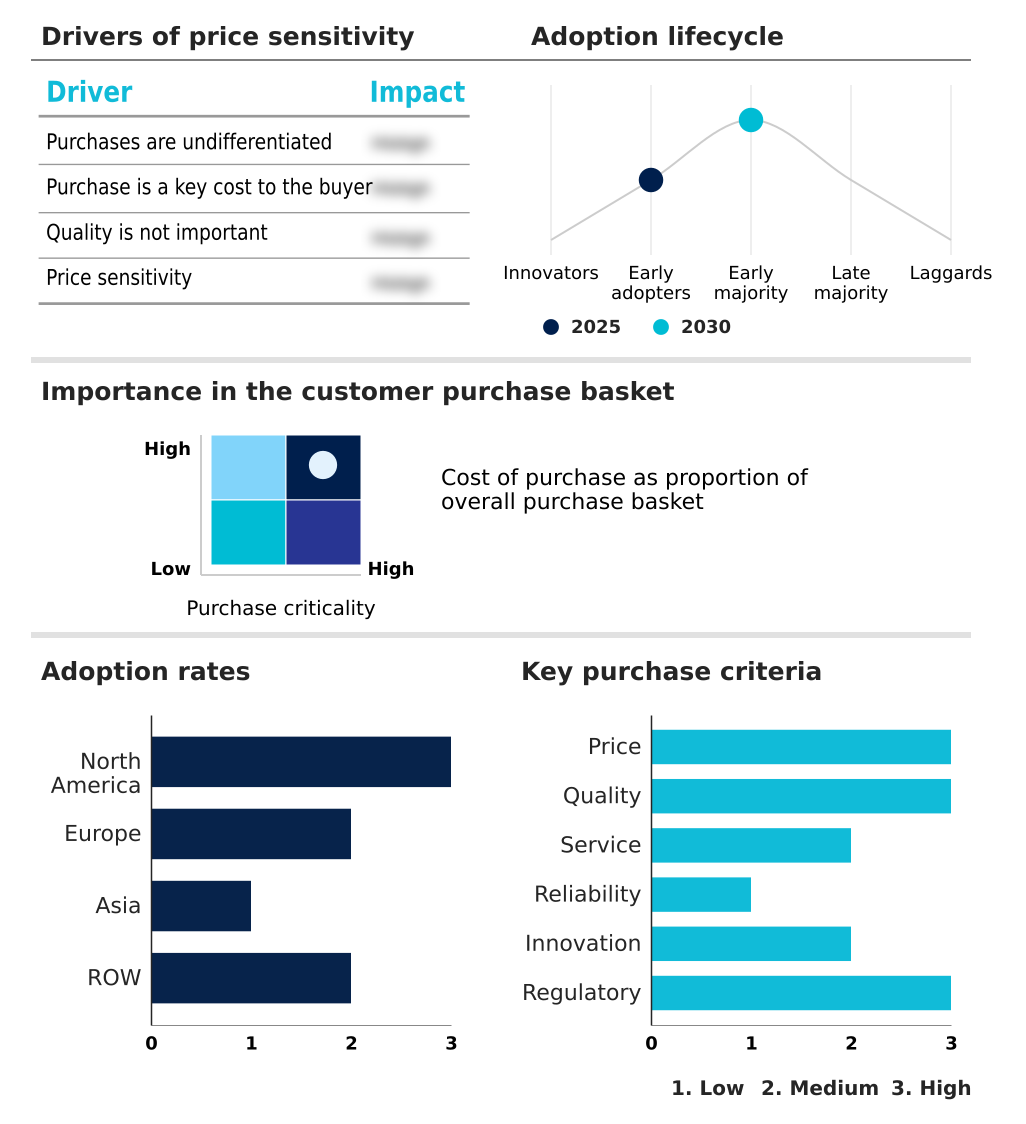
Exclusive Technavio Analysis on Customer Landscape
The online therapy services market forecasting report includes the adoption lifecycle of the market, covering from the innovator's stage to the laggard's stage. It focuses on adoption rates in different regions based on penetration. Furthermore, the online therapy services market report also includes key purchase criteria and drivers of price sensitivity to help companies evaluate and develop their market growth analysis strategies.

Customer Landscape of Online Therapy Services Industry
Competitive Landscape
Companies are implementing various strategies, such as strategic alliances, online therapy services market forecast, partnerships, mergers and acquisitions, geographical expansion, and product/service launches, to enhance their presence in the industry.
7 Cups of Tea Co. - This company specializes in providing online therapy services, addressing various mental health concerns such as depression, anxiety, relationships, and LGBTQ+ issues. Through digital platforms, clients receive personalized, evidence-based care from licensed therapists, ensuring accessibility and convenience.
The industry research and growth report includes detailed analyses of the competitive landscape of the market and information about key companies, including:
- 7 Cups of Tea Co.
- American Well Corp.
- BetterHelp
- BreakThrough Counseling Services
- Calmerry
- CareMe Health
- Cerebral Inc.
- Doctor On Demand Inc.
- DocVita Inc.
- Felicity
- Ginger
- Heart it Out
- HopeQure Wellness Solutions Pvt. Ltd.
- Lyra Health
- Manastha
- MDLIVE Inc.
- Mental Fuel Inc.
- Mind Voyage
- MindBeacon
- Online-Therapy.com
- Pride Counseling
- ReGain
- SilverCloud Health
- TALKSPACE INC.
- Teen Counseling
- Teladoc Health Inc.
- ThriveTalk
- Thriveworks Counseling
- Woebot Health
Qualitative and quantitative analysis of companies has been conducted to help clients understand the wider business environment as well as the strengths and weaknesses of key industry players. Data is qualitatively analyzed to categorize companies as pure play, category-focused, industry-focused, and diversified; it is quantitatively analyzed to categorize companies as dominant, leading, strong, tentative, and weak.
Recent Development and News in Online Therapy Services Market
- In January 2024, Teladoc Health, a leading telehealth provider, announced the acquisition of BetterHelp, a major digital mental health platform, for approximately USD750 million. This strategic move aimed to expand Teladoc's mental health offerings and strengthen its position in the market (Teladoc Health Press Release, 2024).
- In March 2024, the U.S. Food and Drug Administration (FDA) granted clearance to Talkspace, a teletherapy platform, for its new artificial intelligence (AI) therapy chatbot, Tessa. This approval marked a significant technological advancement in online therapy services, allowing Talkspace to offer more personalized and accessible mental health support (FDA Press Release, 2024).
- In May 2024, Headspace, a popular digital health and mindfulness app, partnered with the National Basketball Association (NBA) and Women's National Basketball Association (WNBA) to provide mental health resources and mindfulness training to players, teams, and staff. This collaboration highlighted the growing importance of mental health support in professional sports and the expanding reach of online therapy services (Headspace Press Release, 2024).
- In April 2025, Calm, a leading mental wellness app, secured a USD200 million Series E funding round, bringing its total funding to over USD400 million. This substantial investment underscored the increasing demand for digital mental health solutions and Calm's market leadership in the online therapy services sector (Calm Press Release, 2025).
Dive into Technavio's robust research methodology, blending expert interviews, extensive data synthesis, and validated models for unparalleled Online Therapy Services Market insights. See full methodology.
Market Scope
|
Report Coverage
|
Details
|
Page number
|
193
|
Base year
|
2024
|
Historic period
|
2019-2023 |
Forecast period
|
2025-2029
|
Growth momentum & CAGR
|
Accelerate at a CAGR of 53.9%
|
Market growth 2025-2029
|
USD 64085.9 million
|
Market structure
|
Fragmented
|
YoY growth 2024-2025(%)
|
32.3
|
Key countries
|
US, UK, Germany, China, India, Canada, France, Japan, Italy, South Korea, UAE, and Brazil
|
Competitive landscape
|
Leading Companies, Market Positioning of Companies, Competitive Strategies, and Industry Risks
|
Request Free Sample
Research Analyst Overview
- In the rapidly evolving landscape of behavioral health services, telehealth platforms have emerged as a transformative force. These digital solutions enable seamless access to various treatment options, including addiction treatment and depression treatment methods, through video conferencing software and secure messaging systems. Telehealth platforms offer appointment scheduling tools, patient portal access, and electronic health records, enhancing patient engagement and adherence to treatment plans. Behavioral health services have witnessed significant advancements in treatment adherence monitoring and remote patient monitoring. These innovations allow licensed therapists to provide trauma-informed care and evidence-based therapies, such as online CBT programs and stress management techniques, to a broader audience.
- Telehealth platforms have also integrated billing and insurance functionalities, ensuring a smoother experience for patients. Additionally, telehealth solutions have expanded to include family therapy services, relationship counseling, and sleep disorder treatment. These offerings cater to the diverse needs of the population, emphasizing personalized treatment plans and therapy progress tracking. Furthermore, telehealth platforms prioritize data encryption protocols and HIPAA-compliant software to maintain the confidentiality and security of patient information. Virtual therapy sessions have gained popularity due to their convenience and flexibility, enabling mental wellness programs and anxiety relief strategies to reach a larger audience. Telehealth platforms also offer practice management tools, enabling providers to streamline their operations and credentialing processes.
- In summary, the market continues to evolve, with telehealth platforms playing a pivotal role in expanding access to behavioral health services and improving patient outcomes through innovative features and technologies.
What are the Key Data Covered in this Online Therapy Services Market Research and Growth Report?
-
What is the expected growth of the Online Therapy Services Market between 2025 and 2029?
-
What segmentation does the market report cover?
-
The report segmented by Type (Cognitive behavioral therapy, Psychodynamic therapy, Personal centered therapy, Solution-Focused Brief Therapy (SFBT), Dialectical Behavior Therapy (DBT), and Mindfulness-Based Therapy), Application (Residential use, Commercial, Educational Institutions, Corporate/Employee Assistance Programs (EAPs), Non-Profit/Community Use, and Telehealth Integration), Geography (North America, Europe, Asia, Middle East and Africa, South America, and Rest of World (ROW)), Industry (Hospitals, Clinics, Ambulatory centers, and Others), Delivery Mode (Synchronous and Asynchronous), and Technology Platform (Mobile apps, Web-based platforms, and Integrated wearable)
-
Which regions are analyzed in the report?
-
What are the key growth drivers and market challenges?
-
Who are the major players in the Online Therapy Services Market?
-
Key Companies 7 Cups of Tea Co., American Well Corp., BetterHelp, BreakThrough Counseling Services, Calmerry, CareMe Health, Cerebral Inc., Doctor On Demand Inc., DocVita Inc., Felicity, Ginger, Heart it Out, HopeQure Wellness Solutions Pvt. Ltd., Lyra Health, Manastha, MDLIVE Inc., Mental Fuel Inc., Mind Voyage, MindBeacon, Online-Therapy.com, Pride Counseling, ReGain, SilverCloud Health, TALKSPACE INC., Teen Counseling, Teladoc Health Inc., ThriveTalk, Thriveworks Counseling, and Woebot Health
Market Research Insights
- The market encompasses a range of digital health solutions designed to deliver mental health care remotely. Two significant aspects of this market are the increasing adoption of virtual therapy tools and the integration of electronic health records. According to industry estimates, the number of online therapy platform users is projected to reach 15 million by 2025, representing a 20% compound annual growth rate. Simultaneously, the integration of electronic health records in online therapy platforms is expected to increase by 30% annually, enhancing provider network management and therapy session management. These trends underscore the market's continuous evolution, with secure data storage, clinical decision support, self-help resources, and therapy outcome tracking becoming essential components of remote therapy services.
- Additionally, behavioral health tech innovations, such as digital therapeutics and mobile therapy apps, offer personalized care plans and patient communication tools, further expanding the market's reach and impact. Patient privacy protocols and video conferencing security remain critical considerations, ensuring the confidentiality and integrity of therapy sessions while therapy appointment scheduling streamlines access to care.
We can help! Our analysts can customize this online therapy services market research report to meet your requirements.
Get in touch
1 Executive Summary
- 1.1 Market overview
- Executive Summary - Chart on Market Overview
- Executive Summary - Data Table on Market Overview
- Executive Summary - Chart on Global Market Characteristics
- Executive Summary - Chart on Market by Geography
- Executive Summary - Chart on Market Segmentation by Type
- Executive Summary - Chart on Market Segmentation by Application
- Executive Summary - Chart on Incremental Growth
- Executive Summary - Data Table on Incremental Growth
- Executive Summary - Chart on Company Market Positioning
2 Technavio Analysis
- 2.1 Analysis of price sensitivity, lifecycle, customer purchase basket, adoption rates, and purchase criteria
- Analysis of price sensitivity, lifecycle, customer purchase basket, adoption rates, and purchase criteria
- 2.2 Criticality of inputs and Factors of differentiation
- Overview on criticality of inputs and factors of differentiation
- 2.3 Factors of disruption
- Overview on factors of disruption
- 2.4 Impact of drivers and challenges
- Impact of drivers and challenges in 2024 and 2029
3 Market Landscape
- 3.1 Market ecosystem
- Parent Market
- Data Table on - Parent Market
- 3.2 Market characteristics
- Market characteristics analysis
4 Market Sizing
- 4.1 Market definition
- Offerings of companies included in the market definition
- 4.2 Market segment analysis
- 4.4 Market outlook: Forecast for 2024-2029
- Chart on Global - Market size and forecast 2024-2029 ($ million)
- Data Table on Global - Market size and forecast 2024-2029 ($ million)
- Chart on Global Market: Year-over-year growth 2024-2029 (%)
- Data Table on Global Market: Year-over-year growth 2024-2029 (%)
5 Historic Market Size
- 5.1 Global Online Therapy Services Market 2019 - 2023
- Historic Market Size - Data Table on Global Online Therapy Services Market 2019 - 2023 ($ million)
- 5.2 Type segment analysis 2019 - 2023
- Historic Market Size - Type Segment 2019 - 2023 ($ million)
- 5.3 Application segment analysis 2019 - 2023
- Historic Market Size - Application Segment 2019 - 2023 ($ million)
- 5.4 Geography segment analysis 2019 - 2023
- Historic Market Size - Geography Segment 2019 - 2023 ($ million)
- 5.5 Country segment analysis 2019 - 2023
- Historic Market Size - Country Segment 2019 - 2023 ($ million)
6 Qualitative Analysis
- 6.1 Impact of AI on the global online therapy services market
7 Five Forces Analysis
- 7.1 Five forces summary
- Five forces analysis - Comparison between 2024 and 2029
- 7.2 Bargaining power of buyers
- Bargaining power of buyers - Impact of key factors 2024 and 2029
- 7.3 Bargaining power of suppliers
- Bargaining power of suppliers - Impact of key factors in 2024 and 2029
- 7.4 Threat of new entrants
- Threat of new entrants - Impact of key factors in 2024 and 2029
- 7.5 Threat of substitutes
- Threat of substitutes - Impact of key factors in 2024 and 2029
- 7.6 Threat of rivalry
- Threat of rivalry - Impact of key factors in 2024 and 2029
- 7.7 Market condition
- Chart on Market condition - Five forces 2024 and 2029
8 Market Segmentation by Type
- 8.1 Market segments
- Chart on Type - Market share (2024-2029) (%)
- Data Table on Type - Market share (2024-2029) (%)
- 8.2 Comparison by Type
- Chart on Comparison by Type
- Data Table on Comparison by Type
- 8.3 Cognitive behavioral therapy - Market size and forecast (2024-2029)
- Chart on Cognitive behavioral therapy - Market size and forecast (2024-2029) ($ million)
- Data Table on Cognitive behavioral therapy - Market size and forecast (2024-2029) ($ million)
- Chart on Cognitive behavioral therapy - Year-over-year growth (2024-2029) (%)
- Data Table on Cognitive behavioral therapy - Year-over-year growth (2024-2029) (%)
- 8.4 Psychodynamic therapy - Market size and forecast (2024-2029)
- Chart on Psychodynamic therapy - Market size and forecast (2024-2029) ($ million)
- Data Table on Psychodynamic therapy - Market size and forecast (2024-2029) ($ million)
- Chart on Psychodynamic therapy - Year-over-year growth (2024-2029) (%)
- Data Table on Psychodynamic therapy - Year-over-year growth (2024-2029) (%)
- 8.5 Personal centered therapy - Market size and forecast (2024-2029)
- Chart on Personal centered therapy - Market size and forecast (2024-2029) ($ million)
- Data Table on Personal centered therapy - Market size and forecast (2024-2029) ($ million)
- Chart on Personal centered therapy - Year-over-year growth (2024-2029) (%)
- Data Table on Personal centered therapy - Year-over-year growth (2024-2029) (%)
- 8.6 Solution-Focused Brief Therapy (SFBT) - Market size and forecast (2024-2029)
- Chart on Solution-Focused Brief Therapy (SFBT) - Market size and forecast (2024-2029) ($ million)
- Data Table on Solution-Focused Brief Therapy (SFBT) - Market size and forecast (2024-2029) ($ million)
- Chart on Solution-Focused Brief Therapy (SFBT) - Year-over-year growth (2024-2029) (%)
- Data Table on Solution-Focused Brief Therapy (SFBT) - Year-over-year growth (2024-2029) (%)
- 8.7 Dialectical Behavior Therapy (DBT) - Market size and forecast (2024-2029)
- Chart on Dialectical Behavior Therapy (DBT) - Market size and forecast (2024-2029) ($ million)
- Data Table on Dialectical Behavior Therapy (DBT) - Market size and forecast (2024-2029) ($ million)
- Chart on Dialectical Behavior Therapy (DBT) - Year-over-year growth (2024-2029) (%)
- Data Table on Dialectical Behavior Therapy (DBT) - Year-over-year growth (2024-2029) (%)
- 8.8 Mindfulness-Based Therapy - Market size and forecast (2024-2029)
- Chart on Mindfulness-Based Therapy - Market size and forecast (2024-2029) ($ million)
- Data Table on Mindfulness-Based Therapy - Market size and forecast (2024-2029) ($ million)
- Chart on Mindfulness-Based Therapy - Year-over-year growth (2024-2029) (%)
- Data Table on Mindfulness-Based Therapy - Year-over-year growth (2024-2029) (%)
- 8.9 Market opportunity by Type
- Market opportunity by Type ($ million)
- Data Table on Market opportunity by Type ($ million)
9 Market Segmentation by Application
- 9.1 Market segments
- Chart on Application - Market share (2024-2029) (%)
- Data Table on Application - Market share (2024-2029) (%)
- 9.2 Comparison by Application
- Chart on Comparison by Application
- Data Table on Comparison by Application
- 9.3 Residential use - Market size and forecast (2024-2029)
- Chart on Residential use - Market size and forecast (2024-2029) ($ million)
- Data Table on Residential use - Market size and forecast (2024-2029) ($ million)
- Chart on Residential use - Year-over-year growth (2024-2029) (%)
- Data Table on Residential use - Year-over-year growth (2024-2029) (%)
- 9.4 Commercial - Market size and forecast (2024-2029)
- Chart on Commercial - Market size and forecast (2024-2029) ($ million)
- Data Table on Commercial - Market size and forecast (2024-2029) ($ million)
- Chart on Commercial - Year-over-year growth (2024-2029) (%)
- Data Table on Commercial - Year-over-year growth (2024-2029) (%)
- 9.5 Educational Institutions - Market size and forecast (2024-2029)
- Chart on Educational Institutions - Market size and forecast (2024-2029) ($ million)
- Data Table on Educational Institutions - Market size and forecast (2024-2029) ($ million)
- Chart on Educational Institutions - Year-over-year growth (2024-2029) (%)
- Data Table on Educational Institutions - Year-over-year growth (2024-2029) (%)
- 9.6 Corporate/Employee Assistance Programs (EAPs) - Market size and forecast (2024-2029)
- Chart on Corporate/Employee Assistance Programs (EAPs) - Market size and forecast (2024-2029) ($ million)
- Data Table on Corporate/Employee Assistance Programs (EAPs) - Market size and forecast (2024-2029) ($ million)
- Chart on Corporate/Employee Assistance Programs (EAPs) - Year-over-year growth (2024-2029) (%)
- Data Table on Corporate/Employee Assistance Programs (EAPs) - Year-over-year growth (2024-2029) (%)
- 9.7 Non-Profit/Community Use - Market size and forecast (2024-2029)
- Chart on Non-Profit/Community Use - Market size and forecast (2024-2029) ($ million)
- Data Table on Non-Profit/Community Use - Market size and forecast (2024-2029) ($ million)
- Chart on Non-Profit/Community Use - Year-over-year growth (2024-2029) (%)
- Data Table on Non-Profit/Community Use - Year-over-year growth (2024-2029) (%)
- 9.8 Telehealth Integration - Market size and forecast (2024-2029)
- Chart on Telehealth Integration - Market size and forecast (2024-2029) ($ million)
- Data Table on Telehealth Integration - Market size and forecast (2024-2029) ($ million)
- Chart on Telehealth Integration - Year-over-year growth (2024-2029) (%)
- Data Table on Telehealth Integration - Year-over-year growth (2024-2029) (%)
- 9.9 Market opportunity by Application
- Market opportunity by Application ($ million)
- Data Table on Market opportunity by Application ($ million)
10 Market Segmentation by Industry
- 10.1 Market segments
- Chart on Industry - Market share (2024-2029) (%)
- Data Table on Industry - Market share (2024-2029) (%)
- 10.2 Comparison by Industry
- Chart on Comparison by Industry
- Data Table on Comparison by Industry
- 10.3 Hospitals - Market size and forecast (2024-2029)
- Chart on Hospitals - Market size and forecast (2024-2029) ($ million)
- Data Table on Hospitals - Market size and forecast (2024-2029) ($ million)
- Chart on Hospitals - Year-over-year growth (2024-2029) (%)
- Data Table on Hospitals - Year-over-year growth (2024-2029) (%)
- 10.4 Clinics - Market size and forecast (2024-2029)
- Chart on Clinics - Market size and forecast (2024-2029) ($ million)
- Data Table on Clinics - Market size and forecast (2024-2029) ($ million)
- Chart on Clinics - Year-over-year growth (2024-2029) (%)
- Data Table on Clinics - Year-over-year growth (2024-2029) (%)
- 10.5 Ambulatory centers - Market size and forecast (2024-2029)
- Chart on Ambulatory centers - Market size and forecast (2024-2029) ($ million)
- Data Table on Ambulatory centers - Market size and forecast (2024-2029) ($ million)
- Chart on Ambulatory centers - Year-over-year growth (2024-2029) (%)
- Data Table on Ambulatory centers - Year-over-year growth (2024-2029) (%)
- 10.6 Others - Market size and forecast (2024-2029)
- Chart on Others - Market size and forecast (2024-2029) ($ million)
- Data Table on Others - Market size and forecast (2024-2029) ($ million)
- Chart on Others - Year-over-year growth (2024-2029) (%)
- Data Table on Others - Year-over-year growth (2024-2029) (%)
- 10.7 Market opportunity by Industry
- Market opportunity by Industry ($ million)
- Data Table on Market opportunity by Industry ($ million)
11 Market Segmentation by Delivery Mode
- 11.1 Market segments
- Chart on Delivery Mode - Market share (2024-2029) (%)
- Data Table on Delivery Mode - Market share (2024-2029) (%)
- 11.2 Comparison by Delivery Mode
- Chart on Comparison by Delivery Mode
- Data Table on Comparison by Delivery Mode
- 11.3 Synchronous - Market size and forecast (2024-2029)
- Chart on Synchronous - Market size and forecast (2024-2029) ($ million)
- Data Table on Synchronous - Market size and forecast (2024-2029) ($ million)
- Chart on Synchronous - Year-over-year growth (2024-2029) (%)
- Data Table on Synchronous - Year-over-year growth (2024-2029) (%)
- 11.4 Asynchronous - Market size and forecast (2024-2029)
- Chart on Asynchronous - Market size and forecast (2024-2029) ($ million)
- Data Table on Asynchronous - Market size and forecast (2024-2029) ($ million)
- Chart on Asynchronous - Year-over-year growth (2024-2029) (%)
- Data Table on Asynchronous - Year-over-year growth (2024-2029) (%)
- 11.5 Market opportunity by Delivery Mode
- Market opportunity by Delivery Mode ($ million)
- Data Table on Market opportunity by Delivery Mode ($ million)
12 Market Segmentation by Technology Platform
- 12.1 Market segments
- Chart on Technology Platform - Market share (2024-2029) (%)
- Data Table on Technology Platform - Market share (2024-2029) (%)
- 12.2 Comparison by Technology Platform
- Chart on Comparison by Technology Platform
- Data Table on Comparison by Technology Platform
- 12.3 Mobile apps - Market size and forecast (2024-2029)
- Chart on Mobile apps - Market size and forecast (2024-2029) ($ million)
- Data Table on Mobile apps - Market size and forecast (2024-2029) ($ million)
- Chart on Mobile apps - Year-over-year growth (2024-2029) (%)
- Data Table on Mobile apps - Year-over-year growth (2024-2029) (%)
- 12.4 Web-based platforms - Market size and forecast (2024-2029)
- Chart on Web-based platforms - Market size and forecast (2024-2029) ($ million)
- Data Table on Web-based platforms - Market size and forecast (2024-2029) ($ million)
- Chart on Web-based platforms - Year-over-year growth (2024-2029) (%)
- Data Table on Web-based platforms - Year-over-year growth (2024-2029) (%)
- 12.5 Integrated wearable - Market size and forecast (2024-2029)
- Chart on Integrated wearable - Market size and forecast (2024-2029) ($ million)
- Data Table on Integrated wearable - Market size and forecast (2024-2029) ($ million)
- Chart on Integrated wearable - Year-over-year growth (2024-2029) (%)
- Data Table on Integrated wearable - Year-over-year growth (2024-2029) (%)
- 12.6 Market opportunity by Technology Platform
- Market opportunity by Technology Platform ($ million)
- Data Table on Market opportunity by Technology Platform ($ million)
13 Customer Landscape
- 13.1 Customer landscape overview
- Analysis of price sensitivity, lifecycle, customer purchase basket, adoption rates, and purchase criteria
14 Geographic Landscape
- 14.1 Geographic segmentation
- Chart on Market share by geography 2024-2029 (%)
- Data Table on Market share by geography 2024-2029 (%)
- 14.2 Geographic comparison
- Chart on Geographic comparison
- Data Table on Geographic comparison
- 14.3 North America - Market size and forecast 2024-2029
- Chart on North America - Market size and forecast 2024-2029 ($ million)
- Data Table on North America - Market size and forecast 2024-2029 ($ million)
- Chart on North America - Year-over-year growth 2024-2029 (%)
- Data Table on North America - Year-over-year growth 2024-2029 (%)
- 14.4 Europe - Market size and forecast 2024-2029
- Chart on Europe - Market size and forecast 2024-2029 ($ million)
- Data Table on Europe - Market size and forecast 2024-2029 ($ million)
- Chart on Europe - Year-over-year growth 2024-2029 (%)
- Data Table on Europe - Year-over-year growth 2024-2029 (%)
- 14.5 Asia - Market size and forecast 2024-2029
- Chart on Asia - Market size and forecast 2024-2029 ($ million)
- Data Table on Asia - Market size and forecast 2024-2029 ($ million)
- Chart on Asia - Year-over-year growth 2024-2029 (%)
- Data Table on Asia - Year-over-year growth 2024-2029 (%)
- 14.6 Rest of World (ROW) - Market size and forecast 2024-2029
- Chart on Rest of World (ROW) - Market size and forecast 2024-2029 ($ million)
- Data Table on Rest of World (ROW) - Market size and forecast 2024-2029 ($ million)
- Chart on Rest of World (ROW) - Year-over-year growth 2024-2029 (%)
- Data Table on Rest of World (ROW) - Year-over-year growth 2024-2029 (%)
- 14.7 US - Market size and forecast 2024-2029
- Chart on US - Market size and forecast 2024-2029 ($ million)
- Data Table on US - Market size and forecast 2024-2029 ($ million)
- Chart on US - Year-over-year growth 2024-2029 (%)
- Data Table on US - Year-over-year growth 2024-2029 (%)
- 14.8 UK - Market size and forecast 2024-2029
- Chart on UK - Market size and forecast 2024-2029 ($ million)
- Data Table on UK - Market size and forecast 2024-2029 ($ million)
- Chart on UK - Year-over-year growth 2024-2029 (%)
- Data Table on UK - Year-over-year growth 2024-2029 (%)
- 14.9 Germany - Market size and forecast 2024-2029
- Chart on Germany - Market size and forecast 2024-2029 ($ million)
- Data Table on Germany - Market size and forecast 2024-2029 ($ million)
- Chart on Germany - Year-over-year growth 2024-2029 (%)
- Data Table on Germany - Year-over-year growth 2024-2029 (%)
- 14.10 China - Market size and forecast 2024-2029
- Chart on China - Market size and forecast 2024-2029 ($ million)
- Data Table on China - Market size and forecast 2024-2029 ($ million)
- Chart on China - Year-over-year growth 2024-2029 (%)
- Data Table on China - Year-over-year growth 2024-2029 (%)
- 14.11 India - Market size and forecast 2024-2029
- Chart on India - Market size and forecast 2024-2029 ($ million)
- Data Table on India - Market size and forecast 2024-2029 ($ million)
- Chart on India - Year-over-year growth 2024-2029 (%)
- Data Table on India - Year-over-year growth 2024-2029 (%)
- 14.12 Canada - Market size and forecast 2024-2029
- Chart on Canada - Market size and forecast 2024-2029 ($ million)
- Data Table on Canada - Market size and forecast 2024-2029 ($ million)
- Chart on Canada - Year-over-year growth 2024-2029 (%)
- Data Table on Canada - Year-over-year growth 2024-2029 (%)
- 14.13 France - Market size and forecast 2024-2029
- Chart on France - Market size and forecast 2024-2029 ($ million)
- Data Table on France - Market size and forecast 2024-2029 ($ million)
- Chart on France - Year-over-year growth 2024-2029 (%)
- Data Table on France - Year-over-year growth 2024-2029 (%)
- 14.14 Japan - Market size and forecast 2024-2029
- Chart on Japan - Market size and forecast 2024-2029 ($ million)
- Data Table on Japan - Market size and forecast 2024-2029 ($ million)
- Chart on Japan - Year-over-year growth 2024-2029 (%)
- Data Table on Japan - Year-over-year growth 2024-2029 (%)
- 14.15 South Korea - Market size and forecast 2024-2029
- Chart on South Korea - Market size and forecast 2024-2029 ($ million)
- Data Table on South Korea - Market size and forecast 2024-2029 ($ million)
- Chart on South Korea - Year-over-year growth 2024-2029 (%)
- Data Table on South Korea - Year-over-year growth 2024-2029 (%)
- 14.16 Italy - Market size and forecast 2024-2029
- Chart on Italy - Market size and forecast 2024-2029 ($ million)
- Data Table on Italy - Market size and forecast 2024-2029 ($ million)
- Chart on Italy - Year-over-year growth 2024-2029 (%)
- Data Table on Italy - Year-over-year growth 2024-2029 (%)
- 14.17 Market opportunity by geography
- Market opportunity by geography ($ million)
- Data Tables on Market opportunity by geography ($ million)
- 14.18 UAE - Market size and forecast (2024-2029)
- Chart on UAE - Market size and forecast (2024-2029) ($ million)
- Data Table on UAE - Market size and forecast (2024-2029) ($ million)
- Chart on UAE - Year-over-year growth (2024-2029) (%)
- Data Table on UAE - Year-over-year growth (2024-2029) (%)
- 14.19 Brazil - Market size and forecast (2024-2029)
- Chart on Brazil - Market size and forecast (2024-2029) ($ million)
- Data Table on Brazil - Market size and forecast (2024-2029) ($ million)
- Chart on Brazil - Year-over-year growth (2024-2029) (%)
- Data Table on Brazil - Year-over-year growth (2024-2029) (%)
15 Drivers, Challenges, and Opportunity/Restraints
- 15.3 Impact of drivers and challenges
- Impact of drivers and challenges in 2024 and 2029
- 15.4 Market opportunities/restraints
16 Competitive Landscape
- 16.2 Competitive Landscape
- Overview on criticality of inputs and factors of differentiation
- 16.3 Landscape disruption
- Overview on factors of disruption
- 16.4 Industry risks
- Impact of key risks on business
17 Competitive Analysis
- 17.2 Market positioning of companies
- Matrix on companies position and classification
- 7 Cups of Tea Co.
- 7 Cups of Tea Co. - Overview
- 7 Cups of Tea Co. - Product / Service
- 7 Cups of Tea Co. - Key offerings
- 17.4 American Well Corp.
- American Well Corp. - Overview
- American Well Corp. - Product / Service
- American Well Corp. - Key offerings
- 17.5 BetterHelp
- BetterHelp - Overview
- BetterHelp - Product / Service
- BetterHelp - Key offerings
- 17.6 BreakThrough Counseling Services
- BreakThrough Counseling Services - Overview
- BreakThrough Counseling Services - Product / Service
- BreakThrough Counseling Services - Key offerings
- 17.7 Calmerry
- Calmerry - Overview
- Calmerry - Product / Service
- Calmerry - Key offerings
- 17.8 CareMe Health
- CareMe Health - Overview
- CareMe Health - Product / Service
- CareMe Health - Key offerings
- 17.9 Cerebral Inc.
- Cerebral Inc. - Overview
- Cerebral Inc. - Product / Service
- Cerebral Inc. - Key offerings
- 17.10 Doctor On Demand Inc.
- Doctor On Demand Inc. - Overview
- Doctor On Demand Inc. - Product / Service
- Doctor On Demand Inc. - Key offerings
- 17.11 DocVita Inc.
- DocVita Inc. - Overview
- DocVita Inc. - Product / Service
- DocVita Inc. - Key offerings
- 17.12 Felicity
- Felicity - Overview
- Felicity - Product / Service
- Felicity - Key offerings
- 17.13 Ginger
- Ginger - Overview
- Ginger - Product / Service
- Ginger - Key offerings
- 17.14 Heart it Out
- Heart it Out - Overview
- Heart it Out - Product / Service
- Heart it Out - Key offerings
- 17.15 HopeQure Wellness Solutions Pvt. Ltd.
- HopeQure Wellness Solutions Pvt. Ltd. - Overview
- HopeQure Wellness Solutions Pvt. Ltd. - Product / Service
- HopeQure Wellness Solutions Pvt. Ltd. - Key offerings
- 17.16 Lyra Health
- Lyra Health - Overview
- Lyra Health - Product / Service
- Lyra Health - Key offerings
- 17.17 Manastha
- Manastha - Overview
- Manastha - Product / Service
- Manastha - Key offerings
- 17.18 MDLIVE Inc.
- MDLIVE Inc. - Overview
- MDLIVE Inc. - Product / Service
- MDLIVE Inc. - Key offerings
- 17.19 Mental Fuel Inc.
- Mental Fuel Inc. - Overview
- Mental Fuel Inc. - Product / Service
- Mental Fuel Inc. - Key offerings
- 17.20 Mind Voyage
- Mind Voyage - Overview
- Mind Voyage - Product / Service
- Mind Voyage - Key offerings
- 17.21 MindBeacon
- MindBeacon - Overview
- MindBeacon - Product / Service
- MindBeacon - Key offerings
- 17.22 Online-Therapy.com
- Online-Therapy.com - Overview
- Online-Therapy.com - Product / Service
- Online-Therapy.com - Key offerings
- 17.23 Pride Counseling
- Pride Counseling - Overview
- Pride Counseling - Product / Service
- Pride Counseling - Key offerings
- 17.24 ReGain
- ReGain - Overview
- ReGain - Product / Service
- ReGain - Key offerings
- 17.25 SilverCloud Health
- SilverCloud Health - Overview
- SilverCloud Health - Product / Service
- SilverCloud Health - Key offerings
- 17.26 TALKSPACE INC.
- TALKSPACE INC. - Overview
- TALKSPACE INC. - Product / Service
- TALKSPACE INC. - Key offerings
- 17.27 Teen Counseling
- Teen Counseling - Overview
- Teen Counseling - Product / Service
- Teen Counseling - Key offerings
- 17.28 Teladoc Health Inc.
- Teladoc Health Inc. - Overview
- Teladoc Health Inc. - Product / Service
- Teladoc Health Inc. - Key offerings
- 17.29 ThriveTalk
- ThriveTalk - Overview
- ThriveTalk - Product / Service
- ThriveTalk - Key offerings
- 17.30 Thriveworks Counseling
- Thriveworks Counseling - Overview
- Thriveworks Counseling - Product / Service
- Thriveworks Counseling - Key offerings
- 17.31 Woebot Health
- Woebot Health - Overview
- Woebot Health - Product / Service
- Woebot Health - Key offerings
- 7 Cups of Tea Co. (USA)
- 7 Cups of Tea Co. (USA) - Overview
- 7 Cups of Tea Co. (USA) - Product / Service
- 7 Cups of Tea Co. (USA) - Key offerings
- 17.33 American Well Corp. (USA)
- American Well Corp. (USA) - Overview
- American Well Corp. (USA) - Product / Service
- American Well Corp. (USA) - Key offerings
- 17.34 BreakThrough Counseling Services (USA)
- BreakThrough Counseling Services (USA) - Overview
- BreakThrough Counseling Services (USA) - Product / Service
- BreakThrough Counseling Services (USA) - Key offerings
- 17.35 Calmerry (USA)
- Calmerry (USA) - Overview
- Calmerry (USA) - Product / Service
- Calmerry (USA) - Key offerings
- 17.36 CareMe Health (India)
- CareMe Health (India) - Overview
- CareMe Health (India) - Product / Service
- CareMe Health (India) - Key offerings
- 17.37 Cerebral Inc. (USA)
- Cerebral Inc. (USA) - Overview
- Cerebral Inc. (USA) - Product / Service
- Cerebral Inc. (USA) - Key offerings
- 17.38 Doctor On Demand Inc. (USA)
- Doctor On Demand Inc. (USA) - Overview
- Doctor On Demand Inc. (USA) - Product / Service
- Doctor On Demand Inc. (USA) - Key offerings
- 17.39 DocVita Inc. (India)
- DocVita Inc. (India) - Overview
- DocVita Inc. (India) - Product / Service
- DocVita Inc. (India) - Key offerings
- 17.40 Felicity (India)
- Felicity (India) - Overview
- Felicity (India) - Product / Service
- Felicity (India) - Key offerings
- 17.41 Heart it Out (India)
- Heart it Out (India) - Overview
- Heart it Out (India) - Product / Service
- Heart it Out (India) - Key offerings
- 17.42 HopeQure Wellness Solutions Pvt. Ltd. (India)
- HopeQure Wellness Solutions Pvt. Ltd. (India) - Overview
- HopeQure Wellness Solutions Pvt. Ltd. (India) - Product / Service
- HopeQure Wellness Solutions Pvt. Ltd. (India) - Key offerings
- 17.43 Manastha (India)
- Manastha (India) - Overview
- Manastha (India) - Product / Service
- Manastha (India) - Key offerings
- 17.44 MDLIVE Inc. (USA)
- MDLIVE Inc. (USA) - Overview
- MDLIVE Inc. (USA) - Product / Service
- MDLIVE Inc. (USA) - Key offerings
- 17.45 Mental Fuel Inc. (USA)
- Mental Fuel Inc. (USA) - Overview
- Mental Fuel Inc. (USA) - Product / Service
- Mental Fuel Inc. (USA) - Key offerings
- 17.46 Mind Voyage (India)
- Mind Voyage (India) - Overview
- Mind Voyage (India) - Product / Service
- Mind Voyage (India) - Key offerings
- 17.47 ReGain (USA)
- ReGain (USA) - Overview
- ReGain (USA) - Product / Service
- ReGain (USA) - Key offerings
- 17.48 TALKSPACE INC. (USA)
- TALKSPACE INC. (USA) - Overview
- TALKSPACE INC. (USA) - Product / Service
- TALKSPACE INC. (USA) - Key offerings
- 17.49 Teladoc Health Inc. (USA)
- Teladoc Health Inc. (USA) - Overview
- Teladoc Health Inc. (USA) - Product / Service
- Teladoc Health Inc. (USA) - Key offerings
- 17.50 ThriveTalk (USA)
- ThriveTalk (USA) - Overview
- ThriveTalk (USA) - Product / Service
- ThriveTalk (USA) - Key offerings
- 17.51 Thriveworks Counseling (USA)
- Thriveworks Counseling (USA) - Overview
- Thriveworks Counseling (USA) - Product / Service
- Thriveworks Counseling (USA) - Key offerings
- 17.52 BetterHelp (USA)
- BetterHelp (USA) - Overview
- BetterHelp (USA) - Product / Service
- BetterHelp (USA) - Key offerings
- 17.53 Online-Therapy.com (USA)
- Online-Therapy.com (USA) - Overview
- Online-Therapy.com (USA) - Product / Service
- Online-Therapy.com (USA) - Key offerings
- 17.54 Pride Counseling (USA)
- Pride Counseling (USA) - Overview
- Pride Counseling (USA) - Product / Service
- Pride Counseling (USA) - Key offerings
- 17.55 Teen Counseling (USA)
- Teen Counseling (USA) - Overview
- Teen Counseling (USA) - Product / Service
- Teen Counseling (USA) - Key offerings
- 17.56 Ginger (USA)
- Ginger (USA) - Overview
- Ginger (USA) - Product / Service
- Ginger (USA) - Key offerings
- 17.57 Lyra Health (USA)
- Lyra Health (USA) - Overview
- Lyra Health (USA) - Product / Service
- Lyra Health (USA) - Key offerings
- 17.58 Woebot Health (USA)
- Woebot Health (USA) - Overview
- Woebot Health (USA) - Product / Service
- Woebot Health (USA) - Key offerings
- 17.59 MindBeacon (Canada)
- MindBeacon (Canada) - Overview
- MindBeacon (Canada) - Product / Service
- MindBeacon (Canada) - Key offerings
- 17.60 SilverCloud Health (Ireland)
- SilverCloud Health (Ireland) - Overview
- SilverCloud Health (Ireland) - Product / Service
- SilverCloud Health (Ireland) - Key offerings
18 Appendix
- 18.2 Inclusions and exclusions checklist
- Inclusions checklist
- Exclusions checklist
- 18.3 Currency conversion rates for US$
- Currency conversion rates for US$
- 18.4 Research methodology
- 18.7 Validation techniques employed for market sizing
- Validation techniques employed for market sizing
- 18.9 360 degree market analysis
- 360 degree market analysis
- 18.10 List of abbreviations