
Online Toys And Games Retailing Market Size 2025-2029
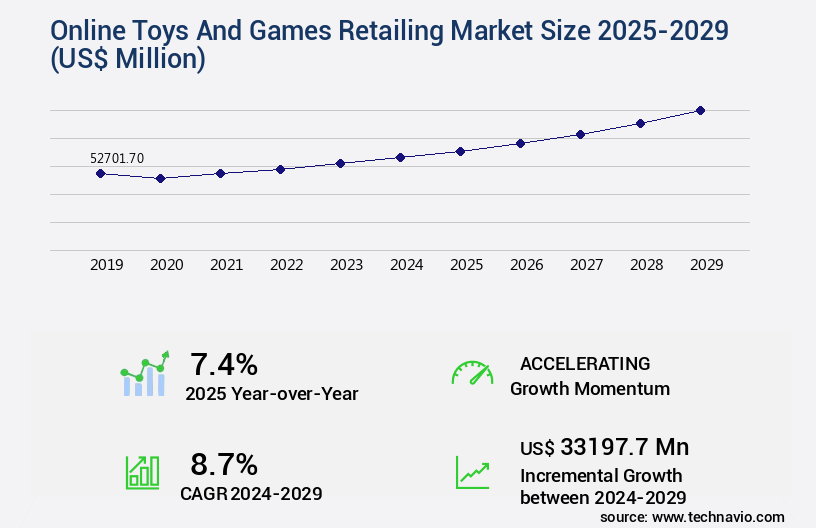
The online toys and games retailing market size is valued to increase by USD 33.2 billion, at a CAGR of 8.7% from 2024 to 2029. The increasing demand for multipurpose toys and games will drive the online toys and games retailing market.
Major Market Trends & Insights
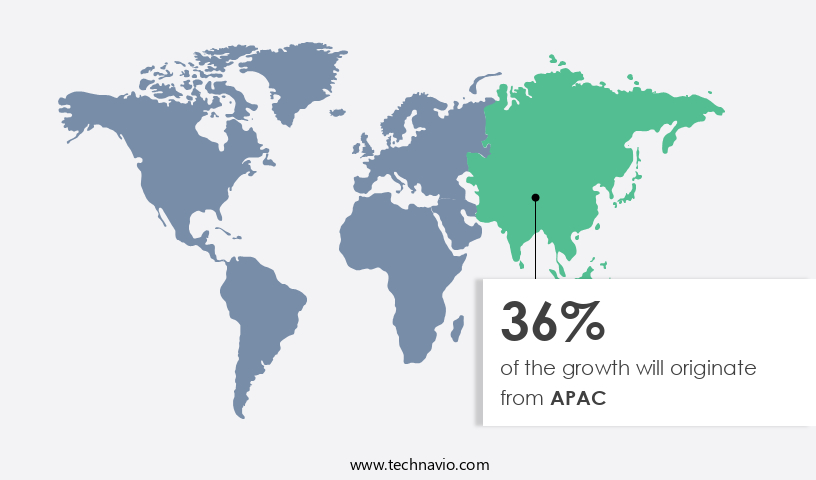
- APAC dominated the market and accounted for a 36% growth during the forecast period.
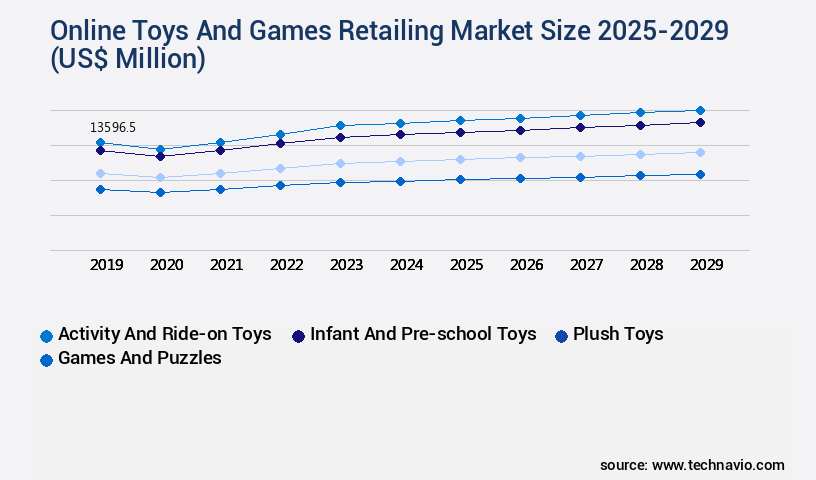
- By Product - Activity and ride-on toys segment was valued at USD 13.6 billion in 2023
- By Application - School age children and teens segment accounted for the largest market revenue share in 2023
Market Size & Forecast
- Market Opportunities: USD 84.00 million
- Market Future Opportunities: USD 33197.70 million
- CAGR from 2024 to 2029 : 8.7%
Market Summary
- The market experiences continuous expansion, fueled by the increasing preference for convenience and the proliferation of advanced technologies. Global online toy sales reached USD 17.6 billion in 2020. This trend is driven by the growing popularity of educational toys, which cater to the rising demand for multipurpose playthings. Additionally, emerging technologies such as augmented reality and virtual reality are revolutionizing the industry, offering immersive gaming experiences. However, the market faces challenges, including the short life cycle of merchandise and collectibles, necessitating frequent product updates and restocking.
- Despite these hurdles, retailers continue to innovate, leveraging data analytics and personalized recommendations to enhance customer experience and boost sales. The market's future direction lies in the integration of technology and the delivery of unique, engaging experiences to consumers.
What will be the Size of the Online Toys And Games Retailing Market during the forecast period?
Get Key Insights on Market Forecast (PDF) Request Free Sample
How is the Online Toys And Games Retailing Market Segmented ?
The online toys and games retailing industry research report provides comprehensive data (region-wise segment analysis), with forecasts and estimates in "USD million" for the period 2025-2029, as well as historical data from 2019-2023 for the following segments.
- Product
- Activity and ride-on toys
- Infant and pre-school toys
- Plush toys
- Games and puzzles
- Others
- Application
- School age children and teens
- Infants and toddlers
- Price Range
- Economy
- Mid-range
- Premium
- Material
- Plastic
- Electronic components
- Wood
- Hybrid materials
- Others
- Geography
- North America
- US
- Canada
- Europe
- France
- Germany
- Italy
- UK
- APAC
- China
- India
- Japan
- South Korea
- Rest of World (ROW)
- North America
By Product Insights
The activity and ride-on toys segment is estimated to witness significant growth during the forecast period.
The market is undergoing continuous evolution, with various sectors demonstrating robust growth. One such segment is personalized recommendations and user experience design, which has gained traction due to the increasing preference for customized shopping experiences. Customer service channels, such as live chat support and email marketing campaigns, have become essential for retailers to ensure customer satisfaction and retention. Search engine optimization and inventory management systems are crucial for online retailers to maintain a competitive edge, while customer relationship management tools help streamline interactions and build long-term relationships. E-commerce platform integration, online payment gateways, and fraud detection systems are essential components of a successful online retail strategy.
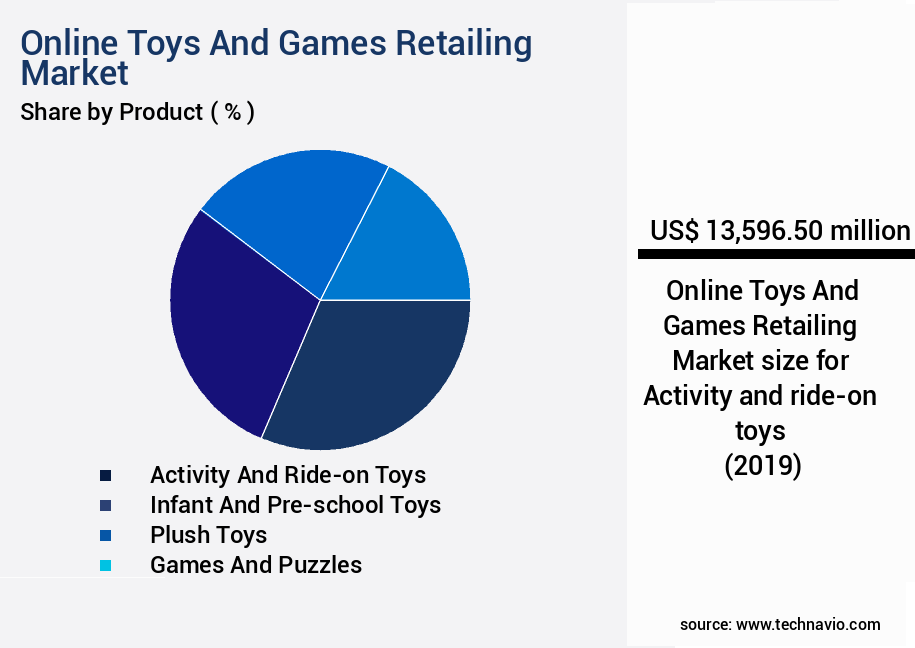
The Activity and ride-on toys segment was valued at USD 13.6 billion in 2019 and showed a gradual increase during the forecast period.
Affiliate marketing programs, gamification techniques, and promotional campaign management are other effective methods used to boost sales and engage customers. Product information management, website accessibility standards, and shipping logistics solutions are also vital for a seamless shopping experience. The rise of influencer marketing strategies, chatbot implementation, and content marketing has transformed digital marketing efforts. Social media marketing and data analytics dashboards provide valuable insights into customer behavior and preferences. The returns management process and supply chain optimization are critical aspects of running a profitable online business.
These toys, which include pedals, motorized, and wheeled options, offer children a fun and interactive way to learn and develop mobility skills. With the increasing disposable income of parents, the demand for premium ride-on toys is on the rise.
Regional Analysis
APAC is estimated to contribute 36% to the growth of the global market during the forecast period. Technavio's analysts have elaborately explained the regional trends and drivers that shape the market during the forecast period.
See How Online Toys And Games Retailing Market Demand is Rising in APAC Request Free Sample
The market is witnessing significant growth, particularly in the Asia Pacific (APAC) region. APAC holds the largest market share in this sector, driven by the region's rapid economic development and increasing disposable income. In developing countries like India and China, traditional toy and games stores remain prevalent. However, the online retail channel experienced a notable surge in sales in 2024. E-commerce platforms, including Flipkart and Snapdeal, reported substantial growth in toy and game sales during this period.
Notable toy and game companies, such as Hasbro Inc., Mattel Inc., and LEGO System AS, have established a strong presence in the Indian market. This trend signifies the evolving nature of the market and its potential for continued growth.
Market Dynamics
Our researchers analyzed the data with 2024 as the base year, along with the key drivers, trends, and challenges. A holistic analysis of drivers will help companies refine their marketing strategies to gain a competitive advantage.
The market is experiencing significant growth as e-commerce continues to transform traditional retail industries. To stay competitive, retailers are integrating their e-commerce platforms with ERP systems to streamline operations and optimize online inventory management. This allows for real-time data analysis and automated reordering, ensuring a consistent supply of popular toys and games. Online retailers are also focusing on improving order fulfillment for toys and games by implementing CRM systems. These tools help retailers analyze customer behavior in online games and personalize toy recommendations, reducing cart abandonment and increasing conversions. Supply chain optimization is another key area of focus, with retailers implementing strategies to enhance online game supply chain efficiency and measure website conversion rates. Customer reviews are a crucial aspect of online toy sales, and retailers are managing them effectively by implementing tools to analyze and respond to feedback. Social media marketing is also a significant driver of sales, and retailers are measuring its effectiveness by analyzing customer segmentation and implementing influencer marketing campaigns. To enhance the online shopping experience, retailers are deploying chatbots for customer service and integrating augmented reality in online toy sales. Virtual reality experiences are also being created for online games, providing customers with immersive and engaging shopping experiences. Retailers are optimizing shipping costs and managing online toy returns efficiently to ensure customer satisfaction. Loyalty programs are being implemented by online game retailers to retain customers and increase repeat business. Gamification techniques are also being used to engage customers and drive sales. Retailers are continually measuring the ROI of their marketing efforts, including influencer marketing for games, to maximize revenue and growth in the market.
What are the key market drivers leading to the rise in the adoption of Online Toys And Games Retailing Industry?
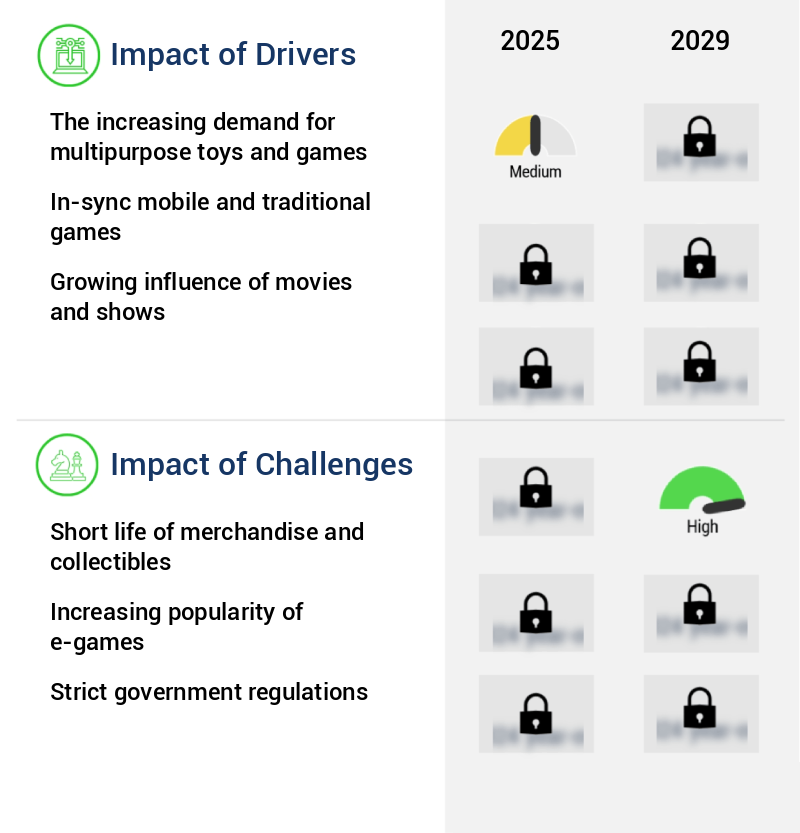
- The escalating market trend revolves around the growing demand for multipurpose toys and games, which serve diverse functions and cater to various age groups and developmental stages. This dynamic consumer preference is the primary driver fueling market growth.
- The market has experienced a significant shift towards multipurpose products that cater to children's educational needs while offering entertainment. With technology increasingly influencing various sectors, the demand for toys and games that foster creativity, logical thinking, and problem-solving skills has surged. Amazon.Com Inc.'s STEM Club subscription program is an illustrative example of this trend. Parents can access this service by visiting the dedicated webpage and selecting their child's age range to sign up.
- This move underscores the importance of integrating learning into playtime, reflecting the evolving nature of the online toys and games retailing industry.
What are the market trends shaping the Online Toys And Games Retailing Industry?
- In the global market, emerging technologies represent the current trend.
- Interactive technologies, including Near-field communication (NFC) connections, holograms, augmented reality, and robotics, are revolutionizing the traditional toys and games sector. These innovations empower kids to create unique play experiences by customizing their toys. For instance, Spin Master's Meccanoid build-it-yourself robot kit lets users construct a Meccano-style robot and bring it to life. Similarly, Lego Fusion allows children to build their toys using real Lego bricks and then engage with them through mobile apps. These advancements are expected to fuel the expansion of the market significantly.
- The integration of technology into toys and games is transforming the way children play and learn, making the market a robust and evolving space.
What challenges does the Online Toys And Games Retailing Industry face during its growth?
- The short lifespan of merchandise and collectibles poses a significant challenge to the growth of the industry. This issue, which is mandatory for industry professionals to acknowledge, stems from the inherent nature of these products as trend-driven and collectible, leading to a limited demand and high replacement rates.
- Online toy and game retailing is an evolving market, characterized by its dynamic nature and extensive applications across various sectors. The demand for merchandise in this industry is not fixed, as it is directly influenced by the popularity of movies, TV shows, and changing consumer preferences. Consequently, retailers must make informed decisions regarding merchandise procurement based on accurate demand forecasts. The highly fragmented manufacturing industry adds complexity to merchandise procurement, as retailers may need to work with a multitude of manufacturers.
- According to recent studies, the global toy market size was valued at approximately USD 91.3 billion in 2020, with the games market projected to reach USD 159.3 billion by 2027. These figures underscore the significant potential and challenges in the online toy and game retailing market.
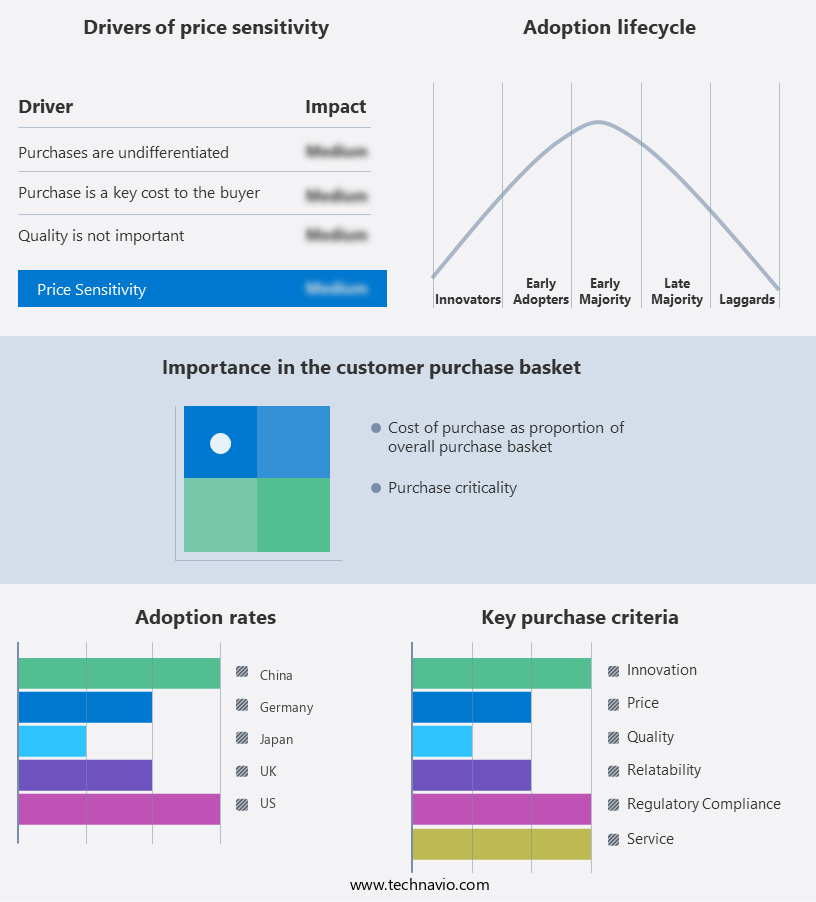
Exclusive Technavio Analysis on Customer Landscape
The online toys and games retailing market forecasting report includes the adoption lifecycle of the market, covering from the innovator's stage to the laggard's stage. It focuses on adoption rates in different regions based on penetration. Furthermore, the online toys and games retailing market report also includes key purchase criteria and drivers of price sensitivity to help companies evaluate and develop their market growth analysis strategies.
Customer Landscape of Online Toys And Games Retailing Industry
Competitive Landscape
Companies are implementing various strategies, such as strategic alliances, online toys and games retailing market forecast, partnerships, mergers and acquisitions, geographical expansion, and product/service launches, to enhance their presence in the industry.
Aldi Stores Ltd. - This company specializes in online retail sales of various toys and games, including the popular Christmas Stretchy Plush, Clementoni Baby Garden Game, and Mystery Jigsaw Puzzles.
The industry research and growth report includes detailed analyses of the competitive landscape of the market and information about key companies, including:
- Aldi Stores Ltd.
- Alpha Group Animation
- Amazon.com Inc.
- BFL Group
- Fat Brain Toys LLC
- Fishpond Ltd.
- Hasbro Inc.
- Kidding Around Toys
- Kohls Inc
- Le Toys Van Inc
- LEGO System AS
- Mary Arnold Toys
- Mattel Inc.
- Nordstrom Inc.
- Qurate Retail Inc.
- Ravensburger AG
- Reliance Industries Ltd.
- Shumee
- Simba Dickie Group GmbH
- Snooplay
- Takara Tomy Co. Ltd.
- The Walt Disney Co.
- TinToyArcade.com LLC
- Toy Cra
- Tru Kids Brand
- UncommonGoods LLC
- Uttam Toys
Qualitative and quantitative analysis of companies has been conducted to help clients understand the wider business environment as well as the strengths and weaknesses of key industry players. Data is qualitatively analyzed to categorize companies as pure play, category-focused, industry-focused, and diversified; it is quantitatively analyzed to categorize companies as dominant, leading, strong, tentative, and weak.
Recent Development and News in Online Toys And Games Retailing Market
- In January 2024, leading online toys and games retailer, Amazon, announced the acquisition of Kidbox, a subscription-based children's clothing and accessories company, aiming to expand its offerings in the family market (Amazon Press Release, 2024).
- In March 2024, Microsoft's gaming division, Xbox, unveiled its new digital game store, further intensifying competition in the market (Xbox Wire, 2024).
- In April 2025, Walmart and Hasbro, the renowned toy manufacturer, announced a strategic partnership to sell Hasbro products exclusively online through Walmart's marketplace, bolstering Walmart's toy offerings and Hasbro's digital sales (Walmart Press Release, 2025).
- In May 2025, LEGO, the Danish toy company, launched its new AR (Augmented Reality) building app, allowing users to purchase LEGO sets online and build them virtually before ordering the physical sets, enhancing the customer experience (LEGO Press Release, 2025).
Dive into Technavio's robust research methodology, blending expert interviews, extensive data synthesis, and validated models for unparalleled Online Toys And Games Retailing Market insights. See full methodology.
|
Market Scope |
|
|
Report Coverage |
Details |
|
Page number |
249 |
|
Base year |
2024 |
|
Historic period |
2019-2023 |
|
Forecast period |
2025-2029 |
|
Growth momentum & CAGR |
Accelerate at a CAGR of 8.7% |
|
Market growth 2025-2029 |
USD 33197.7 million |
|
Market structure |
Fragmented |
|
YoY growth 2024-2025(%) |
7.4 |
|
Key countries |
US, China, Canada, Japan, UK, India, Germany, South Korea, Italy, and France |
|
Competitive landscape |
Leading Companies, Market Positioning of Companies, Competitive Strategies, and Industry Risks |
Research Analyst Overview
- The market continues to evolve, driven by advancements in technology and shifting consumer preferences. Personalized recommendations based on browsing and purchase history have become essential for retailers, enhancing the user experience and driving sales. Customer service channels, including search engine optimization (SEO), live chat support, and email marketing campaigns, enable seamless communication between retailers and customers. Inventory management systems, user experience design, and website conversion rates are critical components of a successful online retail strategy. Online payment gateways and affiliate marketing programs offer convenient payment options and expanded reach, while gamification techniques and loyalty program implementation foster customer engagement.
- E-commerce platform integration, product information management, and website accessibility standards ensure a seamless shopping experience. Shipping logistics solutions, returns management process, and fraud detection systems address operational challenges. Chatbot implementation and content marketing strategies further enhance customer engagement and brand awareness. Industry growth in the online toys and games market is expected to reach double digits in the coming years, with digital marketing strategies, social media marketing, and influencer marketing playing increasingly important roles. For instance, a leading retailer reported a 15% increase in sales due to a well-executed influencer marketing campaign. These evolving patterns underscore the importance of staying agile and adapting to the ever-changing online retail landscape.
What are the Key Data Covered in this Online Toys And Games Retailing Market Research and Growth Report?
-
What is the expected growth of the Online Toys And Games Retailing Market between 2025 and 2029?
-
USD 33.2 billion, at a CAGR of 8.7%
-
-
What segmentation does the market report cover?
-
The report is segmented by Product (Activity and ride-on toys, Infant and pre-school toys, Plush toys, Games and puzzles, and Others), Application (School age children and teens and Infants and toddlers), Price Range (Economy, Mid-range, and Premium), Material (Plastic, Electronic components, Wood, Hybrid materials, and Others), and Geography (APAC, North America, Europe, South America, and Middle East and Africa)
-
-
Which regions are analyzed in the report?
-
APAC, North America, Europe, South America, and Middle East and Africa
-
-
What are the key growth drivers and market challenges?
-
The increasing demand for multipurpose toys and games, Short life of merchandise and collectibles
-
-
Who are the major players in the Online Toys And Games Retailing Market?
-
Aldi Stores Ltd., Alpha Group Animation, Amazon.com Inc., BFL Group, Fat Brain Toys LLC, Fishpond Ltd., Hasbro Inc., Kidding Around Toys, Kohls Inc, Le Toys Van Inc, LEGO System AS, Mary Arnold Toys, Mattel Inc., Nordstrom Inc., Qurate Retail Inc., Ravensburger AG, Reliance Industries Ltd., Shumee, Simba Dickie Group GmbH, Snooplay, Takara Tomy Co. Ltd., The Walt Disney Co., TinToyArcade.com LLC, Toy Cra, Tru Kids Brand, UncommonGoods LLC, and Uttam Toys
-
Market Research Insights
- The market continues to expand, with e-commerce sales accounting for a significant portion of total toy sales. In 2021, digital toy sales are projected to grow by approximately 15%, driven by increasing consumer preference for convenience and the continued growth of e-commerce as a whole. For instance, a leading online retailer experienced a 20% increase in sales during the holiday season due to strategic promotions and streamlined online shopping processes.
- This trend is expected to persist, as the market adapts to evolving consumer preferences and technological advancements.
We can help! Our analysts can customize this online toys and games retailing market research report to meet your requirements.
 RIA -
RIA - 
