Organic Honey Market Analysis, Size, and Forecast 2026-2030: Europe (Germany, UK, and France), North America (US, Canada, and Mexico), APAC (China, Japan, and India), South America (Brazil and Argentina), Middle East and Africa (Saudi Arabia, UAE, and South Africa), and Rest of World (ROW)

Organic Honey Market Analysis, Size, and Forecast 2026-2030:
Europe (Germany, UK, and France), North America (US, Canada, and Mexico), APAC (China, Japan, and India), South America (Brazil and Argentina), Middle East and Africa (Saudi Arabia, UAE, and South Africa), and Rest of World (ROW)

Published: May 2026 298 Pages SKU: IRTNTR40098

Market Overview at a Glance

$611 Mn
Market Opportunity
8.1%
CAGR 2025 - 2030
42.1%
Europe Growth
$1.01 B
Offline segment 2024

Organic Honey Market Size 2026-2030

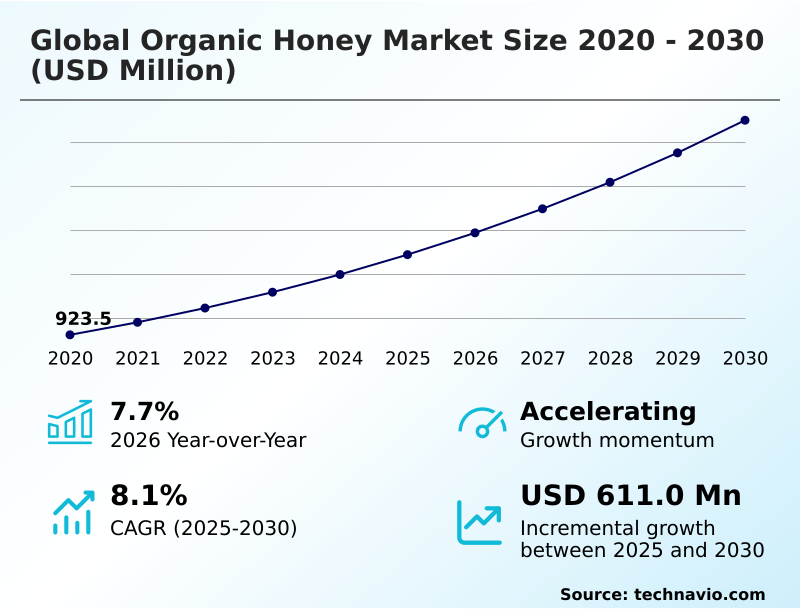
The Organic Honey Market size was valued at USD 1.29 billion in 2025, growing at a CAGR of 8.1% during the forecast period 2026-2030.

Major Market Trends & Insights

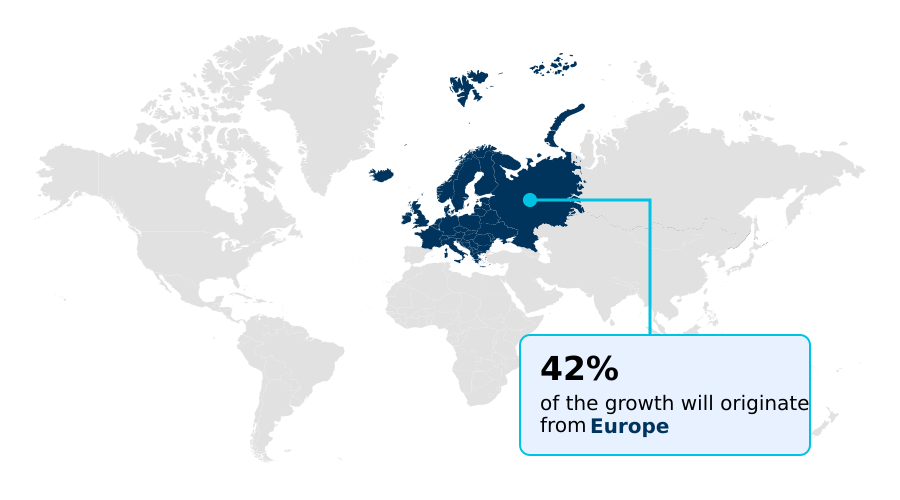
  • Europe dominated the market and accounted for a 42.1% growth during the forecast period.
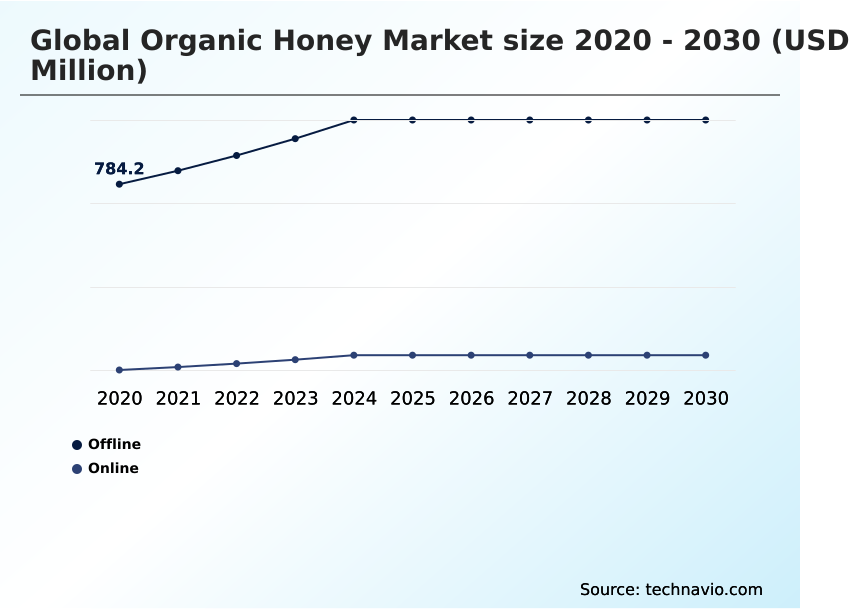
  • By Distribution Channel - Offline segment was valued at USD 1.01 billion in 2024
  • By Product - Mixed organic honey segment accounted for the largest market revenue share in 2024

Market Size & Forecast

  • Historic Market Opportunities 2020-2024: USD 975.4 million
  • Market Future Opportunities 2025-2030: USD 611 million
  • CAGR from 2025 to 2030 : 8.1%

Market Summary

  • The organic honey market is characterized by robust consumer demand for natural and ethically produced sweeteners, with Europe accounting for over 42% of the market's incremental growth. The offline distribution channel continues to dominate sales, representing nearly 84% of the market as consumers prioritize in-person verification of product quality and certification.
  • A key driver is the global clean label movement, pushing consumers away from artificial sweeteners toward nutrient-dense alternatives like raw unpasteurized honey. For instance, a producer might implement a blockchain-based system for supply chain transparency, which can reduce incidents of fraudulent products by over 20%.
  • However, the industry faces the significant challenge of supply chain integrity, where the threat of adulteration with cheaper syrups erodes consumer trust and devalues authentic products. This dynamic forces legitimate producers to invest in costly verification technologies to protect their brand and ensure product purity, adding complexity to operational workflows.

What will be the Size of the Organic Honey Market during the forecast period?

Get Key Insights on Market Forecast (PDF) Request Free Sample

How is the Organic Honey Market Segmented?

The organic honey industry research report provides comprehensive data (region-wise segment analysis), with forecasts and analysis for the period 2026-2030, as well as historical data from 2020-2024 for the following segments.

  • Distribution channel
    • Offline
    • Online
  • Product
    • Mixed organic honey
    • Clover organic honey
    • Manuka organic honey
    • Others
  • End-user
    • Food and beverages
    • Healthcare
    • Cosmetics and personal care
  • Geography
    • Europe
      • Germany
      • UK
      • France
    • North America
      • US
      • Canada
      • Mexico
    • APAC
      • China
      • Japan
      • India
    • South America
      • Brazil
      • Argentina
    • Middle East and Africa
      • Saudi Arabia
      • UAE
      • South Africa
    • Rest of World (ROW)

How is the Organic Honey Market Segmented by Distribution Channel?

The offline segment is estimated to witness significant growth during the forecast period.

The offline distribution channel, accounting for over 83% of total sales, remains the predominant pathway for organic honey, driven by consumer trust in physical product verification.

Supermarkets and specialty health stores leverage this channel to build credibility, as in-person inspection allows buyers to confirm organic certification standards and floral source verification.

This direct engagement model reduces perceived risks of adulteration, a key factor for a market where product integrity is paramount.

To enhance supply chain transparency, some retailers are forming partnerships with local apiaries, a strategy that can decrease transportation-related carbon footprints by more than 15%.

This focus on ethical beekeeping and sustainable sourcing within brick-and-mortar environments reinforces consumer confidence and maintains the channel's market dominance despite the rise of e-commerce.

Request Free Sample

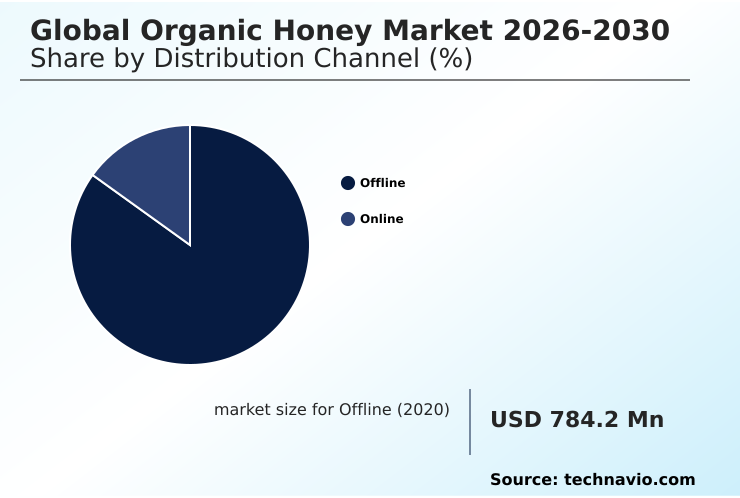
The Offline segment was valued at USD 1.01 billion in 2024 and showed a gradual increase during the forecast period.

Request Free Sample

How demand for the Organic Honey market is rising in the leading region?

Europe is estimated to contribute 42.1% to the growth of the global market during the forecast period.Technavio’s analysts have elaborately explained the regional trends and drivers that shape the market during the forecast period.

See How Organic Honey Market demand is rising in Europe Request Free Sample

The global organic honey market exhibits significant regional disparities in both consumption patterns and growth dynamics, with Europe leading in market size while APAC demonstrates the fastest growth trajectory at 9.1%.

Europe's market, which contributes over 42% of the industry's incremental growth, is dominated by Germany and the UK; these two countries alone constitute more than 40% of the regional sales value.

Consumer behavior in Europe is heavily influenced by a demand for local, sustainable sourcing and adherence to stringent organic certification standards.

In contrast, APAC's expansion is driven by a rising middle class and a cultural appreciation for the prebiotic benefits of monofloral and UMF certified honey.

Operationally, producers targeting the European market often allocate up to 15% more of their budget to compliance and floral source verification to meet regulatory and consumer expectations for supply chain transparency.

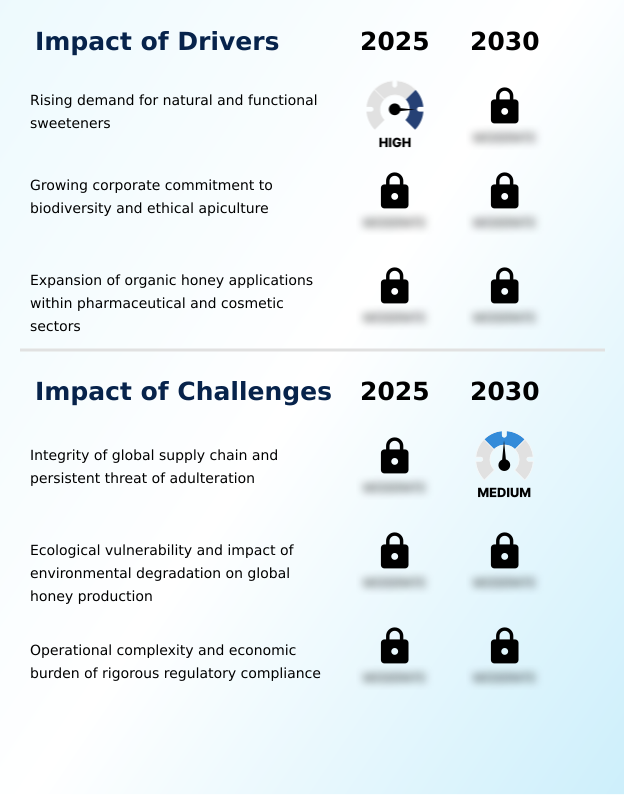
What are the key Drivers, Trends, and Challenges in the Organic Honey Market?

Our researchers analyzed the data with 2025 as the base year, along with the key drivers, trends, and challenges. A holistic analysis of drivers will help companies refine their marketing strategies to gain a competitive advantage.

  • Discerning consumers are increasingly exploring the specific health advantages of different honey types, with a significant focus on organic manuka honey health benefits, particularly its unique antimicrobial properties. This trend has also boosted interest in finding the best raw organic honey for immunity, as raw unpasteurized honey retains beneficial enzymes and pollen that are often lost in processing.
  • A key concern for buyers is learning how to verify pure organic honey. To address this, leading producers are adopting advanced molecular authentication techniques, which have been shown to improve food fraud detection accuracy by over 95% compared to conventional testing methods.
  • This commitment to transparency is a hallmark of top sustainable organic honey brands, which prioritize regenerative apiculture and ethical beekeeping. Such brands often experience customer loyalty rates that are 10-15% higher than their competitors.
  • The fundamental difference in the organic honey vs conventional honey debate lies in the certified absence of synthetic pesticides and antibiotics, a critical factor for the clean label movement. While adhering to rigorous organic certification standards increases production costs, it guarantees the supply chain integrity that modern consumers demand, solidifying the market position of authentic, high-quality organic honey.

What are the key market drivers leading to the rise in the adoption of Organic Honey Industry?

  • The rising consumer demand for natural and functional sweeteners is the key driver propelling market growth.

  • The primary driver for the organic honey market is the definitive consumer shift toward natural sweeteners, with over 60% of shoppers now actively preferring them over refined sugars.
  • This trend is a direct result of the clean label movement and heightened health awareness, significantly boosting demand for raw unpasteurized honey known for its prebiotic benefits and rich nutritional profile.
  • This behavioral change creates a strong pull for products perceived as pure and unprocessed.
  • Another major driver is the increasing corporate commitment to environmental stewardship, where companies adopting ethical apiculture practices for pollinator conservation see brand perception among eco-conscious consumers improve by more than 25%.
  • This synergy between consumer wellness goals and corporate sustainability initiatives is fueling sustained market expansion.

What are the market trends shaping the Organic Honey Industry?

  • A key trend shaping the market is the integration of advanced technologies for product traceability. This includes the use of molecular authentication methods to ensure supply chain integrity and combat adulteration.

  • A significant trend transforming the organic honey market is the strategic diversification into functional and value-added products, which now exhibit a growth rate 15% higher than traditional honey offerings. Manufacturers are infusing organic honey with ingredients like propolis and royal jelly to create wellness-focused items, enhancing their therapeutic efficacy. This innovation directly caters to consumers seeking multifunctional foods.
  • Concurrently, the adoption of advanced molecular authentication technologies is becoming standard for ensuring supply chain transparency. These systems improve food fraud detection capabilities by over 90%, allowing brands to command a price premium of up to 20% by guaranteeing product purity and validating the authenticity of premium varieties like UMF certified honey.
  • This shift toward verified, functional products is reshaping brand strategy and consumer expectations.

What challenges does the Organic Honey Industry face during its growth?

  • Maintaining the integrity of the global supply chain amidst the persistent threat of adulteration poses a significant challenge to the industry's growth.

  • The integrity of the global supply chain remains the foremost challenge for the organic honey market, as adulterated products can undercut authentic goods by as much as 40%, severely eroding market value and consumer trust.
  • This persistent threat of food fraud forces legitimate producers to invest in costly technologies like molecular authentication, which can increase operational expenses by 10-15% to maintain organic certification standards. This economic pressure is compounded by the ecological vulnerability of honeybee populations. Increasing climate-related disruptions and habitat loss threaten pollinator conservation, leading to volatile yields and unpredictable supply chain disruptions.
  • Such environmental instability makes it difficult for producers to guarantee consistent supply, directly impacting their ability to meet global demand and uphold environmental stewardship commitments.

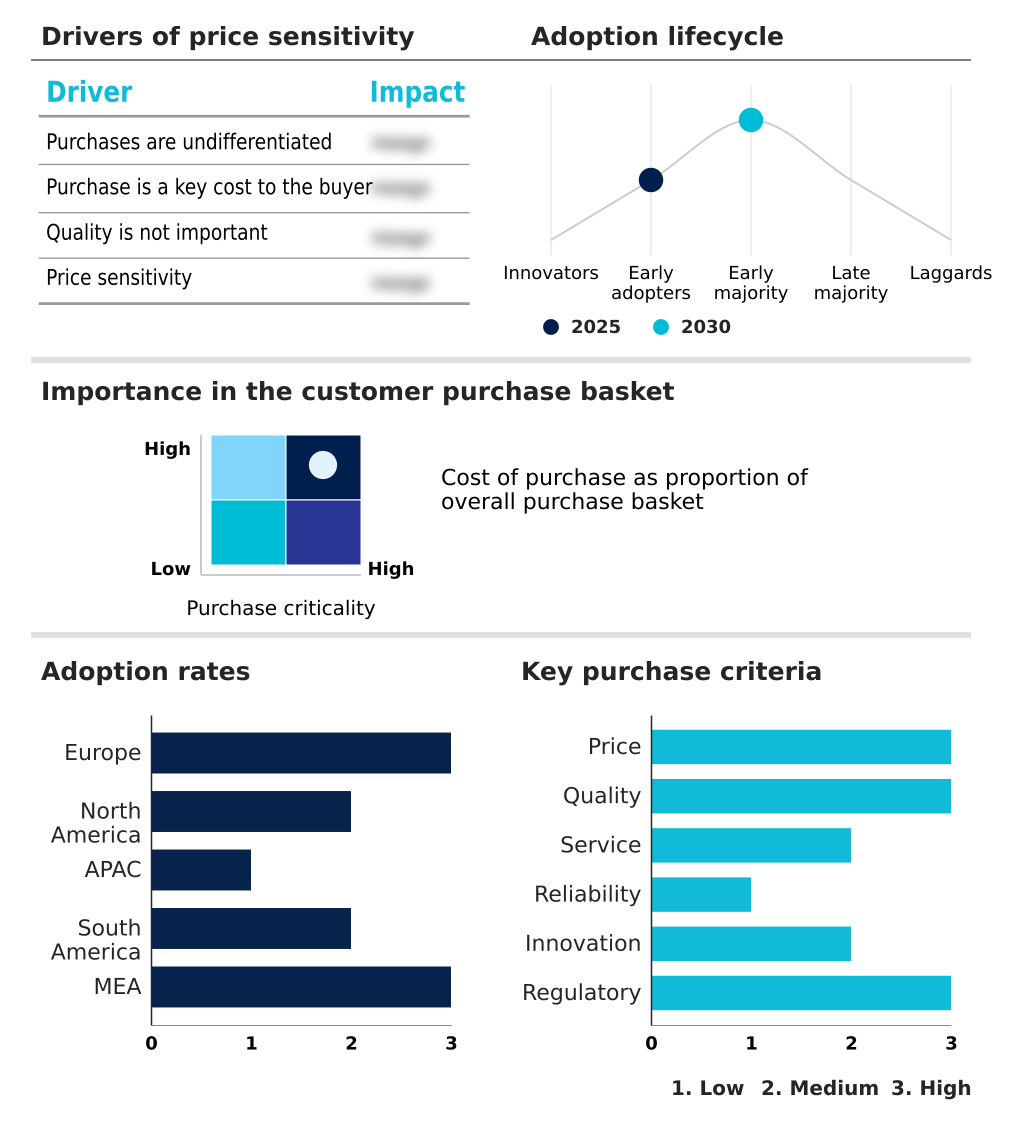
Exclusive Technavio Analysis on Customer Landscape

The organic honey market forecasting report includes the adoption lifecycle of the market, covering from the innovator’s stage to the laggard’s stage. It focuses on adoption rates in different regions based on penetration. Furthermore, the organic honey market report also includes key purchase criteria and drivers of price sensitivity to help companies evaluate and develop their market growth analysis strategies.

Customer Landscape of Organic Honey Industry

Competitive Landscape

Companies are implementing various strategies, such as strategic alliances, organic honey market forecast, partnerships, mergers and acquisitions, geographical expansion, and product/service launches, to enhance their presence in the industry.

Barkman Honey LLC - Specializes in high-potency, UMF certified Manuka honey, targeting the premium health and wellness sector with products validated for therapeutic efficacy and purity.

The industry research and growth report includes detailed analyses of the competitive landscape of the market and information about key companies, including:

  • Barkman Honey LLC
  • Bee Maid Honey Ltd.
  • Beedvine
  • Capilano Honey Ltd.
  • Comvita Ltd.
  • Conapi Sca
  • Dabur India Ltd.
  • Dutch Gold Honey Inc.
  • Glorybee Inc.
  • Heavenly Organics LLC
  • Hive and Wellness Pty Ltd.
  • New Zealand Honey Co.
  • Organic India Pvt. Ltd.
  • Patanjali Ayurved Ltd.
  • Really Raw Honey
  • Savannah Bee Co.
  • Sioux Honey Association Crop.
  • Valeo Foods Ltd.
  • Wedderspoon Organic Inc.
  • Y.S. Organic Bee Farms

Qualitative and quantitative analysis of companies has been conducted to help clients understand the wider business environment as well as the strengths and weaknesses of key industry players. Data is qualitatively analyzed to categorize companies as pure play, category-focused, industry-focused, and diversified; it is quantitatively analyzed to categorize companies as dominant, leading, strong, tentative, and weak.

Market Intelligence Radar: High-Impact Developments & Growth Signals

  • In the Packaged Foods and Meats industry, increasingly stringent food safety regulations are mandating greater supply chain transparency, directly compelling organic honey producers to adopt comprehensive traceability systems to prove authenticity and combat food fraud detection.
  • The widespread adoption of advanced track-and-trace technologies, including blockchain, is enabling companies to provide verifiable proof of sustainable sourcing and adherence to organic certification standards, reinforcing consumer trust in premium honey products.
  • A consumer-driven shift toward minimally processed foods and clean-label ingredients is expanding the market for raw, unpasteurized honey, aligning with the broader demand for natural sweeteners that offer functional health benefits.
  • The growth of private-label brands with a strong focus on environmental stewardship and sustainability is creating new partnership opportunities for organic honey suppliers who can demonstrate robust ethical beekeeping and biodiversity protection practices.

Dive into Technavio’s robust research methodology, blending expert interviews, extensive data synthesis, and validated models for unparalleled Organic Honey Market insights. See full methodology.

Market Scope
Page number 298
Base year 2025
Historic period 2020-2024
Forecast period 2026-2030
Growth momentum & CAGR Accelerate at a CAGR of 8.1%
Market growth 2026-2030 USD 611.0 million
Market structure Fragmented
YoY growth 2025-2026(%) 7.7%
Key countries Germany, UK, France, Italy, Spain, The Netherlands, US, Canada, Mexico, China, Japan, India, South Korea, Australia, Indonesia, Brazil, Argentina, Chile, Saudi Arabia, UAE, South Africa, Israel and Turkey
Competitive landscape Leading Companies, Market Positioning of Companies, Competitive Strategies, and Industry Risks

Request Free Sample

Research Analyst Overview

  • The organic honey market ecosystem is a complex network where stakeholders' interactions are driven by consumer demand for purity and sustainability, with the offline channel accounting for over 83% of sales.
  • Small-scale beekeepers serve as the primary suppliers of raw honey, which is then processed and packaged by manufacturers who must adhere to stringent organic certification standards set by bodies like the USDA and EU Organic. The food and beverages sector is the largest end-user, consuming over 56% of all organic honey.
  • These processors rely on global distribution channels to reach end-users in food, healthcare, and cosmetics. Supporting entities providing logistics and technology for supply chain transparency are becoming increasingly critical for verifying ethical apiculture practices and ensuring product integrity from hive to shelf, a key differentiator in a competitive market.

What are the Key Data Covered in this Organic Honey Market Research and Growth Report?

  • What is the expected growth of the Organic Honey Market between 2026 and 2030?

    • The Organic Honey Market is expected to grow by USD 611 million during 2026-2030, registering a CAGR of 8.1%. Year-over-year growth in 2026 is estimated at 7.7%%. This acceleration is shaped by rising demand for natural and functional sweeteners, which is intensifying demand across multiple end-use verticals covered in the report.

  • What segmentation does the market report cover?

    • The report is segmented by Distribution Channel (Offline, and Online), Product (Mixed organic honey, Clover organic honey, Manuka organic honey, and Others), End-user (Food and beverages, Healthcare, and Cosmetics and personal care) and Geography (Europe, North America, APAC, South America, Middle East and Africa). Among these, the Offline segment is estimated to witness significant growth during the forecast period, driven by rising adoption across key application areas. Each segment includes detailed qualitative and quantitative analysis, along with historical data from 2020-2024 and forecasts through 2030 with year-over-year growth rates.

  • Which regions are analyzed in the report?

    • The report covers Europe, North America, APAC, South America and Middle East and Africa. Europe is estimated to contribute 42.1% to market growth during the forecast period. Country-level analysis includes Germany, UK, France, Italy, Spain, The Netherlands, US, Canada, Mexico, China, Japan, India, South Korea, Australia, Indonesia, Brazil, Argentina, Chile, Saudi Arabia, UAE, South Africa, Israel and Turkey, with dedicated market size tables and year-over-year growth for each.

  • What are the key growth drivers and market challenges?

    • The primary driver is rising demand for natural and functional sweeteners, which is accelerating investment and industry demand. The main challenge is integrity of global supply chain and persistent threat of adulteration, creating operational barriers for key market participants. The report quantifies the impact of each driver and challenge across 2026 and 2030 with comparative analysis.

  • Who are the major players in the Organic Honey Market?

    • Key vendors include Barkman Honey LLC, Bee Maid Honey Ltd., Beedvine, Capilano Honey Ltd., Comvita Ltd., Conapi Sca, Dabur India Ltd., Dutch Gold Honey Inc., Glorybee Inc., Heavenly Organics LLC, Hive and Wellness Pty Ltd., New Zealand Honey Co., Organic India Pvt. Ltd., Patanjali Ayurved Ltd., Really Raw Honey, Savannah Bee Co., Sioux Honey Association Crop., Valeo Foods Ltd., Wedderspoon Organic Inc. and Y.S. Organic Bee Farms. The report provides qualitative and quantitative analysis categorizing companies as dominant, leading, strong, tentative, and weak based on their market positioning. Company profiles include business segment analysis, SWOT assessment, key offerings, and recent strategic developments.

Market Research Insights

  • The competitive landscape of the global organic honey market is highly fragmented, with the leading five vendors comprising less than 30% of the total market share. Key players such as Comvita Ltd. and Wedderspoon Organic Inc. are focusing on product innovation and strategic market expansion to gain a competitive edge.
  • For example, Comvita's targeted distribution strategy in North America resulted in a significant margin recovery, while Wedderspoon's development of functional throat sprays secured a prestigious health and beauty award. This pivot toward wellness applications addresses a growing consumer demand for products with proven therapeutic efficacy.
  • The functional foods segment, including honey-infused products, is expanding at a rate over 7% faster than traditional honey, highlighting this shift. Nevertheless, supply chain integrity remains a persistent challenge, compelling companies to adopt advanced methods like NMR testing for food fraud detection and to ensure unwavering quality.

We can help! Our analysts can customize this organic honey market research report to meet your requirements.

Get in touch

1. Executive Summary

1.1 Market overview

Executive Summary - Chart on Market Overview
Executive Summary - Data Table on Market Overview
Executive Summary - Chart on Global Market Characteristics
Executive Summary - Chart on Market by Geography
Executive Summary - Chart on Market Segmentation by Distribution Channel
Executive Summary - Chart on Market Segmentation by Product
Executive Summary - Chart on Market Segmentation by End-user
Executive Summary - Chart on Incremental Growth
Executive Summary - Data Table on Incremental Growth
Executive Summary - Chart on Company Market Positioning

2. Technavio Analysis

2.1 Analysis of price sensitivity, lifecycle, customer purchase basket, adoption rates, and purchase criteria

2.2 Criticality of inputs and Factors of differentiation

Chart on Overview on criticality of inputs and factors of differentiation

2.3 Factors of disruption

Chart on Overview on factors of disruption

2.4 Impact of drivers and challenges

Chart on Impact of drivers and challenges in 2025 and 2030

3. Market Landscape

3.1 Market ecosystem

Chart on Parent Market
Data Table on - Parent Market

3.2 Market characteristics

Chart on Market characteristics analysis

3.3 Value chain analysis

Chart on Value chain analysis

4. Market Sizing

4.1 Market definition

Data Table on Offerings of companies included in the market definition

4.2 Market segment analysis

Market segments

4.3 Market size 2025

4.4 Market outlook: Forecast for 2025-2030

Chart on Global - Market size and forecast 2025-2030 ($ million)
Data Table on Global - Market size and forecast 2025-2030 ($ million)
Chart on Global Market: Year-over-year growth 2025-2030 (%)
Data Table on Global Market: Year-over-year growth 2025-2030 (%)

5. Historic Market Size

5.1 Global Organic Honey Market 2020 - 2024

Historic Market Size - Data Table on Global Organic Honey Market 2020 - 2024 ($ million)

5.2 Distribution Channel segment analysis 2020 - 2024

Historic Market Size - Distribution Channel Segment 2020 - 2024 ($ million)

5.3 Product segment analysis 2020 - 2024

Historic Market Size - Product Segment 2020 - 2024 ($ million)

5.4 End-user segment analysis 2020 - 2024

Historic Market Size - End-user Segment 2020 - 2024 ($ million)

5.5 Geography segment analysis 2020 - 2024

Historic Market Size - Geography Segment 2020 - 2024 ($ million)

5.6 Country segment analysis 2020 - 2024

Historic Market Size - Country Segment 2020 - 2024 ($ million)

6. Qualitative Analysis

6.1 Impact of AI on Global Organic Honey Market

6.2 Impact of geopolitical conflict on Global Organic Honey Market

7. Five Forces Analysis

7.1 Five forces summary

Five forces analysis - Comparison between 2025 and 2030

7.2 Bargaining power of buyers

Bargaining power of buyers - Impact of key factors 2025 and 2030

7.3 Bargaining power of suppliers

Bargaining power of suppliers - Impact of key factors in 2025 and 2030

7.4 Threat of new entrants

Threat of new entrants - Impact of key factors in 2025 and 2030

7.5 Threat of substitutes

Threat of substitutes - Impact of key factors in 2025 and 2030

7.6 Threat of rivalry

Threat of rivalry - Impact of key factors in 2025 and 2030

7.7 Market condition

Chart on Market condition - Five forces 2025 and 2030

8. Market Segmentation by Distribution Channel

8.1 Market segments

Chart on Distribution Channel - Market share 2025-2030 (%)
Data Table on Distribution Channel - Market share 2025-2030 (%)

8.2 Comparison by Distribution Channel

Chart on Comparison by Distribution Channel
Data Table on Comparison by Distribution Channel

8.3 Offline - Market size and forecast 2025-2030

Chart on Offline - Market size and forecast 2025-2030 ($ million)
Data Table on Offline - Market size and forecast 2025-2030 ($ million)
Chart on Offline - Year-over-year growth 2025-2030 (%)
Data Table on Offline - Year-over-year growth 2025-2030 (%)

8.4 Online - Market size and forecast 2025-2030

Chart on Online - Market size and forecast 2025-2030 ($ million)
Data Table on Online - Market size and forecast 2025-2030 ($ million)
Chart on Online - Year-over-year growth 2025-2030 (%)
Data Table on Online - Year-over-year growth 2025-2030 (%)

8.5 Market opportunity by Distribution Channel

Market opportunity by Distribution Channel ($ million)
Data Table on Market opportunity by Distribution Channel ($ million)

9. Market Segmentation by Product

9.1 Market segments

Chart on Product - Market share 2025-2030 (%)
Data Table on Product - Market share 2025-2030 (%)

9.2 Comparison by Product

Chart on Comparison by Product
Data Table on Comparison by Product

9.3 Mixed organic honey - Market size and forecast 2025-2030

Chart on Mixed organic honey - Market size and forecast 2025-2030 ($ million)
Data Table on Mixed organic honey - Market size and forecast 2025-2030 ($ million)
Chart on Mixed organic honey - Year-over-year growth 2025-2030 (%)
Data Table on Mixed organic honey - Year-over-year growth 2025-2030 (%)

9.4 Clover organic honey - Market size and forecast 2025-2030

Chart on Clover organic honey - Market size and forecast 2025-2030 ($ million)
Data Table on Clover organic honey - Market size and forecast 2025-2030 ($ million)
Chart on Clover organic honey - Year-over-year growth 2025-2030 (%)
Data Table on Clover organic honey - Year-over-year growth 2025-2030 (%)

9.5 Manuka organic honey - Market size and forecast 2025-2030

Chart on Manuka organic honey - Market size and forecast 2025-2030 ($ million)
Data Table on Manuka organic honey - Market size and forecast 2025-2030 ($ million)
Chart on Manuka organic honey - Year-over-year growth 2025-2030 (%)
Data Table on Manuka organic honey - Year-over-year growth 2025-2030 (%)

9.6 Others - Market size and forecast 2025-2030

Chart on Others - Market size and forecast 2025-2030 ($ million)
Data Table on Others - Market size and forecast 2025-2030 ($ million)
Chart on Others - Year-over-year growth 2025-2030 (%)
Data Table on Others - Year-over-year growth 2025-2030 (%)

9.7 Market opportunity by Product

Market opportunity by Product ($ million)
Data Table on Market opportunity by Product ($ million)

10. Market Segmentation by End-user

10.1 Market segments

Chart on End-user - Market share 2025-2030 (%)
Data Table on End-user - Market share 2025-2030 (%)

10.2 Comparison by End-user

Chart on Comparison by End-user
Data Table on Comparison by End-user

10.3 Food and beverages - Market size and forecast 2025-2030

Chart on Food and beverages - Market size and forecast 2025-2030 ($ million)
Data Table on Food and beverages - Market size and forecast 2025-2030 ($ million)
Chart on Food and beverages - Year-over-year growth 2025-2030 (%)
Data Table on Food and beverages - Year-over-year growth 2025-2030 (%)

10.4 Healthcare - Market size and forecast 2025-2030

Chart on Healthcare - Market size and forecast 2025-2030 ($ million)
Data Table on Healthcare - Market size and forecast 2025-2030 ($ million)
Chart on Healthcare - Year-over-year growth 2025-2030 (%)
Data Table on Healthcare - Year-over-year growth 2025-2030 (%)

10.5 Cosmetics and personal care - Market size and forecast 2025-2030

Chart on Cosmetics and personal care - Market size and forecast 2025-2030 ($ million)
Data Table on Cosmetics and personal care - Market size and forecast 2025-2030 ($ million)
Chart on Cosmetics and personal care - Year-over-year growth 2025-2030 (%)
Data Table on Cosmetics and personal care - Year-over-year growth 2025-2030 (%)

10.6 Market opportunity by End-user

Market opportunity by End-user ($ million)
Data Table on Market opportunity by End-user ($ million)

11. Customer Landscape

11.1 Customer landscape overview

Analysis of price sensitivity, lifecycle, customer purchase basket, adoption rates, and purchase criteria

12. Geographic Landscape

12.1 Geographic segmentation

Chart on Market share by geography 2025-2030 (%)
Data Table on Market share by geography 2025-2030 (%)

12.2 Geographic comparison

Chart on Geographic comparison
Data Table on Geographic comparison

12.3 Europe - Market size and forecast 2025-2030

Chart on Europe - Market size and forecast 2025-2030 ($ million)
Data Table on Europe - Market size and forecast 2025-2030 ($ million)
Chart on Europe - Year-over-year growth 2025-2030 (%)
Data Table on Europe - Year-over-year growth 2025-2030 (%)
Chart on Regional Comparison - Europe
Data Table on Regional Comparison - Europe

12.3.1 Germany - Market size and forecast 2025-2030

Chart on Germany - Market size and forecast 2025-2030 ($ million)
Data Table on Germany - Market size and forecast 2025-2030 ($ million)
Chart on Germany - Year-over-year growth 2025-2030 (%)
Data Table on Germany - Year-over-year growth 2025-2030 (%)

12.3.2 UK - Market size and forecast 2025-2030

Chart on UK - Market size and forecast 2025-2030 ($ million)
Data Table on UK - Market size and forecast 2025-2030 ($ million)
Chart on UK - Year-over-year growth 2025-2030 (%)
Data Table on UK - Year-over-year growth 2025-2030 (%)

12.3.3 France - Market size and forecast 2025-2030

Chart on France - Market size and forecast 2025-2030 ($ million)
Data Table on France - Market size and forecast 2025-2030 ($ million)
Chart on France - Year-over-year growth 2025-2030 (%)
Data Table on France - Year-over-year growth 2025-2030 (%)

12.3.4 Italy - Market size and forecast 2025-2030

Chart on Italy - Market size and forecast 2025-2030 ($ million)
Data Table on Italy - Market size and forecast 2025-2030 ($ million)
Chart on Italy - Year-over-year growth 2025-2030 (%)
Data Table on Italy - Year-over-year growth 2025-2030 (%)

12.3.5 Spain - Market size and forecast 2025-2030

Chart on Spain - Market size and forecast 2025-2030 ($ million)
Data Table on Spain - Market size and forecast 2025-2030 ($ million)
Chart on Spain - Year-over-year growth 2025-2030 (%)
Data Table on Spain - Year-over-year growth 2025-2030 (%)

12.3.6 The Netherlands - Market size and forecast 2025-2030

Chart on The Netherlands - Market size and forecast 2025-2030 ($ million)
Data Table on The Netherlands - Market size and forecast 2025-2030 ($ million)
Chart on The Netherlands - Year-over-year growth 2025-2030 (%)
Data Table on The Netherlands - Year-over-year growth 2025-2030 (%)

12.4 North America - Market size and forecast 2025-2030

Chart on North America - Market size and forecast 2025-2030 ($ million)
Data Table on North America - Market size and forecast 2025-2030 ($ million)
Chart on North America - Year-over-year growth 2025-2030 (%)
Data Table on North America - Year-over-year growth 2025-2030 (%)
Chart on Regional Comparison - North America
Data Table on Regional Comparison - North America

12.4.1 US - Market size and forecast 2025-2030

Chart on US - Market size and forecast 2025-2030 ($ million)
Data Table on US - Market size and forecast 2025-2030 ($ million)
Chart on US - Year-over-year growth 2025-2030 (%)
Data Table on US - Year-over-year growth 2025-2030 (%)

12.4.2 Canada - Market size and forecast 2025-2030

Chart on Canada - Market size and forecast 2025-2030 ($ million)
Data Table on Canada - Market size and forecast 2025-2030 ($ million)
Chart on Canada - Year-over-year growth 2025-2030 (%)
Data Table on Canada - Year-over-year growth 2025-2030 (%)

12.4.3 Mexico - Market size and forecast 2025-2030

Chart on Mexico - Market size and forecast 2025-2030 ($ million)
Data Table on Mexico - Market size and forecast 2025-2030 ($ million)
Chart on Mexico - Year-over-year growth 2025-2030 (%)
Data Table on Mexico - Year-over-year growth 2025-2030 (%)

12.5 APAC - Market size and forecast 2025-2030

Chart on APAC - Market size and forecast 2025-2030 ($ million)
Data Table on APAC - Market size and forecast 2025-2030 ($ million)
Chart on APAC - Year-over-year growth 2025-2030 (%)
Data Table on APAC - Year-over-year growth 2025-2030 (%)
Chart on Regional Comparison - APAC
Data Table on Regional Comparison - APAC

12.5.1 China - Market size and forecast 2025-2030

Chart on China - Market size and forecast 2025-2030 ($ million)
Data Table on China - Market size and forecast 2025-2030 ($ million)
Chart on China - Year-over-year growth 2025-2030 (%)
Data Table on China - Year-over-year growth 2025-2030 (%)

12.5.2 Japan - Market size and forecast 2025-2030

Chart on Japan - Market size and forecast 2025-2030 ($ million)
Data Table on Japan - Market size and forecast 2025-2030 ($ million)
Chart on Japan - Year-over-year growth 2025-2030 (%)
Data Table on Japan - Year-over-year growth 2025-2030 (%)

12.5.3 India - Market size and forecast 2025-2030

Chart on India - Market size and forecast 2025-2030 ($ million)
Data Table on India - Market size and forecast 2025-2030 ($ million)
Chart on India - Year-over-year growth 2025-2030 (%)
Data Table on India - Year-over-year growth 2025-2030 (%)

12.5.4 South Korea - Market size and forecast 2025-2030

Chart on South Korea - Market size and forecast 2025-2030 ($ million)
Data Table on South Korea - Market size and forecast 2025-2030 ($ million)
Chart on South Korea - Year-over-year growth 2025-2030 (%)
Data Table on South Korea - Year-over-year growth 2025-2030 (%)

12.5.5 Australia - Market size and forecast 2025-2030

Chart on Australia - Market size and forecast 2025-2030 ($ million)
Data Table on Australia - Market size and forecast 2025-2030 ($ million)
Chart on Australia - Year-over-year growth 2025-2030 (%)
Data Table on Australia - Year-over-year growth 2025-2030 (%)

12.5.6 Indonesia - Market size and forecast 2025-2030

Chart on Indonesia - Market size and forecast 2025-2030 ($ million)
Data Table on Indonesia - Market size and forecast 2025-2030 ($ million)
Chart on Indonesia - Year-over-year growth 2025-2030 (%)
Data Table on Indonesia - Year-over-year growth 2025-2030 (%)

12.6 South America - Market size and forecast 2025-2030

Chart on South America - Market size and forecast 2025-2030 ($ million)
Data Table on South America - Market size and forecast 2025-2030 ($ million)
Chart on South America - Year-over-year growth 2025-2030 (%)
Data Table on South America - Year-over-year growth 2025-2030 (%)
Chart on Regional Comparison - South America
Data Table on Regional Comparison - South America

12.6.1 Brazil - Market size and forecast 2025-2030

Chart on Brazil - Market size and forecast 2025-2030 ($ million)
Data Table on Brazil - Market size and forecast 2025-2030 ($ million)
Chart on Brazil - Year-over-year growth 2025-2030 (%)
Data Table on Brazil - Year-over-year growth 2025-2030 (%)

12.6.2 Argentina - Market size and forecast 2025-2030

Chart on Argentina - Market size and forecast 2025-2030 ($ million)
Data Table on Argentina - Market size and forecast 2025-2030 ($ million)
Chart on Argentina - Year-over-year growth 2025-2030 (%)
Data Table on Argentina - Year-over-year growth 2025-2030 (%)

12.6.3 Chile - Market size and forecast 2025-2030

Chart on Chile - Market size and forecast 2025-2030 ($ million)
Data Table on Chile - Market size and forecast 2025-2030 ($ million)
Chart on Chile - Year-over-year growth 2025-2030 (%)
Data Table on Chile - Year-over-year growth 2025-2030 (%)

12.7 Middle East and Africa - Market size and forecast 2025-2030

Chart on Middle East and Africa - Market size and forecast 2025-2030 ($ million)
Data Table on Middle East and Africa - Market size and forecast 2025-2030 ($ million)
Chart on Middle East and Africa - Year-over-year growth 2025-2030 (%)
Data Table on Middle East and Africa - Year-over-year growth 2025-2030 (%)
Chart on Regional Comparison - Middle East and Africa
Data Table on Regional Comparison - Middle East and Africa

12.7.1 Saudi Arabia - Market size and forecast 2025-2030

Chart on Saudi Arabia - Market size and forecast 2025-2030 ($ million)
Data Table on Saudi Arabia - Market size and forecast 2025-2030 ($ million)
Chart on Saudi Arabia - Year-over-year growth 2025-2030 (%)
Data Table on Saudi Arabia - Year-over-year growth 2025-2030 (%)

12.7.2 UAE - Market size and forecast 2025-2030

Chart on UAE - Market size and forecast 2025-2030 ($ million)
Data Table on UAE - Market size and forecast 2025-2030 ($ million)
Chart on UAE - Year-over-year growth 2025-2030 (%)
Data Table on UAE - Year-over-year growth 2025-2030 (%)

12.7.3 South Africa - Market size and forecast 2025-2030

Chart on South Africa - Market size and forecast 2025-2030 ($ million)
Data Table on South Africa - Market size and forecast 2025-2030 ($ million)
Chart on South Africa - Year-over-year growth 2025-2030 (%)
Data Table on South Africa - Year-over-year growth 2025-2030 (%)

12.7.4 Israel - Market size and forecast 2025-2030

Chart on Israel - Market size and forecast 2025-2030 ($ million)
Data Table on Israel - Market size and forecast 2025-2030 ($ million)
Chart on Israel - Year-over-year growth 2025-2030 (%)
Data Table on Israel - Year-over-year growth 2025-2030 (%)

12.7.5 Turkey - Market size and forecast 2025-2030

Chart on Turkey - Market size and forecast 2025-2030 ($ million)
Data Table on Turkey - Market size and forecast 2025-2030 ($ million)
Chart on Turkey - Year-over-year growth 2025-2030 (%)
Data Table on Turkey - Year-over-year growth 2025-2030 (%)

12.8 Market opportunity by geography

Market opportunity by geography ($ million)
Data Tables on Market opportunity by geography ($ million)

13. Drivers, Challenges, and Opportunity

13.1 Market drivers

Rising demand for natural and functional sweeteners
Growing corporate commitment to biodiversity and ethical apiculture
Expansion of organic honey applications within pharmaceutical and cosmetic sectors

13.2 Market challenges

Integrity of global supply chain and persistent threat of adulteration
Ecological vulnerability and impact of environmental degradation on global honey production
Operational complexity and economic burden of rigorous regulatory compliance

13.3 Impact of drivers and challenges

Impact of drivers and challenges in 2025 and 2030

13.4 Market opportunities

Technological advancements in product traceability and molecular authentication
Strategic diversification into functional organic honey infusions and wellness products
Rise of regenerative apiculture and corporate environmental stewardship

14. Competitive Landscape

14.1 Overview

14.2

Overview on criticality of inputs and factors of differentiation

14.3 Landscape disruption

Overview on factors of disruption

14.4 Industry risks

Impact of key risks on business

15. Competitive Analysis

15.1 Companies profiled

Companies covered

15.2 Company ranking index

15.3 Market positioning of companies

Matrix on companies position and classification

15.4 Barkman Honey LLC

Barkman Honey LLC - Overview
Barkman Honey LLC - Product / Service
Barkman Honey LLC - Key offerings
SWOT

15.5 Bee Maid Honey Ltd.

Bee Maid Honey Ltd. - Overview
Bee Maid Honey Ltd. - Product / Service
Bee Maid Honey Ltd. - Key offerings
SWOT

15.6 Beedvine

Beedvine - Overview
Beedvine - Product / Service
Beedvine - Key offerings
SWOT

15.7 Capilano Honey Ltd.

Capilano Honey Ltd. - Overview
Capilano Honey Ltd. - Product / Service
Capilano Honey Ltd. - Key offerings
SWOT

15.8 Comvita Ltd.

Comvita Ltd. - Overview
Comvita Ltd. - Business segments
Comvita Ltd. - Key offerings
Comvita Ltd. - Segment focus
SWOT

15.9 Dabur India Ltd.

Dabur India Ltd. - Overview
Dabur India Ltd. - Business segments
Dabur India Ltd. - Key news
Dabur India Ltd. - Key offerings
Dabur India Ltd. - Segment focus
SWOT

15.10 Dutch Gold Honey Inc.

Dutch Gold Honey Inc. - Overview
Dutch Gold Honey Inc. - Product / Service
Dutch Gold Honey Inc. - Key offerings
SWOT

15.11 Heavenly Organics LLC

Heavenly Organics LLC - Overview
Heavenly Organics LLC - Product / Service
Heavenly Organics LLC - Key offerings
SWOT

15.12 Hive and Wellness Pty Ltd.

Hive and Wellness Pty Ltd. - Overview
Hive and Wellness Pty Ltd. - Product / Service
Hive and Wellness Pty Ltd. - Key offerings
SWOT

15.13 Organic India Pvt. Ltd.

Organic India Pvt. Ltd. - Overview
Organic India Pvt. Ltd. - Product / Service
Organic India Pvt. Ltd. - Key offerings
SWOT

15.14 Patanjali Ayurved Ltd.

Patanjali Ayurved Ltd. - Overview
Patanjali Ayurved Ltd. - Product / Service
Patanjali Ayurved Ltd. - Key offerings
SWOT

15.15 Savannah Bee Co.

Savannah Bee Co. - Overview
Savannah Bee Co. - Product / Service
Savannah Bee Co. - Key offerings
SWOT

15.16 Sioux Honey Association Crop.

Sioux Honey Association Crop. - Overview
Sioux Honey Association Crop. - Product / Service
Sioux Honey Association Crop. - Key offerings
SWOT

15.17 Valeo Foods Ltd.

Valeo Foods Ltd. - Overview
Valeo Foods Ltd. - Product / Service
Valeo Foods Ltd. - Key offerings
SWOT

15.18 Wedderspoon Organic Inc.

Wedderspoon Organic Inc. - Overview
Wedderspoon Organic Inc. - Product / Service
Wedderspoon Organic Inc. - Key offerings
SWOT

16. Appendix

16.1 Scope of the report

Market definition
Objectives
Notes and caveats

16.2 Inclusions and exclusions checklist

Inclusions checklist
Exclusions checklist

16.3 Currency conversion rates for US$

16.4 Research methodology

16.5 Data procurement

Information sources

16.6 Data validation

16.7 Validation techniques employed for market sizing

16.8 Data synthesis

16.9 360 degree market analysis

16.10 List of abbreviations

Research Methodology

Technavio presents a detailed picture of the market by way of study, synthesis, and summation of data from multiple sources. The analysts have presented the various facets of the market with a particular focus on identifying the key industry influencers. The data thus presented is comprehensive, reliable, and the result of extensive research, both primary and secondary.

INFORMATION SOURCES

Primary sources

  • Manufacturers and suppliers
  • Channel partners
  • Industry experts
  • Strategic decision makers

Secondary sources

  • Industry journals and periodicals
  • Government data
  • Financial reports of key industry players
  • Historical data
  • Press releases

DATA ANALYSIS

Data Synthesis

  • Collation of data
  • Estimation of key figures
  • Analysis of derived insights

Data Validation

  • Triangulation with data models
  • Reference against proprietary databases
  • Corroboration with industry experts

REPORT WRITING

Qualitative

  • Market drivers
  • Market challenges
  • Market trends
  • Five forces analysis

Quantitative

  • Market size and forecast
  • Market segmentation
  • Geographical insights
  • Competitive landscape

Interested in this report?

Get your sample now to see our research methodology and insights!

Download Now

Frequently Asked Questions

Organic Honey market growth will increase by USD 611.0 million during 2026-2030.

The Organic Honey market is expected to grow at a CAGR of 8.1% during 2026-2030.

Organic Honey market is segmented by Distribution channel (Offline, Online) Product (Mixed organic honey, Clover organic honey, Manuka organic honey, Others) End-user (Food and beverages, Healthcare, Cosmetics and personal care)

Barkman Honey LLC, Bee Maid Honey Ltd., Beedvine, Capilano Honey Ltd., Comvita Ltd., Conapi Sca, Dabur India Ltd., Dutch Gold Honey Inc., Glorybee Inc., Heavenly Organics LLC, Hive and Wellness Pty Ltd., New Zealand Honey Co., Organic India Pvt. Ltd., Patanjali Ayurved Ltd., Really Raw Honey, Savannah Bee Co., Sioux Honey Association Crop., Valeo Foods Ltd., Wedderspoon Organic Inc., Y.S. Organic Bee Farms are a few of the key vendors in the Organic Honey market.

Europe will register the highest growth rate of 42.1% among the other regions. Therefore, the Organic Honey market in Europe is expected to garner significant business opportunities for the vendors during the forecast period.

Germany, UK, France, Italy, Spain, The Netherlands, US, Canada, Mexico, China, Japan, India, South Korea, Australia, Indonesia, Brazil, Argentina, Chile, Saudi Arabia, UAE, South Africa, Israel, Turkey

  • Rising demand for natural and functional sweeteners is the driving factor this market.

The Organic Honey market vendors should focus on grabbing business opportunities from the Distribution channel segment as it accounted for the largest market share in the base year.
RIA - Research AI Assistant
Ask RIA