
People Counting System Market Size 2025-2029
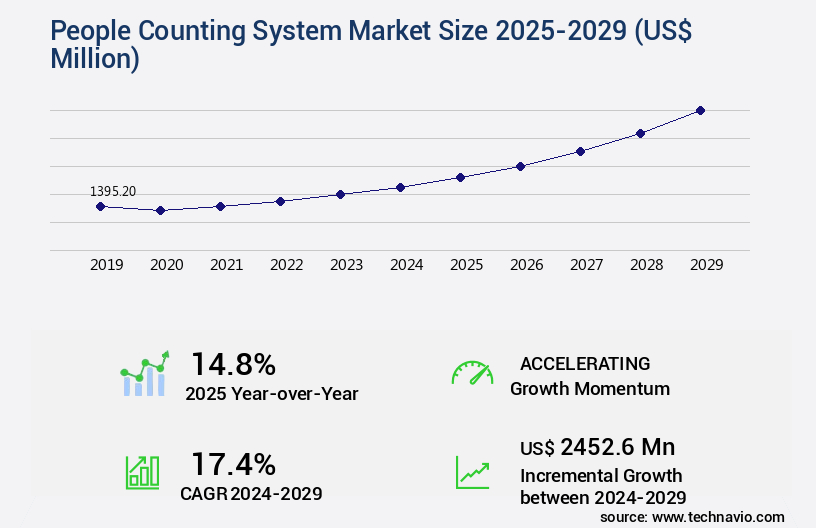
The people counting system market size is valued to increase USD 2.45 billion, at a CAGR of 17.4% from 2024 to 2029. Increasing developments in the global people counting system market will drive the people counting system market.
Major Market Trends & Insights
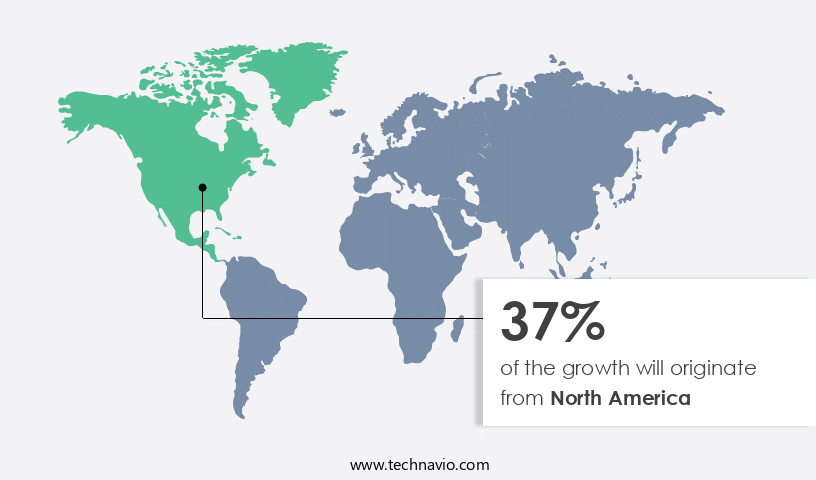
- North America dominated the market and accounted for a 37% growth during the forecast period.
- By Type - Bidirectional segment was valued at USD 830.20 billion in 2023
- By Technology - Video-based technology segment accounted for the largest market revenue share in 2023
Market Size & Forecast
- Market Opportunities: USD 218.97 million
- Market Future Opportunities: USD 2,452.60 million
- CAGR : 17.4%
- North America: Largest market in 2023
Market Summary
- The market is a dynamic and continuously evolving industry, driven by advancements in core technologies and applications. With the integration of 4D technology into video-based people counters, the market is witnessing significant growth. However, the effectiveness of video-based counters is being challenged by differential store metrics. According to recent studies, the video-based people counting systems market is projected to account for over 60% of the global market share by 2025. In addition, regulations such as GDPR and CCPA are influencing the adoption of privacy-preserving technologies in people counting systems.
- Smart retail and facility management are also driving demand for accurate and real-time people counting solutions. As the market unfolds, opportunities for innovation and growth are abundant, making it an exciting space to watch in the coming years.
What will be the Size of the People Counting System Market during the forecast period?
Get Key Insights on Market Forecast (PDF) Request Free Sample
How is the People Counting System Market Segmented and what are the key trends of market segmentation?
The people counting system industry research report provides comprehensive data (region-wise segment analysis), with forecasts and estimates in "USD million" for the period 2025-2029, as well as historical data from 2019-2023 for the following segments.
- Type
- Bidirectional
- Unidirectional
- Technology
- Video-based technology
- Infrared beam
- Thermal imaging
- Others
- Application
- Hardware
- Software
- Geography
- North America
- US
- Canada
- Europe
- France
- Germany
- UK
- APAC
- China
- India
- Japan
- South America
- Brazil
- Rest of World (ROW)
- North America
By Type Insights
The bidirectional segment is estimated to witness significant growth during the forecast period.
The market is experiencing substantial expansion, with bidirectional segmented systems showing remarkable growth. Currently, retail analytics, queue management, staff optimization, and space utilization applications account for a significant market share. Bidirectional systems provide enhanced capabilities, enabling the identification of visitor direction and accurate counting of individuals on specific floors or zones. This segment's growth can be attributed to its advantages, including improved accuracy and valuable insights for end-users. Computer vision, conversion rate optimization, occupancy detection, density monitoring, spatial analytics, data aggregation, store layout optimization, object detection, and crowd density are integral components of people counting systems. These technologies facilitate visitor tracking, people counting, area segmentation, video analytics, motion detection, real-time data, and dwell time analysis.
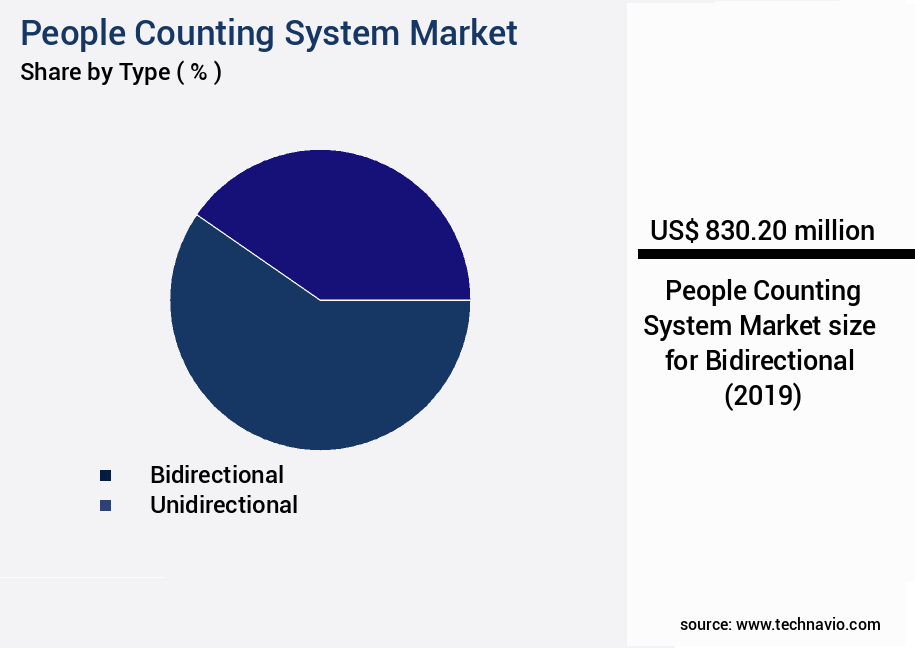
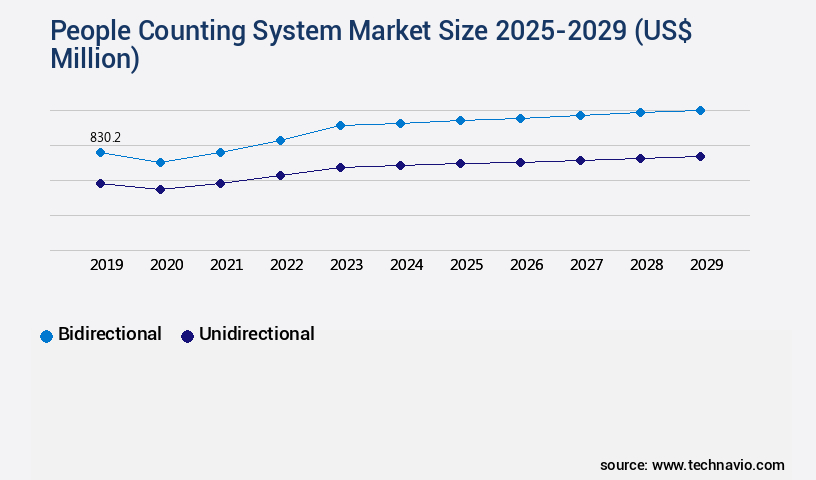
The Bidirectional segment was valued at USD 830.20 billion in 2019 and showed a gradual increase during the forecast period.
Deep learning models and machine learning algorithms, along with pattern recognition, are employed to optimize performance and ensure high accuracy. Future industry growth is expected to be robust, with a focus on enhancing customer traffic monitoring, footfall analytics, and 3D depth cameras. Infrared sensors, image processing, sensor fusion, and heat mapping are also gaining popularity due to their ability to provide real-time data and insights. The integration of these advanced technologies is transforming the market landscape and enabling businesses to make data-driven decisions. Market trends indicate a continuous evolution, with ongoing research and development in the areas of people tracking, queue management, and staff optimization.
The integration of AI and machine learning algorithms is expected to further enhance the capabilities of people counting systems, providing valuable insights for businesses and improving overall operational efficiency.
Regional Analysis
North America is estimated to contribute 37% to the growth of the global market during the forecast period. Technavio's analysts have elaborately explained the regional trends and drivers that shape the market during the forecast period.
See How People Counting System Market Demand is Rising in North America Request Free Sample
The market in North America is experiencing steady growth, driven by the presence of technologically advanced retail stores and shopping malls, stadiums, banks, and amusement parks in the US and Canada. The market's expansion is fueled by the increasing demand for visitor counting and tracking solutions in numerous airports. With key players like InfraRed Integrated Systems, RetailNext, and Teledyne headquartered in North America, the region is expected to dominate the global market. Approximately 60% of the North American market share is held by the US, with Canada accounting for the remaining 40%.
The adoption rate of people counting systems in the US retail sector is increasing due to significant investment in the industry. According to recent studies, over 50% of major retailers in the US have already implemented people counting technology. Additionally, around 30 airports in North America have integrated people counting systems, contributing to a significant market share.
Market Dynamics
Our researchers analyzed the data with 2024 as the base year, along with the key drivers, trends, and challenges. A holistic analysis of drivers will help companies refine their marketing strategies to gain a competitive advantage.
The market is experiencing significant growth as businesses seek to enhance operational efficiency and customer experience through accurate data analysis. Infrared sensors and 3D cameras are increasingly being used for people counting, providing real-time occupancy detection and heat mapping for retail store optimization. This data is transforming the way retailers make data-driven decisions, from improving staff deployment and queue management to optimizing store layouts and predicting crowd density. The use of people counting systems extends beyond retail, with applications in enhancing security through real-time visitor tracking and analyzing customer traffic for better decision-making. Customer journey analysis is also gaining popularity, allowing businesses to understand customer behavior and preferences through video analytics.
Sensor fusion is a key technology driving innovation in the market, enabling reliable occupancy data and improving resource allocation. The use of sensor data for business insights generation is also on the rise, with predictive analytics for crowd density management and analyzing customer dwell time for store optimization. Compared to traditional methods, people counting systems using infrared sensors and 3D cameras offer higher accuracy and real-time data. For instance, a study found that infrared sensors can count people with an accuracy of up to 98%, while manual headcounts have an error rate of up to 20%. This level of accuracy translates into improved conversion rates, effective use of resources, and enhanced customer experience.
The market is poised for continued growth as businesses seek to gain valuable insights from accurate people data. From retail optimization and customer experience to security and resource allocation, the applications of people counting systems are vast and far-reaching. By leveraging advanced technologies like sensor fusion and video analytics, businesses can make data-driven decisions that drive operational efficiency and growth.
What are the key market drivers leading to the rise in the adoption of People Counting System Industry?
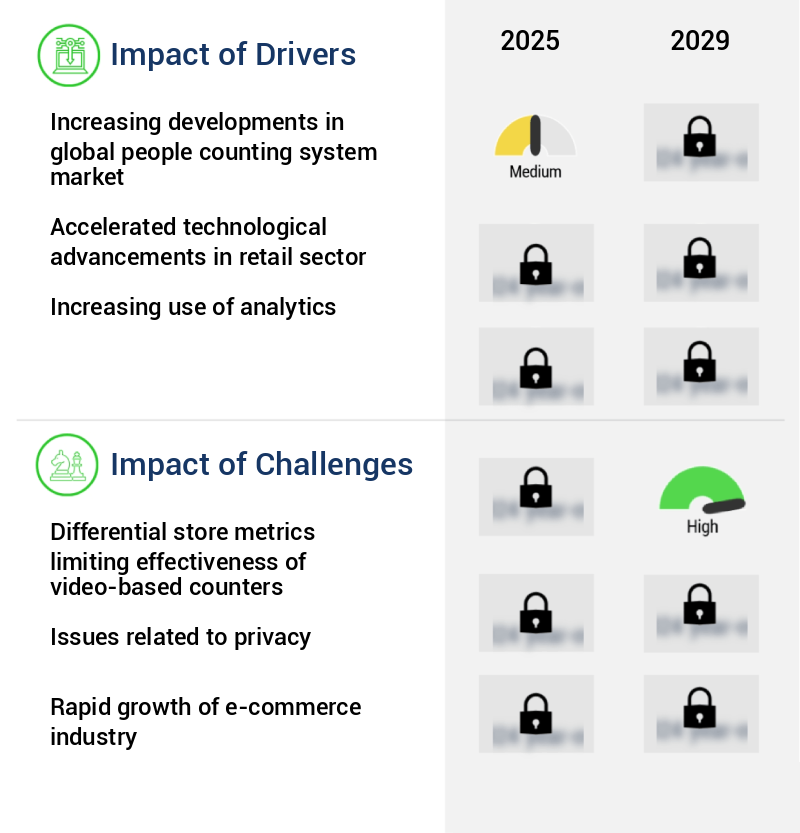
- The continuous advancements in global people counting technology are the primary catalyst fueling market growth in this sector.
- The market is experiencing a significant surge in innovation, driven by an increasing number of new product launches. These developments cater to the growing demand from various sectors, including retail, healthcare, and hospitality, among others. The influx of new solutions motivates end-users to invest in advanced people counting systems, thereby fueling market growth. Competition among market participants is intensifying due to the rising number of new entrants, leading to continuous innovation and differentiation. This dynamic market environment is expected to create opportunities for companies to expand their offerings and cater to diverse customer needs. Moreover, the integration of advanced technologies, such as artificial intelligence (AI) and machine learning, into people counting systems is gaining momentum.
- These technologies enable more accurate and efficient people counting, offering valuable insights for businesses to optimize their operations and enhance customer experiences. The market's continuous evolution reflects its potential to address the evolving needs of various industries, making it an essential component of modern business infrastructure.
What are the market trends shaping the People Counting System Industry?
- The integration of 4D technology is becoming a trend in video-based people counting systems. Four-dimensional technology is increasingly being adopted in the design of advanced people counter systems.
- People counting systems, which include 2D and 3D variants, have become essential tools in various industries such as retail, transportation, hospitality, and healthcare. These systems help businesses optimize operations, enhance customer experiences, and make data-driven decisions. 2D people counting systems, based on monocular single-lens devices, function effectively in low-traffic, well-lit environments. Their accuracy ranges between 80 and 95%. In contrast, 3D people counters employ stereoscopic vision and collaborate with Wi-Fi or Bluetooth technologies to ensure high precision and visitor monitoring. These systems maintain an accuracy level above 95% in high-traffic settings. The emergence of 4D people counting systems signifies a significant advancement in this field.
- These systems combine 3D data with time series analysis, enabling more accurate and comprehensive insights. This innovation offers end-user industries a valuable opportunity to improve visitor monitoring and gain a deeper understanding of their customers' behavior patterns. Incorporating numerical data, 2D people counting systems can achieve an accuracy range of 80-95%, while 3D systems can maintain over 95% accuracy in heavy traffic. The introduction of 4D systems presents an opportunity for even more precise and insightful people counting solutions.
What challenges does the People Counting System Industry face during its growth?
- The limitation of differential store metrics in effectively measuring video-based counter data represents a significant challenge to the industry's growth trajectory.
- Video-based people counting technology has gained significant traction in various industries due to its accuracy and accessibility. These systems utilize 2D, 3D, and 4D technologies to cover extensive areas, with HELLA Aglaia Mobile Vision GmbH's APS-180E reaching up to 6,114 sq. Ft with optical sensor fusion. However, video-based counters face challenges in regions with differential storage metrics, such as those with shadows, complex backdrops, or fluctuating light levels.
- Despite these limitations, video-based people counting technology continues to evolve, offering businesses valuable insights into foot traffic and customer behavior. This technology's ongoing advancements enable more accurate and comprehensive data collection, making it an essential tool for businesses seeking to optimize operations and enhance customer experiences.
Exclusive Customer Landscape
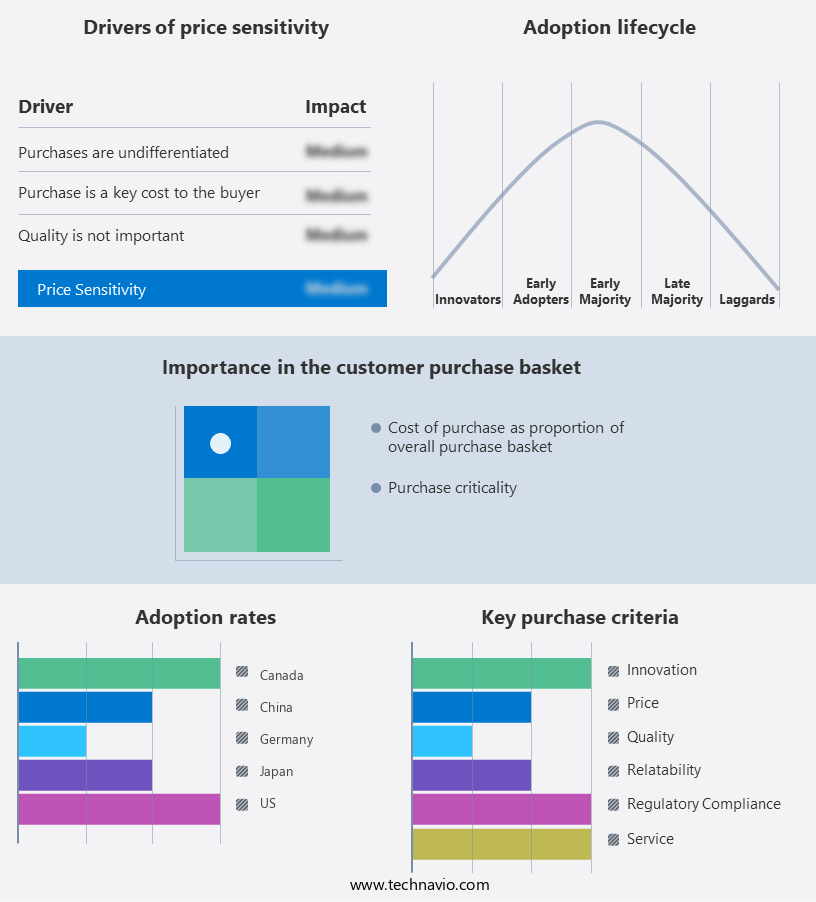
The people counting system market forecasting report includes the adoption lifecycle of the market, covering from the innovator's stage to the laggard's stage. It focuses on adoption rates in different regions based on penetration. Furthermore, the people counting system market report also includes key purchase criteria and drivers of price sensitivity to help companies evaluate and develop their market growth analysis strategies.
Customer Landscape of People Counting System Industry
Competitive Landscape & Market Insights
Companies are implementing various strategies, such as strategic alliances, people counting system market forecast, partnerships, mergers and acquisitions, geographical expansion, and product/service launches, to enhance their presence in the industry.
Axiomatic Technology Ltd. - The company specializes in people counting solutions, providing valuable insights into population dynamics in various settings.
The industry research and growth report includes detailed analyses of the competitive landscape of the market and information about key companies, including:
- Axiomatic Technology Ltd.
- Axis Communications AB
- DILAX Intelcom GmbH
- Dor Technologies Inc.
- EUROTECH Spa
- FootfallCam
- Fortive Corp.
- Gigabyte Technology Co. Ltd.
- Hangzhou Hikvision Digital Technology Co. Ltd.
- HELLA GmbH and Co. KGaA
- iris GmbH infrared and intelligent sensors
- Johnson Controls International Plc
- Koninklijke Philips NV
- RetailNext Inc.
- Robert Bosch GmbH
- SensMax LTD.
- Teledyne Technologies Inc.
- Traf Sys Inc.
- VCount Inc.
- VIVOTEK Inc.
Qualitative and quantitative analysis of companies has been conducted to help clients understand the wider business environment as well as the strengths and weaknesses of key industry players. Data is qualitatively analyzed to categorize companies as pure play, category-focused, industry-focused, and diversified; it is quantitatively analyzed to categorize companies as dominant, leading, strong, tentative, and weak.
Recent Development and News in People Counting System Market
- In January 2024, global technology leader, Honeywell, announced the launch of its new People Counting System, "Intelligrated WC100," designed to enhance workplace safety and efficiency through advanced AI and machine learning algorithms (Honeywell Press Release, 2024).
- In March 2024, tech giants Microsoft and Intel partnered to integrate Microsoft's Azure AI capabilities with Intel's People Counting Solution, creating a more robust and scalable offering for businesses worldwide (Microsoft News Center, 2024).
- In April 2025, leading security and safety solutions provider, Bosch, acquired German tech firm, Sensolus, to expand its portfolio and strengthen its position in the market (Bosch Press Release, 2025).
- In May 2025, the European Union passed the "Workplace Safety Regulation," mandating the implementation of People Counting Systems in all workplaces with more than 50 employees to ensure social distancing and prevent the spread of infectious diseases (EU Parliament Press Release, 2025).
Dive into Technavio's robust research methodology, blending expert interviews, extensive data synthesis, and validated models for unparalleled People Counting System Market insights. See full methodology.
|
Market Scope |
|
|
Report Coverage |
Details |
|
Page number |
219 |
|
Base year |
2024 |
|
Historic period |
2019-2023 |
|
Forecast period |
2025-2029 |
|
Growth momentum & CAGR |
Accelerate at a CAGR of 17.4% |
|
Market growth 2025-2029 |
USD 2452.6 million |
|
Market structure |
Fragmented |
|
YoY growth 2024-2025(%) |
14.8 |
|
Key countries |
US, China, Japan, Germany, Canada, India, Saudi Arabia, Brazil, UK, and France |
|
Competitive landscape |
Leading Companies, Market Positioning of Companies, Competitive Strategies, and Industry Risks |
Research Analyst Overview
- In the dynamic and evolving world of business intelligence, the market for people counting systems continues to gain momentum. This market encompasses a range of technologies, including computer vision, conversion rate optimization, occupancy detection, density monitoring, spatial analytics, data aggregation, and more. Computer vision plays a pivotal role in people counting systems, enabling object detection, crowd density estimation, and visitor tracking. Conversion rate optimization is another key application, as businesses seek to optimize store layouts and improve customer traffic monitoring. Deep learning models and machine learning algorithms power these systems, enabling pattern recognition and real-time data processing.
- People counting software also incorporates queue management, people tracking, area segmentation, and video analytics. Motion detection and dwell time analysis are essential components, providing valuable insights into customer behavior and staff optimization. Data visualization and retail analytics further enhance the value of these systems, enabling businesses to make data-driven decisions. The market for people counting systems is characterized by ongoing innovation, with advancements in technology driving increased adoption. Three-dimensional depth cameras, infrared sensors, image processing, and sensor fusion are among the latest technologies shaping this market. Heat mapping and footfall analytics are also gaining popularity, offering valuable insights into customer behavior and business performance.
- Overall, the market represents a significant opportunity for businesses seeking to optimize operations, enhance customer experiences, and gain valuable insights into customer behavior. With continuous innovation and advancements in technology, this market is poised for continued growth and evolution.
What are the Key Data Covered in this People Counting System Market Research and Growth Report?
-
What is the expected growth of the People Counting System Market between 2025 and 2029?
-
USD 2.45 billion, at a CAGR of 17.4%
-
-
What segmentation does the market report cover?
-
The report segmented by Type (Bidirectional and Unidirectional), Technology (Video-based technology, Infrared beam, Thermal imaging, and Others), Application (Hardware and Software), and Geography (North America, APAC, Europe, Middle East and Africa, and South America)
-
-
Which regions are analyzed in the report?
-
North America, APAC, Europe, Middle East and Africa, and South America
-
-
What are the key growth drivers and market challenges?
-
Increasing developments in global people counting system market, Differential store metrics limiting effectiveness of video-based counters
-
-
Who are the major players in the People Counting System Market?
-
Key Companies Axiomatic Technology Ltd., Axis Communications AB, DILAX Intelcom GmbH, Dor Technologies Inc., EUROTECH Spa, FootfallCam, Fortive Corp., Gigabyte Technology Co. Ltd., Hangzhou Hikvision Digital Technology Co. Ltd., HELLA GmbH and Co. KGaA, iris GmbH infrared and intelligent sensors, Johnson Controls International Plc, Koninklijke Philips NV, RetailNext Inc., Robert Bosch GmbH, SensMax LTD., Teledyne Technologies Inc., Traf Sys Inc., VCount Inc., and VIVOTEK Inc.
-
Market Research Insights
- The market encompasses technologies that deliver accurate measurement of foot traffic in real-time, providing businesses with valuable data streams for privacy-preserving analytics. Performance metrics dashboards offer data-driven insights into customer behavior, enabling businesses to optimize queue length prediction, access control systems, and traffic flow. Robust algorithms ensure reliable data, while user-friendly interfaces simplify system maintenance. Anonymized data processing maintains data security, and scalable systems accommodate growing businesses. Integration capabilities extend functionality, incorporating security surveillance and business intelligence. Infrared sensor technology guarantees efficient processing, and heatmaps generation offer valuable occupancy management system information.
- ROI calculation is a key performance indicator, highlighting the value of these systems. Privacy-preserving analytics and data security are essential considerations in this evolving market. Two notable performance metrics reveal the potential impact: a 15% increase in sales for businesses using people counting systems, and a 20% reduction in queue wait times.
We can help! Our analysts can customize this people counting system market research report to meet your requirements.
 RIA -
RIA - 
