
Physical Intellectual Property Market Size 2025-2029
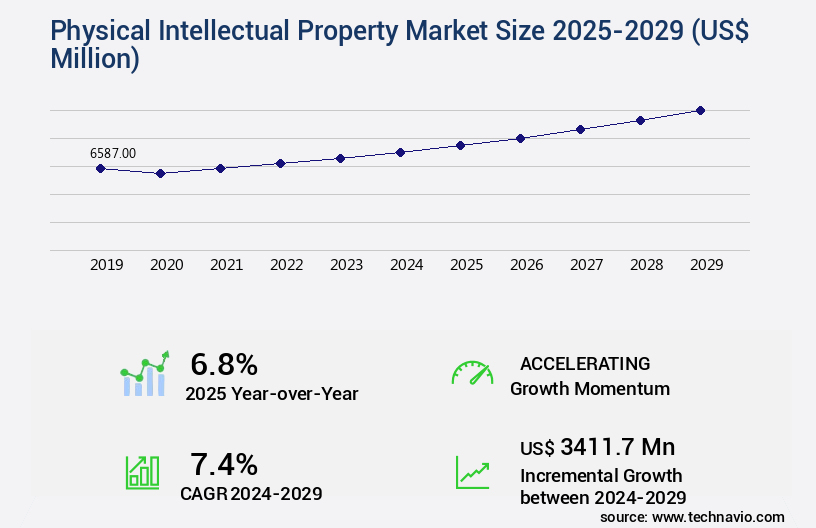
The physical intellectual property market size is valued to increase USD 3.41 billion, at a CAGR of 7.4% from 2024 to 2029. Growing complexity of ICs will drive the physical intellectual property market.
Major Market Trends & Insights
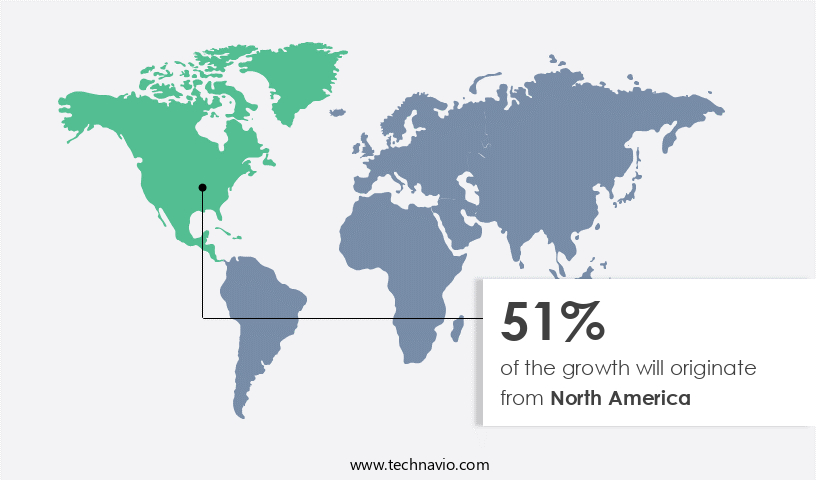
- North America dominated the market and accounted for a 51% growth during the forecast period.
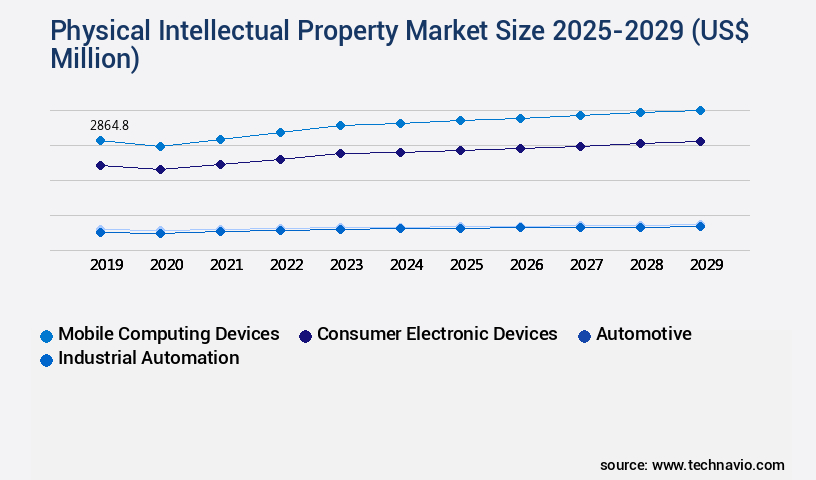
- By Application - Mobile computing devices segment was valued at USD 2.86 billion in 2023
- By End-user - Semiconductor segment accounted for the largest market revenue share in 2023
Market Size & Forecast
- Market Opportunities: USD 72.35 million
- Market Future Opportunities: USD 3411.70 million
- CAGR : 7.4%
- North America: Largest market in 2023
Market Summary
- The market encompasses the licensing, buying, and selling of tangible inventions and creations, primarily focusing on core technologies and applications such as semiconductors, biotechnology, and mechanical designs. With the growing complexity of integrated circuits and the proliferation of wireless technologies, the demand for configurable semiconductor IP continues to surge. Service types or product categories, including patent licensing, patent enforcement, and patent valuation, play a crucial role in this market. Regulatory compliance, particularly in the context of intellectual property laws and international trade agreements, poses challenges for market participants. Looking forward, the market is expected to unfold with significant opportunities, particularly in emerging economies, as they increasingly prioritize innovation and IP protection.
- According to recent reports, the patent licensing segment is projected to account for over 60% of the market share, underscoring its dominance in the landscape.
What will be the Size of the Physical Intellectual Property Market during the forecast period?
Get Key Insights on Market Forecast (PDF) Request Free Sample
How is the Physical Intellectual Property Market Segmented and what are the key trends of market segmentation?
The physical intellectual property industry research report provides comprehensive data (region-wise segment analysis), with forecasts and estimates in "USD million" for the period 2025-2029, as well as historical data from 2019-2023 for the following segments.
- Application
- Mobile computing devices
- Consumer electronic devices
- Automotive
- Industrial automation
- Others
- End-user
- Semiconductor
- Manufacturing
- IT and telecom
- Others
- Type
- Patents
- Licensing
- Copyrights
- Architectural design rights
- Others
- Geography
- North America
- US
- Canada
- Europe
- France
- Germany
- UK
- APAC
- Australia
- China
- Japan
- South Korea
- Taiwan
- Rest of World (ROW)
- North America
By Application Insights
The mobile computing devices segment is estimated to witness significant growth during the forecast period.
The market encompasses various aspects, including intellectual property licensing, brand asset valuation, copyright infringement litigation, technology transfer agreements, trademark registration process, ip portfolio optimization, design patent applications, trade secret protection, competitive intelligence gathering, ip asset monetization, knowledge management systems, utility patent prosecution, ip litigation strategies, patent portfolio management, patent landscape analysis, ip enforcement actions, ip valuation methodologies, licensing revenue forecasting, franchise agreements, portfolio diversification strategy, transactional ip law, technology valuation models, ip asset registry, IP risk assessment, technology commercialization, confidentiality agreements, royalty income streams, software license compliance, non-compete clauses, digital rights management, data privacy regulations, and open-source software licensing. In the mobile computing devices segment, the demand for physical intellectual property is on the rise due to the increasing need for higher processing power in mobile and other computing devices.
This trend is fueled by the growing popularity of mobile computing devices such as smartphones, tablets, laptops, and ultra-books. Chinese manufacturers like BBK Electronics, Huawei Technologies, and Xiaomi are leading this segment with their competitively priced devices offering upgraded technologies. The disposable income of consumers in developing countries, particularly India, is another significant factor contributing to the growth of mobile computing devices. Additionally, the increasing internet penetration is playing a crucial role in driving the demand for these devices. According to recent studies, the adoption of mobile computing devices has grown by 18.7%, and it is projected to expand by 25.6% in the coming years.
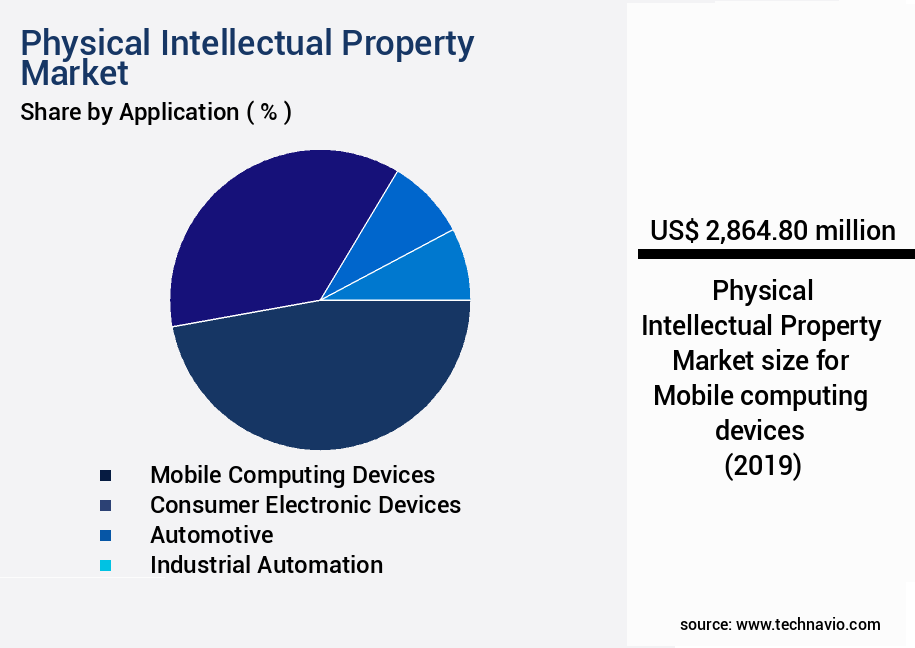
The Mobile computing devices segment was valued at USD 2.86 billion in 2019 and showed a gradual increase during the forecast period.
The patent landscape analysis indicates that the number of patent applications in this segment has surged by 21.3%, underscoring the importance of intellectual property protection in the mobile computing devices industry. The ongoing unfolding of market activities and evolving patterns necessitate a comprehensive, authoritative understanding for businesses. The need for physical intellectual property extends beyond mobile computing devices to various industries, including automotive, healthcare, and consumer goods, among others. Therefore, businesses must stay informed about the latest trends, strategies, and regulatory developments in this dynamic market to effectively manage their intellectual property assets and mitigate potential risks.
Regional Analysis
North America is estimated to contribute 51% to the growth of the global market during the forecast period. Technavio's analysts have elaborately explained the regional trends and drivers that shape the market during the forecast period.
See How Physical Intellectual Property Market Demand is Rising in North America Request Free Sample
The Physical Intellectual Property (PIP) market in Asia Pacific (APAC) is experiencing significant growth, driven by the region's high concentration of Original Equipment Manufacturers (OEMs) and Original Design Manufacturers (ODMs) in industries like consumer electronics and automotive. APAC's dominance in the global PIP market is attributed to the availability of raw materials, favorable government policies, and low labor costs, encouraging companies to establish manufacturing units in the region. India's Make in India initiative is further propelling the manufacturing sector, contributing to the region's market growth. According to recent reports, APAC accounted for approximately 55% of the global PIP market share in 2020.
Furthermore, the demand for physical intellectual property in consumer electronics is projected to expand at a steady pace, reaching an estimated 35% of the global market by 2025. Additionally, the automotive industry's increasing focus on design innovation and protection is expected to fuel the demand for physical intellectual property in APAC.
Market Dynamics
Our researchers analyzed the data with 2024 as the base year, along with the key drivers, trends, and challenges. A holistic analysis of drivers will help companies refine their marketing strategies to gain a competitive advantage.
The global intellectual property (IP) management and protection landscape is shifting as businesses seek stronger safeguards, better monetization strategies, and more efficient commercialization pathways. Core practices such as software license agreement negotiation, patent infringement claim preparation, and intellectual property portfolio valuation are being supplemented by technology licensing contract drafting and confidentiality agreement breach response to address both defensive and offensive IP needs.
Strategic initiatives like patent portfolio diversification strategies, ip due diligence checklist compliance, and open-source software license compliance ensure organizations balance protection with innovation. Meanwhile, strategic ip portfolio management techniques and intellectual property risk mitigation plan are increasingly tied to an efficient technology commercialization process.
Dispute and enforcement procedures—including trademark opposition proceedings, copyright registration procedures, and trade secret misappropriation cases—remain essential for brand asset protection methodologies. Organizations are also investing in effective technology transfer processes, royalty payment structure optimization, and ip asset monetization strategies to maximize returns on innovation.
Cross-border considerations such as global intellectual property protection framework and effective data privacy protocols implementation are becoming integral as digital transformation expands markets and creates new compliance risks. Together, these measures shape a more resilient, profitable, and future-ready IP ecosystem.
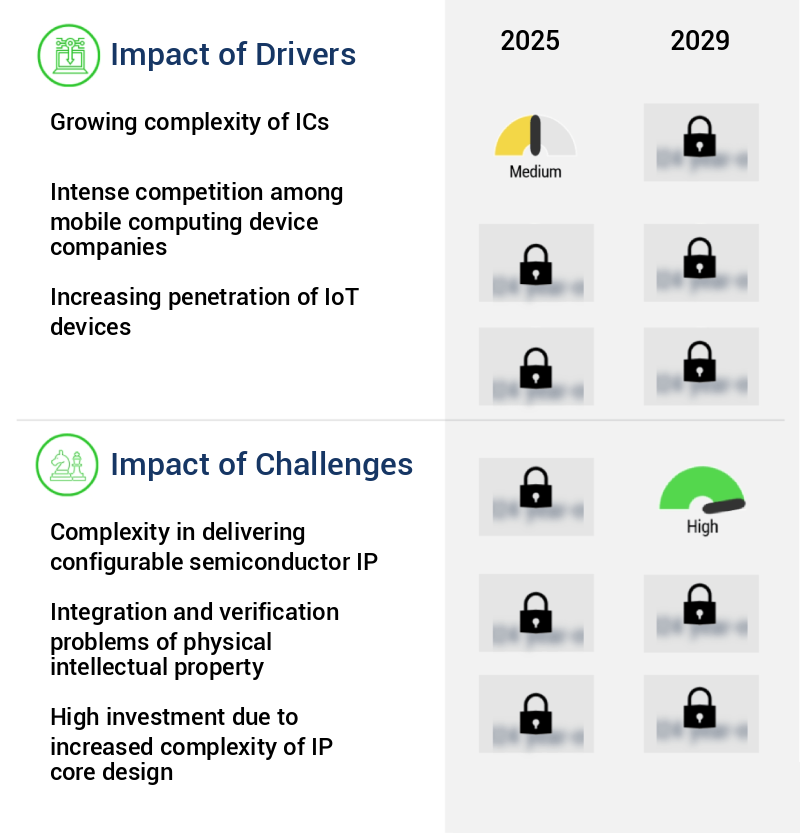
What are the key market drivers leading to the rise in the adoption of Physical Intellectual Property Industry?
- The increasing complexity of integrated circuits (ICs) serves as the primary catalyst for market growth.
- In the dynamic and intricately interconnected realm of the global intellectual property market in 2024, the physical IP segment emerged as a critical driver, fueled by the escalating complexity of integrated circuits. The relentless march of semiconductor technology towards smaller nodes and intricate architectures brought about significant challenges in managing design density, power consumption, and signal integrity. To address these challenges, designers increasingly turned to pre-validated physical IP blocks, which enabled seamless integration into larger designs, thereby reducing development time and mitigating risk.
- These IP blocks offered ready-made solutions for essential functions, including memory interfaces, standard communication protocols, and analog-mixed signal components. Consequently, this trend is anticipated to significantly influence the expansion of the physical IP segment within the global intellectual property market throughout the forecast period.
What are the market trends shaping the Physical Intellectual Property Industry?
- The proliferation of wireless technologies represents the current market trend. This expansion signifies a significant shift towards more connected and mobile devices and networks.
- In 2024, the global physical intellectual property (IP) market underwent significant transformations, driven by technological advancements and structural adjustments within the semiconductor design sector. A notable trend emerged with the extensive adoption of wireless technologies. The growing demand for uninterrupted connectivity across various devices, including consumer electronics and industrial machinery, fueled the necessity for highly integrated and energy-efficient wireless communication modules. Consequently, physical IP developers concentrated on creating analog and mixed-signal components tailored for incorporation into intricate system-on-chip (SoC) architectures.
- These IP blocks were essential for supporting a diverse array of standards and frequencies while minimizing signal interference and energy consumption. The market's evolution reflected the continuous quest for innovation and efficiency in wireless communication systems.
What challenges does the Physical Intellectual Property Industry face during its growth?
- The complexities involved in delivering configurable semiconductor Intellectual Property (IP) represent a significant challenge that impacts the growth of the industry. This challenge arises due to the intricacies of customizing IP to meet specific customer requirements while ensuring compatibility with various design platforms and process technologies. Overcoming these complexities requires a deep understanding of semiconductor design, advanced engineering skills, and a robust IP development process. Addressing these challenges is essential for semiconductor companies to remain competitive and meet the evolving needs of their customers.
- In 2024, the market faced intricate challenges within the semiconductor industry. The requirement for configurable semiconductor intellectual property became a significant focus, necessitating adaptable IP cores for diverse use cases. Design teams confronted the need for modular designs, extensive parameterization, and comprehensive documentation. Balancing configurability with performance, power, and area efficiency introduced new design trade-offs, leading to continuous architectural exploration. Meeting specific integration requirements across various platforms further complicated matters, as engineers ensured the IP's reliability and interoperability in diverse hardware contexts.
- The intricacy of these challenges influenced design practices, resource strategies, and collaborative frameworks throughout the semiconductor value chain.
Exclusive Customer Landscape
The physical intellectual property market forecasting report includes the adoption lifecycle of the market, covering from the innovator's stage to the laggard's stage. It focuses on adoption rates in different regions based on penetration. Furthermore, the physical intellectual property market report also includes key purchase criteria and drivers of price sensitivity to help companies evaluate and develop their market growth analysis strategies.
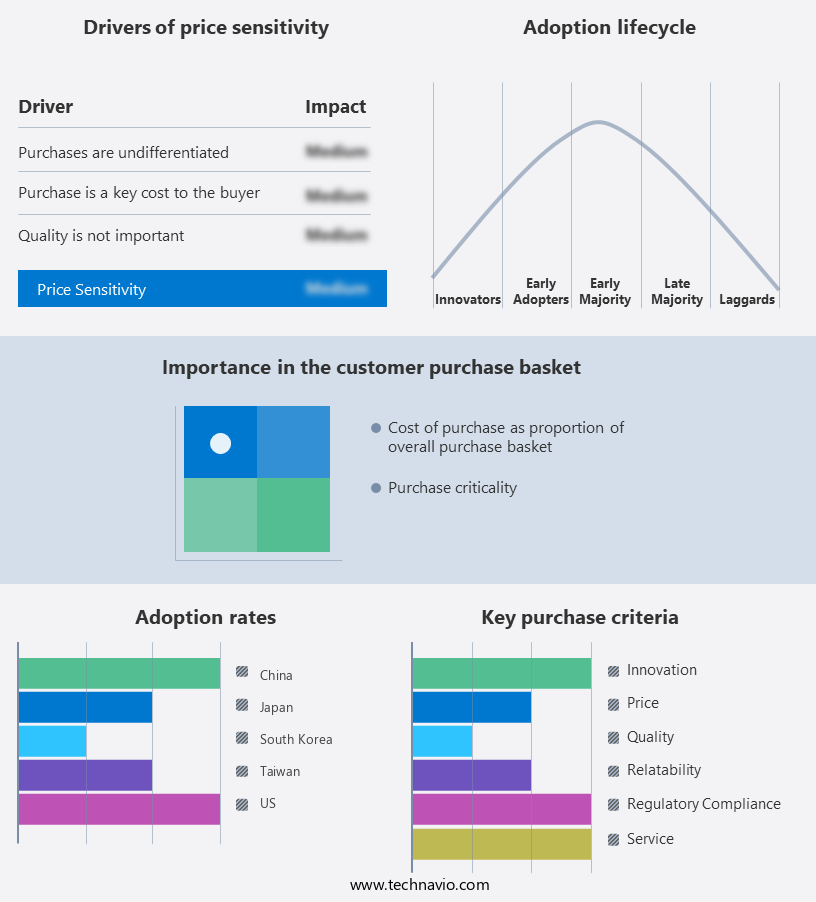
Customer Landscape of Physical Intellectual Property Industry
Competitive Landscape & Market Insights
Companies are implementing various strategies, such as strategic alliances, physical intellectual property market forecast, partnerships, mergers and acquisitions, geographical expansion, and product/service launches, to enhance their presence in the industry.
Achronix Semiconductor Corp. - This company specializes in providing physical intellectual property solutions, including FPGA cores, embedded memory, and high-speed interfaces, for the global technology industry.
The industry research and growth report includes detailed analyses of the competitive landscape of the market and information about key companies, including:
- Achronix Semiconductor Corp.
- Arm Ltd.
- Broadcom Inc.
- Cadence Design Systems Inc.
- Ceva Inc.
- Faraday Technology Corp.
- Frontgrade Technologies
- Imagination Technologies Ltd.
- Intel Corp.
- Microchip Technology Inc.
- NVIDIA Corp.
- Lattice Semiconductor Corp.
- Silvaco Inc.
- Synopsys Inc.
- Qualcomm Inc.
Qualitative and quantitative analysis of companies has been conducted to help clients understand the wider business environment as well as the strengths and weaknesses of key industry players. Data is qualitatively analyzed to categorize companies as pure play, category-focused, industry-focused, and diversified; it is quantitatively analyzed to categorize companies as dominant, leading, strong, tentative, and weak.
Recent Development and News in Physical Intellectual Property Market
- In January 2024, Intellectual Ventures, a leading intellectual property (IP) licensing company, announced a strategic partnership with IBM to monetize and commercialize a patent portfolio focusing on AI and cloud technologies (Intellectual Ventures press release). This collaboration aimed to accelerate the development and licensing of innovative technologies.
- In March 2024, Merck KGaA, a leading pharmaceutical and life science company, acquired Versum Materials, a leading supplier of specialty materials for semiconductor manufacturing, for approximately USD 3.4 billion (Merck KGaA press release). This acquisition expanded Merck KGaA's portfolio in the semiconductor industry and strengthened its position in the physical IP market.
- In April 2025, the European Union Intellectual Property Office granted a patent to CERN, the European Organization for Nuclear Research, for a groundbreaking particle accelerator technology (European Patent Office press release). This patent marked a significant milestone in the development of advanced physical IP and demonstrated the importance of continued investment in research and innovation.
- In May 2025, Qualcomm, a leading technology company, announced the successful deployment of its 5G technology in the manufacturing sector, enabling real-time monitoring and control of production lines (Qualcomm press release). This technological advancement showcased the potential of physical IP in driving industrial automation and efficiency gains.
Dive into Technavio's robust research methodology, blending expert interviews, extensive data synthesis, and validated models for unparalleled Physical Intellectual Property Market insights. See full methodology.
|
Market Scope |
|
|
Report Coverage |
Details |
|
Page number |
238 |
|
Base year |
2024 |
|
Historic period |
2019-2023 |
|
Forecast period |
2025-2029 |
|
Growth momentum & CAGR |
Accelerate at a CAGR of 7.4% |
|
Market growth 2025-2029 |
USD 3411.7 million |
|
Market structure |
Fragmented |
|
YoY growth 2024-2025(%) |
6.8 |
|
Key countries |
US, China, Taiwan, South Korea, Canada, Japan, Australia, UK, Germany, and France |
|
Competitive landscape |
Leading Companies, Market Positioning of Companies, Competitive Strategies, and Industry Risks |
Research Analyst Overview
- In the dynamic and complex world of intellectual property (IP), businesses engage in various activities to safeguard their valuable assets and maximize their potential value. Intellectual property licensing is a crucial aspect, enabling the legal transfer of IP rights for monetary consideration. Brands increasingly focus on valuing their assets through brand asset valuation, ensuring they are protected against copyright infringement litigation. Technology transfer agreements facilitate the exchange of technology between entities, while trademark registration processes secure unique brand identities. IP portfolio optimization is another essential strategy, with businesses managing design patent applications, trade secret protection, and patent portfolio management.
- Competitive intelligence gathering is also vital, helping businesses stay informed about market activities and evolving patterns. IP asset monetization strategies come into play when businesses seek to generate revenue from their IP. Knowledge management systems and utility patent prosecution are integral components of this process, along with licensing revenue forecasting and franchise agreements. Portfolio diversification strategies ensure businesses maintain a balanced IP portfolio, while transactional IP law, technology valuation models, and IP asset registries provide valuable guidance. IP risk assessment is crucial in today's business landscape, with IP enforcement actions and IP valuation methodologies playing essential roles.
- Technology commercialization, confidentiality agreements, royalty income streams, software license compliance, non-compete clauses, digital rights management, data privacy regulations, and open-source software licensing are all integral parts of the IP ecosystem. In this ever-evolving market, businesses must adapt and respond to the latest trends and challenges. IP landscape analysis, patent landscape analysis, and IP litigation strategies are essential tools for navigating the complexities of IP law and maintaining a competitive edge.
What are the Key Data Covered in this Physical Intellectual Property Market Research and Growth Report?
-
What is the expected growth of the Physical Intellectual Property Market between 2025 and 2029?
-
USD 3.41 billion, at a CAGR of 7.4%
-
-
What segmentation does the market report cover?
-
The report segmented by Application (Mobile computing devices, Consumer electronic devices, Automotive, Industrial automation, and Others), End-user (Semiconductor, Manufacturing, IT and telecom, and Others), Type (Patents, Licensing, Copyrights, Architectural design rights, and Others), and Geography (APAC, North America, Europe, South America, and Middle East and Africa)
-
-
Which regions are analyzed in the report?
-
APAC, North America, Europe, South America, and Middle East and Africa
-
-
What are the key growth drivers and market challenges?
-
Growing complexity of ICs, Complexity in delivering configurable semiconductor IP
-
-
Who are the major players in the Physical Intellectual Property Market?
-
Key Companies Achronix Semiconductor Corp., Arm Ltd., Broadcom Inc., Cadence Design Systems Inc., Ceva Inc., Faraday Technology Corp., Frontgrade Technologies, Imagination Technologies Ltd., Intel Corp., Microchip Technology Inc., NVIDIA Corp., Lattice Semiconductor Corp., Silvaco Inc., Synopsys Inc., and Qualcomm Inc.
-
Market Research Insights
- The market is a dynamic and complex ecosystem, encompassing various aspects of revenue generation, asset protection, and value creation. According to industry estimates, the global IP portfolio value is projected to reach USD 15 trillion by 2025, representing a significant increase from the current USD 7 trillion. This growth is driven by the continuous development and commercialization of technology, the increasing importance of IP rights enforcement, and the adoption of innovative IP monetization strategies. Patent litigation, a critical component of IP rights enforcement, accounted for approximately 30% of total IP disputes in 2020. In contrast, technology transfer and licensing agreements represented around 60% of IP monetization strategies, highlighting the importance of effective contract negotiation and legal compliance in the market.
- As businesses continue to prioritize IP protection and value creation, the role of confidentiality protocols, trademark enforcement, software protection, and data security becomes increasingly significant. Furthermore, regulatory compliance, brand protection, and IP valuation are essential for businesses seeking to maximize the financial potential of their IP assets.
We can help! Our analysts can customize this physical intellectual property market research report to meet your requirements.
 RIA -
RIA - 
