Poke Foods Market Analysis, Size, and Forecast 2026-2030: North America (US, Canada, and Mexico), Europe (Germany, UK, and France), APAC (China, Japan, and India), South America (Brazil and Argentina), Middle East and Africa (Saudi Arabia, UAE, and South Africa), and Rest of World (ROW)

Poke Foods Market Analysis, Size, and Forecast 2026-2030:
North America (US, Canada, and Mexico), Europe (Germany, UK, and France), APAC (China, Japan, and India), South America (Brazil and Argentina), Middle East and Africa (Saudi Arabia, UAE, and South Africa), and Rest of World (ROW)

Published: Mar 2026 289 Pages SKU: IRTNTR45378

Market Overview at a Glance

$5.85 B
Market Opportunity
10.2%
CAGR 2025 - 2030
72%
North America Growth
$6.07 B
Offline segment 2024

Poke Foods Market Size 2026-2030

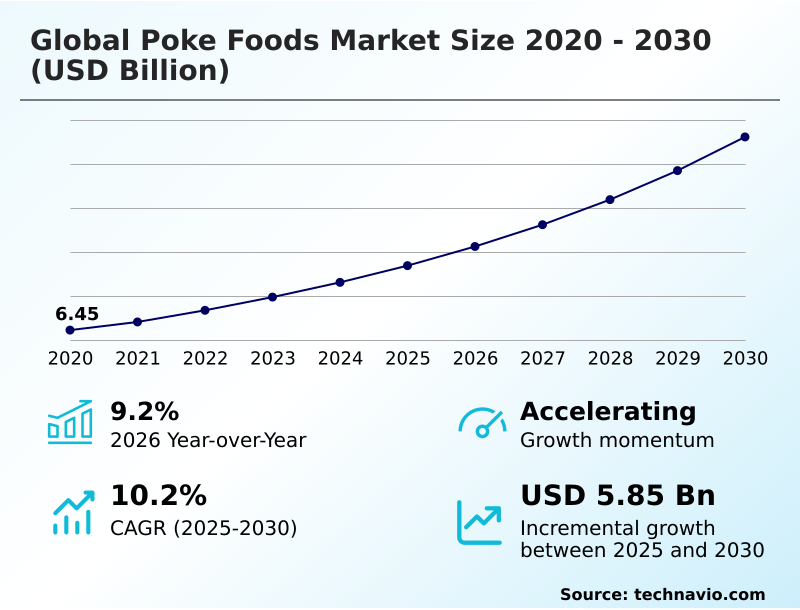
The poke foods market size is valued to increase by USD 5.85 billion, at a CAGR of 10.2% from 2025 to 2030. Increasing number of new companies offering poke foods will drive the poke foods market.

Major Market Trends & Insights

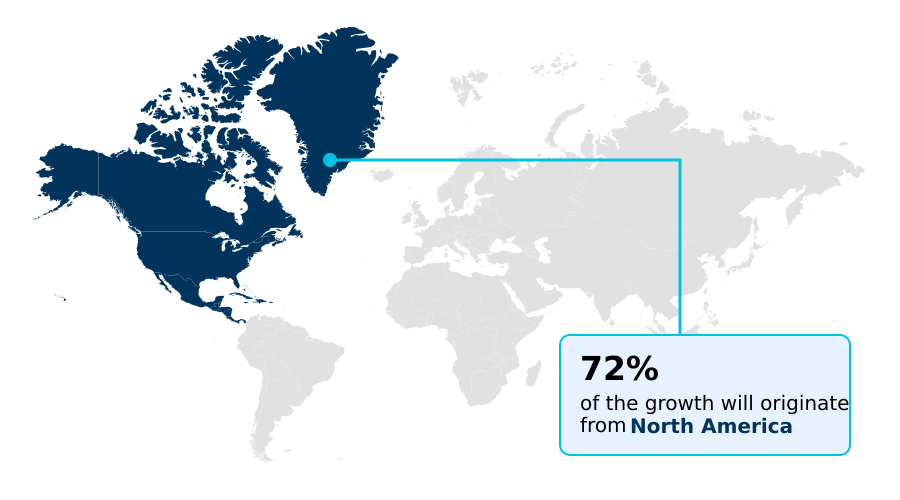
  • North America dominated the market and accounted for a 72% growth during the forecast period.
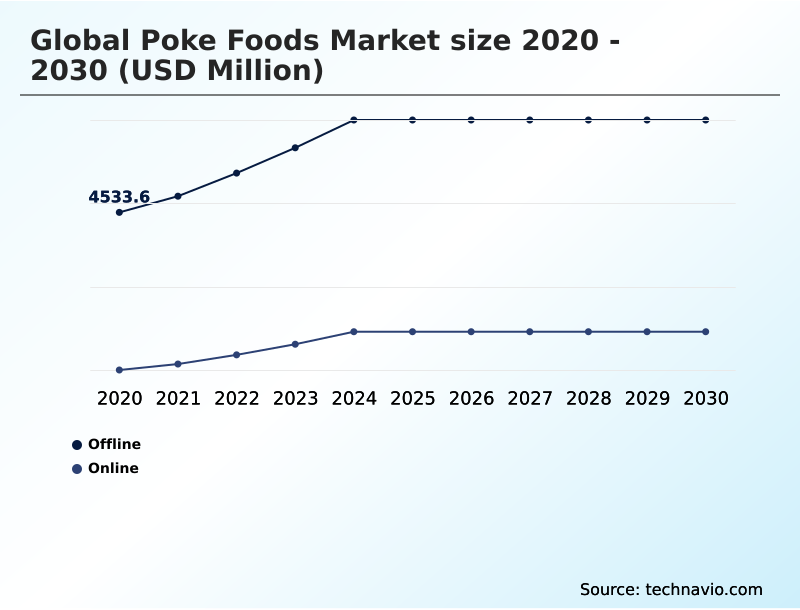
  • By Distribution Channel - Offline segment was valued at USD 6.07 billion in 2024
  • By Product - Traditional poke bowls segment accounted for the largest market revenue share in 2024

Market Size & Forecast

  • Market Opportunities: USD 8.78 billion
  • Market Future Opportunities: USD 5.85 billion
  • CAGR from 2025 to 2030 : 10.2%

Market Summary

  • The poke foods market has evolved from a niche Hawaiian specialty into a mainstream dining category, driven by consumer demand for healthy, customizable, and convenient meals. This expansion is supported by the inherent nutritional benefits of its core components, such as raw fish and fresh vegetables, which align with modern wellness trends.
  • The market's dynamism is further fueled by the proliferation of online ordering and delivery platforms, which have widened accessibility beyond urban centers. A key operational focus involves optimizing the cold chain to ensure ingredient freshness and safety from supplier to consumer.
  • For instance, a multi-regional chain must implement rigorous supply chain transparency and logistics protocols to maintain consistent quality in its traditional poke bowls across all its franchises, a critical factor for brand reputation. However, the industry navigates challenges including rising ingredient costs and intense competition from other fast-casual dining formats.
  • Innovation in plant-based poke options and fusion poke recipes is a primary strategy for brands to differentiate their offerings and attract a broader customer base, ensuring continued relevance and growth.

What will be the Size of the Poke Foods Market during the forecast period?

Get Key Insights on Market Forecast (PDF) Request Free Sample

How is the Poke Foods Market Segmented?

The poke foods industry research report provides comprehensive data (region-wise segment analysis), with forecasts and estimates in "USD million" for the period 2026-2030, as well as historical data from 2020-2024 for the following segments.

  • Distribution channel
    • Offline
    • Online
  • Product
    • Traditional poke bowls
    • Sushi burritos
    • Poke salads
  • End-user
    • Quick service restaurants
    • Casual dining
    • Retail
  • Geography
    • North America
      • US
      • Canada
      • Mexico
    • Europe
      • Germany
      • UK
      • France
    • APAC
      • China
      • Japan
      • India
    • South America
      • Brazil
      • Argentina
    • Middle East and Africa
      • Saudi Arabia
      • UAE
      • South Africa
    • Rest of World (ROW)

By Distribution Channel Insights

The offline segment is estimated to witness significant growth during the forecast period.

The offline segment is foundational to the poke foods market, anchored by direct consumer interaction in physical settings. This channel, encompassing hypermarkets, specialty poke restaurants, and retail food sections, allows for real-time ingredient verification, building consumer trust through transparency.

The casual dining experience lets patrons see the marinated raw fish and fresh vegetables firsthand. Quick service restaurant operations capitalize on impulse purchases in high-traffic locations.

In-store engagement, including live preparation and sampling of seasonal menu items, is a key advantage. Retailers also offer pre-packaged poke bowls and poke meal kits for convenience.

Efficient inventory systems are critical; refined inventory management in this segment reduces perishable waste by over 15%, ensuring both quality and profitability through effective temperature-controlled transport and food-grade packaging solutions.

Request Free Sample

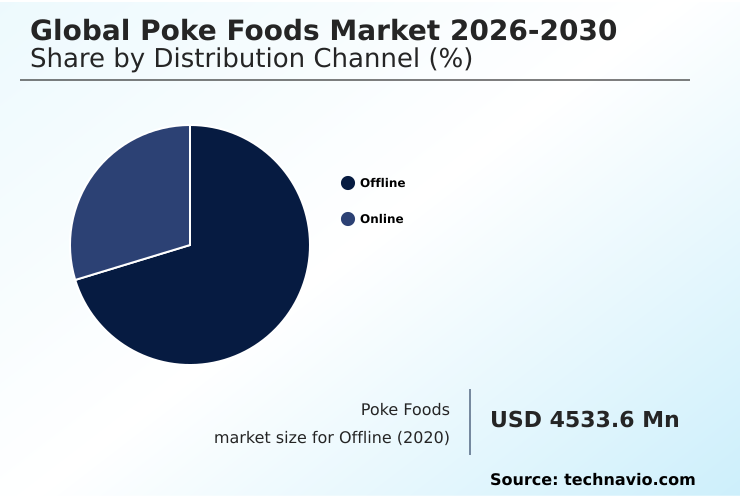
The Offline segment was valued at USD 6.07 billion in 2024 and showed a gradual increase during the forecast period.

Request Free Sample

Regional Analysis

North America is estimated to contribute 72% to the growth of the global market during the forecast period.Technavio’s analysts have elaborately explained the regional trends and drivers that shape the market during the forecast period.

See How Poke Foods Market Demand is Rising in North America Request Free Sample

The geographic landscape of the poke foods market is led by North America, which accounts for nearly 72% of the market's incremental growth, driven by a mature fast-casual scene and high consumer health awareness.

This region sees extensive use of premium food ingredients and widespread availability of restaurant-quality meal kits. Following, Europe is expanding at the fastest rate, with a projected annual growth of 10.7%, where organic seafood certification is a significant consumer driver.

In this region, brands leverage digital menu platforms and customer loyalty programs to capture market share. The APAC market is also gaining momentum, with a focus on sustainable tuna sourcing and the use of advanced chilled food packaging.

Key to global expansion is the adoption of technologies like automated preparation kiosks and efficient poke delivery services, which make offerings like organic salmon for poke more accessible across diverse urban and suburban areas.

Market Dynamics

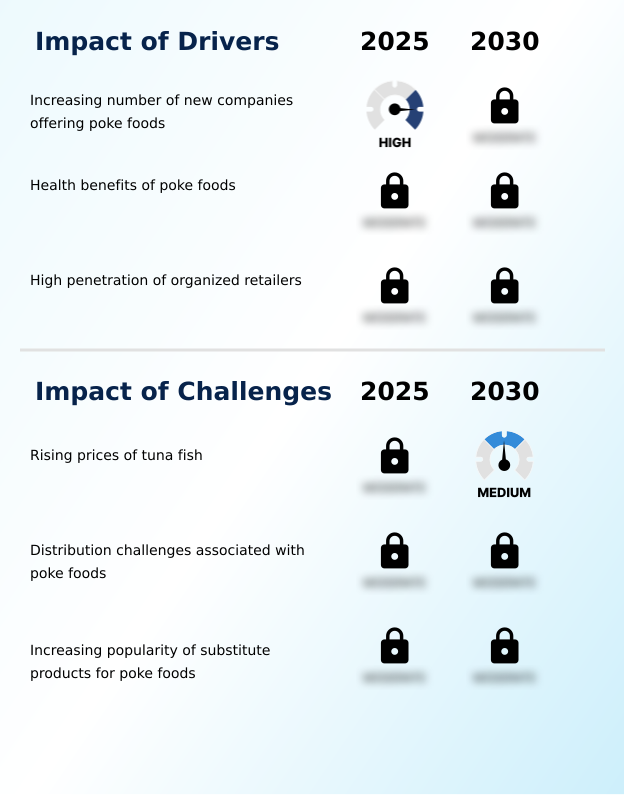
Our researchers analyzed the data with 2025 as the base year, along with the key drivers, trends, and challenges. A holistic analysis of drivers will help companies refine their marketing strategies to gain a competitive advantage.

  • Strategic success in the poke foods market hinges on navigating complex consumer demands and operational realities. Understanding the health benefits of traditional poke bowls is crucial for marketing, but brands must also address the intense competition between sushi burritos vs traditional poke bowls.
  • The rising demand for poke salads with organic seafood highlights a shift toward premium, health-conscious offerings, yet this is challenged by the volatile cost of high-quality raw tuna. The impact of online retailing on poke foods has been transformative, but it introduces challenges in poke food distribution, requiring robust cold-chain logistics.
  • Meanwhile, the growth of poke in European markets presents significant poke restaurant franchise opportunities. Differentiating poke from sushi bowls through unique flavor profiles and marketing strategies for poke restaurants is essential.
  • Firms that master their poke food supply chain, manage food safety in poke prep, and offer innovative plant-based protein in poke bowls are better positioned to mitigate the impact of rising seafood prices.
  • Technology in poke ordering systems and the role of ghost kitchens in the poke market are enabling new service models, while interest in poke bowl meal prep ideas and the nutritional value of customizable poke indicates a move toward integrating poke into daily lifestyles.
  • Ultimately, leveraging sustainable sourcing for poke chains is becoming a key factor for long-term brand loyalty, with companies demonstrating this commitment seeing customer retention rates up to 25% higher than their competitors.

What are the key market drivers leading to the rise in the adoption of Poke Foods Industry?

  • The market's growth is significantly driven by the increasing number of new companies offering poke foods, which enhances competition and expands consumer access.

  • Market growth is primarily propelled by the fast-casual dining format, which aligns with consumer demand for high-quality, convenient meals.
  • The health-conscious positioning of poke, emphasizing fresh fish for poke and quality poke ingredients, is a significant driver, attracting consumers seeking nutritious alternatives.
  • The proliferation of new entrants has intensified competition and innovation, leading to diverse offerings like the poke burrito and fusion poke recipes that expand the category's appeal.
  • Furthermore, the expansion into retail channels with grab-and-go retail products makes the cuisine more accessible, with some retailers reporting a 15% uplift in fresh-food sales after introducing poke.
  • The build-your-own-bowl concept, supported by intuitive online ordering systems and a variety of signature poke sauces, remains a cornerstone of the customer experience, fostering loyalty and repeat business.

What are the market trends shaping the Poke Foods Industry?

  • A prominent trend shaping the market is the increasing consumer preference for organic seafood and poke foods. This is driven by a growing awareness of food quality, traceability, and environmental sustainability.

  • Key market trends are reshaping consumer engagement and operational models. The increasing demand for customizable poke bowls is a primary factor, with digital platforms reporting that personalized orders, including ahi tuna bowls and spicy salmon poke, generate up to 40% higher average transaction values than fixed-menu items.
  • This is coupled with a significant shift toward sustainable seafood sourcing, as brands that provide traceability for their ahi tuna and salmon see customer loyalty improve by over 25%. The expansion of the ghost kitchen model is another critical trend, allowing for rapid market entry with reduced overhead.
  • This model effectively supports the growth of plant-based poke options and vegan poke bowls, catering to a wider demographic. Mastery of cold chain logistics and fresh seafood sourcing remains vital to ensure the quality of raw fish preparation for all offerings.

What challenges does the Poke Foods Industry face during its growth?

  • A key challenge affecting industry growth is the rising price of tuna fish, which directly impacts profit margins and consumer affordability.

  • The market faces considerable challenges that impact profitability and growth. The volatility in seafood prices remains a primary concern, as fluctuations can erode operator margins by up to 20%, particularly for poke restaurant chains heavily reliant on popular but costly high-protein food choices. This necessitates greater supply chain transparency and dynamic menu pricing.
  • A second major challenge is the rising popularity of substitute products, including other healthy fast-casual food and raw fish salads, which have diverted approximately 10% of the market share in competitive urban areas. Brands must continually innovate beyond traditional Hawaiian-inspired dishes and clearly communicate the unique poke bowl nutrition facts of their nutrient-dense meal options.
  • Moreover, ensuring stringent food safety protocols for ready-to-eat poke products is critical to maintaining consumer trust, especially as franchise expansion models scale.

Exclusive Technavio Analysis on Customer Landscape

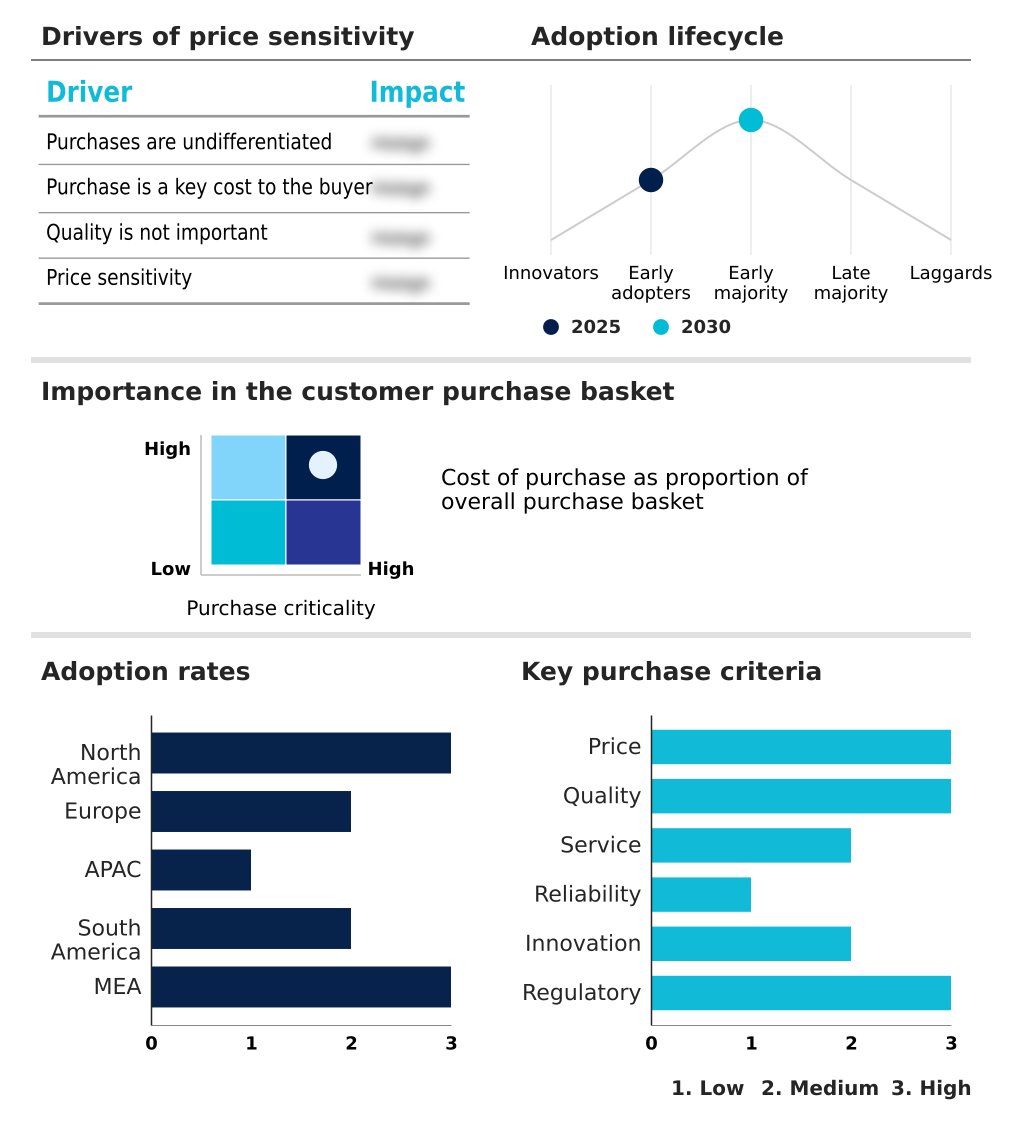
The poke foods market forecasting report includes the adoption lifecycle of the market, covering from the innovator’s stage to the laggard’s stage. It focuses on adoption rates in different regions based on penetration. Furthermore, the poke foods market report also includes key purchase criteria and drivers of price sensitivity to help companies evaluate and develop their market growth analysis strategies.

Customer Landscape of Poke Foods Industry

Competitive Landscape

Companies are implementing various strategies, such as strategic alliances, poke foods market forecast, partnerships, mergers and acquisitions, geographical expansion, and product/service launches, to enhance their presence in the industry.

Aloha Poke Co. - Analysts observe a focus on customizable poke bowls, featuring fresh, high-quality seafood and diverse toppings to cater to health-conscious consumer preferences.

The industry research and growth report includes detailed analyses of the competitive landscape of the market and information about key companies, including:

  • Aloha Poke Co.
  • FreshFin Poke
  • Hawaii Poke
  • Island Fin Poke Co.
  • LemonShark Poke
  • Ohana Poke
  • Oke Poke
  • Pokawa
  • Poke Bros.
  • Poke House SRL
  • Poke N Go
  • Poke Time
  • Poked
  • Pokeworks LLC
  • Poki Bowl
  • Red Poke
  • Sweetfin
  • Temakiden
  • The Poke Co.
  • Uncle Sharkii Poke Bar

Qualitative and quantitative analysis of companies has been conducted to help clients understand the wider business environment as well as the strengths and weaknesses of key industry players. Data is qualitatively analyzed to categorize companies as pure play, category-focused, industry-focused, and diversified; it is quantitatively analyzed to categorize companies as dominant, leading, strong, tentative, and weak.

Recent Development and News in Poke foods market

  • In August 2025, Fresh Catch Poke Co. partnered with Balanced Body Foods to open a new express location on Hertel Avenue, combining poke bowls with meal-prep services and introducing a streamlined self‑checkout model for faster customer convenience.
  • In August 2025, the International Council for Sustainable Seafood released a comprehensive report detailing new cold-chain logistics protocols designed to enhance the safety and quality of raw fish imports for the global poke foods market.
  • In May 2025, AmRest Holdings SE announced a strategic partnership with major supermarket chains to install automated poke preparation kiosks in 500 locations across North America and Europe, aiming to reduce labor costs and maintain product consistency.
  • In March 2025, Moeve partnered with Glovo to launch home delivery of its Moeve Eats brands from service stations, a move projected to increase station revenue by over 30% by expanding sales channels.

Dive into Technavio’s robust research methodology, blending expert interviews, extensive data synthesis, and validated models for unparalleled Poke Foods Market insights. See full methodology.

Market Scope
Page number 289
Base year 2025
Historic period 2020-2024
Forecast period 2026-2030
Growth momentum & CAGR Accelerate at a CAGR of 10.2%
Market growth 2026-2030 USD 5848.9 million
Market structure Fragmented
YoY growth 2025-2026(%) 9.2%
Key countries US, Canada, Mexico, Germany, UK, France, Italy, Spain, The Netherlands, China, Japan, India, South Korea, Australia, Indonesia, Brazil, Argentina, Chile, Saudi Arabia, UAE, South Africa, Israel and Turkey
Competitive landscape Leading Companies, Market Positioning of Companies, Competitive Strategies, and Industry Risks

Request Free Sample

Research Analyst Overview

  • The poke foods market is transitioning from a trend-driven category to a stable fixture in the fast-casual dining format. This maturation is evident in the strategic focus on supply chain transparency and the adoption of advanced food safety protocols for all poke bowl ingredients.
  • Key to this evolution is the use of online ordering systems and third-party delivery apps, which have fundamentally altered consumer access. Boardroom decisions increasingly center on franchise expansion models and the development of private label poke offerings for retail channels.
  • The integration of automated preparation kiosks in high-traffic areas demonstrates a clear strategy to improve quick service restaurant operations, with some operators achieving a 40% increase in order throughput during peak hours. As the market grows, brands are using digital menu platforms and customer loyalty programs to foster retention.
  • Offerings are diversifying from traditional Hawaiian cuisine to include fusion poke recipes and plant-based poke options, ensuring broader appeal while maintaining a focus on nutrient-dense meal options.

What are the Key Data Covered in this Poke Foods Market Research and Growth Report?

  • What is the expected growth of the Poke Foods Market between 2026 and 2030?

    • USD 5.85 billion, at a CAGR of 10.2%

  • What segmentation does the market report cover?

    • The report is segmented by Distribution Channel (Offline, and Online), Product (Traditional poke bowls, Sushi burritos, and Poke salads), End-user (Quick service restaurants, Casual dining, and Retail) and Geography (North America, Europe, APAC, South America, Middle East and Africa)

  • Which regions are analyzed in the report?

    • North America, Europe, APAC, South America and Middle East and Africa

  • What are the key growth drivers and market challenges?

    • Increasing number of new companies offering poke foods, Rising prices of tuna fish

  • Who are the major players in the Poke Foods Market?

    • Aloha Poke Co., FreshFin Poke, Hawaii Poke, Island Fin Poke Co., LemonShark Poke, Ohana Poke, Oke Poke, Pokawa, Poke Bros., Poke House SRL, Poke N Go, Poke Time, Poked, Pokeworks LLC, Poki Bowl, Red Poke, Sweetfin, Temakiden, The Poke Co. and Uncle Sharkii Poke Bar

Market Research Insights

  • The poke foods market is shaped by a dynamic interplay of consumer preferences and operational innovations. The build-your-own-bowl concept remains central, with platforms reporting that customization can increase average order values by up to 25% compared to standard signature poke sauces and bowls.
  • This personalization extends to catering to specific dietary needs, such as low-carb poke bowls and gluten-free poke options. The convenience factor is amplified by poke delivery services, where strategic partnerships have demonstrated the ability to boost a brand’s revenue by over 30% by reaching new customer segments.
  • Simultaneously, the rise of the poke food truck business model offers a lower-overhead entry point into the market, enabling greater agility and access to diverse locations. This combination of customization, convenience, and accessible business models defines the market's competitive velocity.

We can help! Our analysts can customize this poke foods market research report to meet your requirements.

Get in touch

1. Executive Summary

1.1 Market overview

Executive Summary - Chart on Market Overview
Executive Summary - Data Table on Market Overview
Executive Summary - Chart on Global Market Characteristics
Executive Summary - Chart on Market by Geography
Executive Summary - Chart on Market Segmentation by Distribution Channel
Executive Summary - Chart on Market Segmentation by Product
Executive Summary - Chart on Market Segmentation by End-user
Executive Summary - Chart on Incremental Growth
Executive Summary - Data Table on Incremental Growth
Executive Summary - Chart on Company Market Positioning

2. Technavio Analysis

2.1 Analysis of price sensitivity, lifecycle, customer purchase basket, adoption rates, and purchase criteria

2.2 Criticality of inputs and Factors of differentiation

Chart on Overview on criticality of inputs and factors of differentiation

2.3 Factors of disruption

Chart on Overview on factors of disruption

2.4 Impact of drivers and challenges

Chart on Impact of drivers and challenges in 2025 and 2030

3. Market Landscape

3.1 Market ecosystem

Chart on Parent Market
Data Table on - Parent Market

3.2 Market characteristics

Chart on Market characteristics analysis

3.3 Value chain analysis

Chart on Value chain analysis

4. Market Sizing

4.1 Market definition

Data Table on Offerings of companies included in the market definition

4.2 Market segment analysis

Market segments

4.3 Market size 2025

4.4 Market outlook: Forecast for 2025-2030

Chart on Global - Market size and forecast 2025-2030 ($ million)
Data Table on Global - Market size and forecast 2025-2030 ($ million)
Chart on Global Market: Year-over-year growth 2025-2030 (%)
Data Table on Global Market: Year-over-year growth 2025-2030 (%)

5. Historic Market Size

5.1 Global Poke Foods Market 2020 - 2024

Historic Market Size - Data Table on Global Poke Foods Market 2020 - 2024 ($ million)

5.2 Distribution Channel segment analysis 2020 - 2024

Historic Market Size - Distribution Channel Segment 2020 - 2024 ($ million)

5.3 Product segment analysis 2020 - 2024

Historic Market Size - Product Segment 2020 - 2024 ($ million)

5.4 End-user segment analysis 2020 - 2024

Historic Market Size - End-user Segment 2020 - 2024 ($ million)

5.5 Geography segment analysis 2020 - 2024

Historic Market Size - Geography Segment 2020 - 2024 ($ million)

5.6 Country segment analysis 2020 - 2024

Historic Market Size - Country Segment 2020 - 2024 ($ million)

6. Qualitative Analysis

6.1 Impact of AI on the Global Poke Foods Market

7. Five Forces Analysis

7.1 Five forces summary

Five forces analysis - Comparison between 2025 and 2030

7.2 Bargaining power of buyers

Bargaining power of buyers - Impact of key factors 2025 and 2030

7.3 Bargaining power of suppliers

Bargaining power of suppliers - Impact of key factors in 2025 and 2030

7.4 Threat of new entrants

Threat of new entrants - Impact of key factors in 2025 and 2030

7.5 Threat of substitutes

Threat of substitutes - Impact of key factors in 2025 and 2030

7.6 Threat of rivalry

Threat of rivalry - Impact of key factors in 2025 and 2030

7.7 Market condition

Chart on Market condition - Five forces 2025 and 2030

8. Market Segmentation by Distribution Channel

8.1 Market segments

Chart on Distribution Channel - Market share 2025-2030 (%)
Data Table on Distribution Channel - Market share 2025-2030 (%)

8.2 Comparison by Distribution Channel

Chart on Comparison by Distribution Channel
Data Table on Comparison by Distribution Channel

8.3 Offline - Market size and forecast 2025-2030

Chart on Offline - Market size and forecast 2025-2030 ($ million)
Data Table on Offline - Market size and forecast 2025-2030 ($ million)
Chart on Offline - Year-over-year growth 2025-2030 (%)
Data Table on Offline - Year-over-year growth 2025-2030 (%)

8.4 Online - Market size and forecast 2025-2030

Chart on Online - Market size and forecast 2025-2030 ($ million)
Data Table on Online - Market size and forecast 2025-2030 ($ million)
Chart on Online - Year-over-year growth 2025-2030 (%)
Data Table on Online - Year-over-year growth 2025-2030 (%)

8.5 Market opportunity by Distribution Channel

Market opportunity by Distribution Channel ($ million)
Data Table on Market opportunity by Distribution Channel ($ million)

9. Market Segmentation by Product

9.1 Market segments

Chart on Product - Market share 2025-2030 (%)
Data Table on Product - Market share 2025-2030 (%)

9.2 Comparison by Product

Chart on Comparison by Product
Data Table on Comparison by Product

9.3 Traditional poke bowls - Market size and forecast 2025-2030

Chart on Traditional poke bowls - Market size and forecast 2025-2030 ($ million)
Data Table on Traditional poke bowls - Market size and forecast 2025-2030 ($ million)
Chart on Traditional poke bowls - Year-over-year growth 2025-2030 (%)
Data Table on Traditional poke bowls - Year-over-year growth 2025-2030 (%)

9.4 Sushi burritos - Market size and forecast 2025-2030

Chart on Sushi burritos - Market size and forecast 2025-2030 ($ million)
Data Table on Sushi burritos - Market size and forecast 2025-2030 ($ million)
Chart on Sushi burritos - Year-over-year growth 2025-2030 (%)
Data Table on Sushi burritos - Year-over-year growth 2025-2030 (%)

9.5 Poke salads - Market size and forecast 2025-2030

Chart on Poke salads - Market size and forecast 2025-2030 ($ million)
Data Table on Poke salads - Market size and forecast 2025-2030 ($ million)
Chart on Poke salads - Year-over-year growth 2025-2030 (%)
Data Table on Poke salads - Year-over-year growth 2025-2030 (%)

9.6 Market opportunity by Product

Market opportunity by Product ($ million)
Data Table on Market opportunity by Product ($ million)

10. Market Segmentation by End-user

10.1 Market segments

Chart on End-user - Market share 2025-2030 (%)
Data Table on End-user - Market share 2025-2030 (%)

10.2 Comparison by End-user

Chart on Comparison by End-user
Data Table on Comparison by End-user

10.3 Quick service restaurants - Market size and forecast 2025-2030

Chart on Quick service restaurants - Market size and forecast 2025-2030 ($ million)
Data Table on Quick service restaurants - Market size and forecast 2025-2030 ($ million)
Chart on Quick service restaurants - Year-over-year growth 2025-2030 (%)
Data Table on Quick service restaurants - Year-over-year growth 2025-2030 (%)

10.4 Casual dining - Market size and forecast 2025-2030

Chart on Casual dining - Market size and forecast 2025-2030 ($ million)
Data Table on Casual dining - Market size and forecast 2025-2030 ($ million)
Chart on Casual dining - Year-over-year growth 2025-2030 (%)
Data Table on Casual dining - Year-over-year growth 2025-2030 (%)

10.5 Retail - Market size and forecast 2025-2030

Chart on Retail - Market size and forecast 2025-2030 ($ million)
Data Table on Retail - Market size and forecast 2025-2030 ($ million)
Chart on Retail - Year-over-year growth 2025-2030 (%)
Data Table on Retail - Year-over-year growth 2025-2030 (%)

10.6 Market opportunity by End-user

Market opportunity by End-user ($ million)
Data Table on Market opportunity by End-user ($ million)

11. Customer Landscape

11.1 Customer landscape overview

Analysis of price sensitivity, lifecycle, customer purchase basket, adoption rates, and purchase criteria

12. Geographic Landscape

12.1 Geographic segmentation

Chart on Market share by geography 2025-2030 (%)
Data Table on Market share by geography 2025-2030 (%)

12.2 Geographic comparison

Chart on Geographic comparison
Data Table on Geographic comparison

12.3 North America - Market size and forecast 2025-2030

Chart on North America - Market size and forecast 2025-2030 ($ million)
Data Table on North America - Market size and forecast 2025-2030 ($ million)
Chart on North America - Year-over-year growth 2025-2030 (%)
Data Table on North America - Year-over-year growth 2025-2030 (%)
Chart on Regional Comparison - North America
Data Table on Regional Comparison - North America

12.3.1 US - Market size and forecast 2025-2030

Chart on US - Market size and forecast 2025-2030 ($ million)
Data Table on US - Market size and forecast 2025-2030 ($ million)
Chart on US - Year-over-year growth 2025-2030 (%)
Data Table on US - Year-over-year growth 2025-2030 (%)

12.3.2 Canada - Market size and forecast 2025-2030

Chart on Canada - Market size and forecast 2025-2030 ($ million)
Data Table on Canada - Market size and forecast 2025-2030 ($ million)
Chart on Canada - Year-over-year growth 2025-2030 (%)
Data Table on Canada - Year-over-year growth 2025-2030 (%)

12.3.3 Mexico - Market size and forecast 2025-2030

Chart on Mexico - Market size and forecast 2025-2030 ($ million)
Data Table on Mexico - Market size and forecast 2025-2030 ($ million)
Chart on Mexico - Year-over-year growth 2025-2030 (%)
Data Table on Mexico - Year-over-year growth 2025-2030 (%)

12.4 Europe - Market size and forecast 2025-2030

Chart on Europe - Market size and forecast 2025-2030 ($ million)
Data Table on Europe - Market size and forecast 2025-2030 ($ million)
Chart on Europe - Year-over-year growth 2025-2030 (%)
Data Table on Europe - Year-over-year growth 2025-2030 (%)
Chart on Regional Comparison - Europe
Data Table on Regional Comparison - Europe

12.4.1 Germany - Market size and forecast 2025-2030

Chart on Germany - Market size and forecast 2025-2030 ($ million)
Data Table on Germany - Market size and forecast 2025-2030 ($ million)
Chart on Germany - Year-over-year growth 2025-2030 (%)
Data Table on Germany - Year-over-year growth 2025-2030 (%)

12.4.2 UK - Market size and forecast 2025-2030

Chart on UK - Market size and forecast 2025-2030 ($ million)
Data Table on UK - Market size and forecast 2025-2030 ($ million)
Chart on UK - Year-over-year growth 2025-2030 (%)
Data Table on UK - Year-over-year growth 2025-2030 (%)

12.4.3 France - Market size and forecast 2025-2030

Chart on France - Market size and forecast 2025-2030 ($ million)
Data Table on France - Market size and forecast 2025-2030 ($ million)
Chart on France - Year-over-year growth 2025-2030 (%)
Data Table on France - Year-over-year growth 2025-2030 (%)

12.4.4 Italy - Market size and forecast 2025-2030

Chart on Italy - Market size and forecast 2025-2030 ($ million)
Data Table on Italy - Market size and forecast 2025-2030 ($ million)
Chart on Italy - Year-over-year growth 2025-2030 (%)
Data Table on Italy - Year-over-year growth 2025-2030 (%)

12.4.5 Spain - Market size and forecast 2025-2030

Chart on Spain - Market size and forecast 2025-2030 ($ million)
Data Table on Spain - Market size and forecast 2025-2030 ($ million)
Chart on Spain - Year-over-year growth 2025-2030 (%)
Data Table on Spain - Year-over-year growth 2025-2030 (%)

12.4.6 The Netherlands - Market size and forecast 2025-2030

Chart on The Netherlands - Market size and forecast 2025-2030 ($ million)
Data Table on The Netherlands - Market size and forecast 2025-2030 ($ million)
Chart on The Netherlands - Year-over-year growth 2025-2030 (%)
Data Table on The Netherlands - Year-over-year growth 2025-2030 (%)

12.5 APAC - Market size and forecast 2025-2030

Chart on APAC - Market size and forecast 2025-2030 ($ million)
Data Table on APAC - Market size and forecast 2025-2030 ($ million)
Chart on APAC - Year-over-year growth 2025-2030 (%)
Data Table on APAC - Year-over-year growth 2025-2030 (%)
Chart on Regional Comparison - APAC
Data Table on Regional Comparison - APAC

12.5.1 China - Market size and forecast 2025-2030

Chart on China - Market size and forecast 2025-2030 ($ million)
Data Table on China - Market size and forecast 2025-2030 ($ million)
Chart on China - Year-over-year growth 2025-2030 (%)
Data Table on China - Year-over-year growth 2025-2030 (%)

12.5.2 Japan - Market size and forecast 2025-2030

Chart on Japan - Market size and forecast 2025-2030 ($ million)
Data Table on Japan - Market size and forecast 2025-2030 ($ million)
Chart on Japan - Year-over-year growth 2025-2030 (%)
Data Table on Japan - Year-over-year growth 2025-2030 (%)

12.5.3 India - Market size and forecast 2025-2030

Chart on India - Market size and forecast 2025-2030 ($ million)
Data Table on India - Market size and forecast 2025-2030 ($ million)
Chart on India - Year-over-year growth 2025-2030 (%)
Data Table on India - Year-over-year growth 2025-2030 (%)

12.5.4 South Korea - Market size and forecast 2025-2030

Chart on South Korea - Market size and forecast 2025-2030 ($ million)
Data Table on South Korea - Market size and forecast 2025-2030 ($ million)
Chart on South Korea - Year-over-year growth 2025-2030 (%)
Data Table on South Korea - Year-over-year growth 2025-2030 (%)

12.5.5 Australia - Market size and forecast 2025-2030

Chart on Australia - Market size and forecast 2025-2030 ($ million)
Data Table on Australia - Market size and forecast 2025-2030 ($ million)
Chart on Australia - Year-over-year growth 2025-2030 (%)
Data Table on Australia - Year-over-year growth 2025-2030 (%)

12.5.6 Indonesia - Market size and forecast 2025-2030

Chart on Indonesia - Market size and forecast 2025-2030 ($ million)
Data Table on Indonesia - Market size and forecast 2025-2030 ($ million)
Chart on Indonesia - Year-over-year growth 2025-2030 (%)
Data Table on Indonesia - Year-over-year growth 2025-2030 (%)

12.6 South America - Market size and forecast 2025-2030

Chart on South America - Market size and forecast 2025-2030 ($ million)
Data Table on South America - Market size and forecast 2025-2030 ($ million)
Chart on South America - Year-over-year growth 2025-2030 (%)
Data Table on South America - Year-over-year growth 2025-2030 (%)
Chart on Regional Comparison - South America
Data Table on Regional Comparison - South America

12.6.1 Brazil - Market size and forecast 2025-2030

Chart on Brazil - Market size and forecast 2025-2030 ($ million)
Data Table on Brazil - Market size and forecast 2025-2030 ($ million)
Chart on Brazil - Year-over-year growth 2025-2030 (%)
Data Table on Brazil - Year-over-year growth 2025-2030 (%)

12.6.2 Argentina - Market size and forecast 2025-2030

Chart on Argentina - Market size and forecast 2025-2030 ($ million)
Data Table on Argentina - Market size and forecast 2025-2030 ($ million)
Chart on Argentina - Year-over-year growth 2025-2030 (%)
Data Table on Argentina - Year-over-year growth 2025-2030 (%)

12.6.3 Chile - Market size and forecast 2025-2030

Chart on Chile - Market size and forecast 2025-2030 ($ million)
Data Table on Chile - Market size and forecast 2025-2030 ($ million)
Chart on Chile - Year-over-year growth 2025-2030 (%)
Data Table on Chile - Year-over-year growth 2025-2030 (%)

12.7 Middle East and Africa - Market size and forecast 2025-2030

Chart on Middle East and Africa - Market size and forecast 2025-2030 ($ million)
Data Table on Middle East and Africa - Market size and forecast 2025-2030 ($ million)
Chart on Middle East and Africa - Year-over-year growth 2025-2030 (%)
Data Table on Middle East and Africa - Year-over-year growth 2025-2030 (%)
Chart on Regional Comparison - Middle East and Africa
Data Table on Regional Comparison - Middle East and Africa

12.7.1 Saudi Arabia - Market size and forecast 2025-2030

Chart on Saudi Arabia - Market size and forecast 2025-2030 ($ million)
Data Table on Saudi Arabia - Market size and forecast 2025-2030 ($ million)
Chart on Saudi Arabia - Year-over-year growth 2025-2030 (%)
Data Table on Saudi Arabia - Year-over-year growth 2025-2030 (%)

12.7.2 UAE - Market size and forecast 2025-2030

Chart on UAE - Market size and forecast 2025-2030 ($ million)
Data Table on UAE - Market size and forecast 2025-2030 ($ million)
Chart on UAE - Year-over-year growth 2025-2030 (%)
Data Table on UAE - Year-over-year growth 2025-2030 (%)

12.7.3 South Africa - Market size and forecast 2025-2030

Chart on South Africa - Market size and forecast 2025-2030 ($ million)
Data Table on South Africa - Market size and forecast 2025-2030 ($ million)
Chart on South Africa - Year-over-year growth 2025-2030 (%)
Data Table on South Africa - Year-over-year growth 2025-2030 (%)

12.7.4 Israel - Market size and forecast 2025-2030

Chart on Israel - Market size and forecast 2025-2030 ($ million)
Data Table on Israel - Market size and forecast 2025-2030 ($ million)
Chart on Israel - Year-over-year growth 2025-2030 (%)
Data Table on Israel - Year-over-year growth 2025-2030 (%)

12.7.5 Turkey - Market size and forecast 2025-2030

Chart on Turkey - Market size and forecast 2025-2030 ($ million)
Data Table on Turkey - Market size and forecast 2025-2030 ($ million)
Chart on Turkey - Year-over-year growth 2025-2030 (%)
Data Table on Turkey - Year-over-year growth 2025-2030 (%)

12.8 Market opportunity by geography

Market opportunity by geography ($ million)
Data Tables on Market opportunity by geography ($ million)

13. Drivers, Challenges, and Opportunity

13.1 Market drivers

Increasing number of new companies offering poke foods
Health benefits of poke foods
High penetration of organized retailers

13.2 Market challenges

Rising prices of tuna fish
Distribution challenges associated with poke foods
Increasing popularity of substitute products for poke foods

13.3 Impact of drivers and challenges

Impact of drivers and challenges in 2025 and 2030

13.4 Market opportunities

Rising trend of organic seafood and poke foods
Increasing influence of online retailing
Growing production and consumption of tuna fish

14. Competitive Landscape

14.1 Overview

14.2

Overview on criticality of inputs and factors of differentiation

14.3 Landscape disruption

Overview on factors of disruption

14.4 Industry risks

Impact of key risks on business

15. Competitive Analysis

15.1 Companies profiled

Companies covered

15.2 Company ranking index

15.3 Market positioning of companies

Matrix on companies position and classification

15.4 Aloha Poke Co.

Aloha Poke Co. - Overview
Aloha Poke Co. - Product / Service
Aloha Poke Co. - Key offerings
SWOT

15.5 FreshFin Poke

FreshFin Poke - Overview
FreshFin Poke - Product / Service
FreshFin Poke - Key offerings
SWOT

15.6 Island Fin Poke Co.

Island Fin Poke Co. - Overview
Island Fin Poke Co. - Product / Service
Island Fin Poke Co. - Key offerings
SWOT

15.7 Oke Poke

Oke Poke - Overview
Oke Poke - Product / Service
Oke Poke - Key offerings
SWOT

15.8 Pokawa

Pokawa - Overview
Pokawa - Product / Service
Pokawa - Key offerings
SWOT

15.9 Poke Bros.

Poke Bros. - Overview
Poke Bros. - Product / Service
Poke Bros. - Key offerings
SWOT

15.10 Poke House SRL

Poke House SRL - Overview
Poke House SRL - Product / Service
Poke House SRL - Key offerings
SWOT

15.11 Poked

Poked - Overview
Poked - Product / Service
Poked - Key offerings
SWOT

15.12 Pokeworks LLC

Pokeworks LLC - Overview
Pokeworks LLC - Product / Service
Pokeworks LLC - Key offerings
SWOT

15.13 Poki Bowl

Poki Bowl - Overview
Poki Bowl - Product / Service
Poki Bowl - Key offerings
SWOT

15.14 Red Poke

Red Poke - Overview
Red Poke - Product / Service
Red Poke - Key offerings
SWOT

15.15 Sweetfin

Sweetfin - Overview
Sweetfin - Product / Service
Sweetfin - Key offerings
SWOT

15.16 Temakiden

Temakiden - Overview
Temakiden - Product / Service
Temakiden - Key offerings
SWOT

15.17 The Poke Co.

The Poke Co. - Overview
The Poke Co. - Product / Service
The Poke Co. - Key offerings
SWOT

15.18 Uncle Sharkii Poke Bar

Uncle Sharkii Poke Bar - Overview
Uncle Sharkii Poke Bar - Product / Service
Uncle Sharkii Poke Bar - Key offerings
SWOT

16. Appendix

16.1 Scope of the report

Market definition
Objectives
Notes and caveats

16.2 Inclusions and exclusions checklist

Inclusions checklist
Exclusions checklist

16.3 Currency conversion rates for US$

16.4 Research methodology

16.5 Data procurement

Information sources

16.6 Data validation

16.7 Validation techniques employed for market sizing

16.8 Data synthesis

16.9 360 degree market analysis

16.10 List of abbreviations

Research Methodology

Technavio presents a detailed picture of the market by way of study, synthesis, and summation of data from multiple sources. The analysts have presented the various facets of the market with a particular focus on identifying the key industry influencers. The data thus presented is comprehensive, reliable, and the result of extensive research, both primary and secondary.

INFORMATION SOURCES

Primary sources

  • Manufacturers and suppliers
  • Channel partners
  • Industry experts
  • Strategic decision makers

Secondary sources

  • Industry journals and periodicals
  • Government data
  • Financial reports of key industry players
  • Historical data
  • Press releases

DATA ANALYSIS

Data Synthesis

  • Collation of data
  • Estimation of key figures
  • Analysis of derived insights

Data Validation

  • Triangulation with data models
  • Reference against proprietary databases
  • Corroboration with industry experts

REPORT WRITING

Qualitative

  • Market drivers
  • Market challenges
  • Market trends
  • Five forces analysis

Quantitative

  • Market size and forecast
  • Market segmentation
  • Geographical insights
  • Competitive landscape

Interested in this report?

Get your sample now to see our research methodology and insights!

Download Now

Frequently Asked Questions

Poke Foods market growth will increase by USD 5848.9 million during 2026-2030.

The Poke Foods market is expected to grow at a CAGR of 10.2% during 2026-2030.

Poke Foods market is segmented by Distribution channel (Offline, Online) Product (Traditional poke bowls, Sushi burritos, Poke salads) End-user (Quick service restaurants, Casual dining, Retail)

Aloha Poke Co., FreshFin Poke, Hawaii Poke, Island Fin Poke Co., LemonShark Poke, Ohana Poke, Oke Poke, Pokawa, Poke Bros., Poke House SRL, Poke N Go, Poke Time, Poked, Pokeworks LLC, Poki Bowl, Red Poke, Sweetfin, Temakiden, The Poke Co., Uncle Sharkii Poke Bar are a few of the key vendors in the Poke Foods market.

North America will register the highest growth rate of 72% among the other regions. Therefore, the Poke Foods market in North America is expected to garner significant business opportunities for the vendors during the forecast period.

US, Canada, Mexico, Germany, UK, France, Italy, Spain, The Netherlands, China, Japan, India, South Korea, Australia, Indonesia, Brazil, Argentina, Chile, Saudi Arabia, UAE, South Africa, Israel, Turkey

  • Increasing number of new companies offering poke foods is the driving factor this market.

The Poke Foods market vendors should focus on grabbing business opportunities from the Distribution channel segment as it accounted for the largest market share in the base year.
RIA - Research AI Assistant
Ask RIA