
Polyamide Resins Market Size 2025-2029
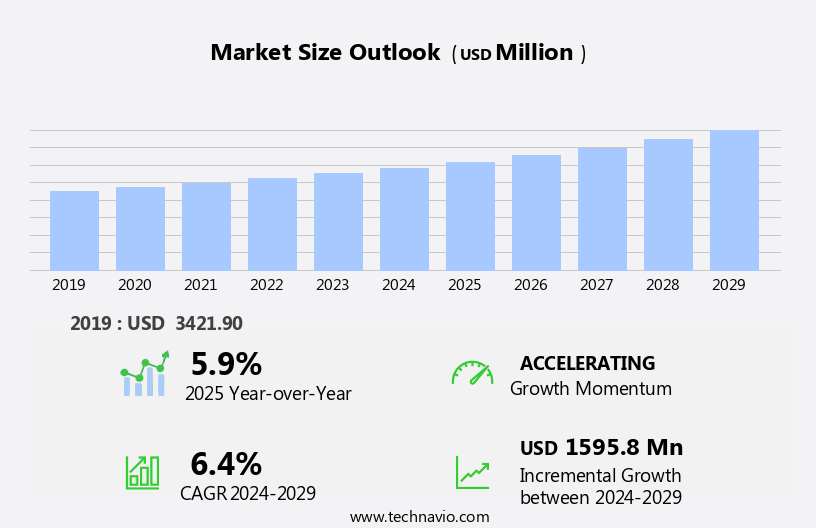
The polyamide resins market size is forecast to increase by USD 1.6 billion, at a CAGR of 6.4% between 2024 and 2029.
- The market is experiencing significant growth, driven primarily by the increasing application in the automotive industry. This sector's demand for high-performance materials, such as polyamide resins, is on the rise due to their excellent properties, including high strength, thermal stability, and resistance to chemicals and moisture. Simultaneously, capacity expansions for manufacturing raw materials are underway to meet the escalating demand. The crystalline structure of polyamide resins provides excellent curing properties, making them suitable for use as plasticizers in chemical plants. However, the market faces a notable challenge: a shortage in the supply of polyamide resins. This scarcity, caused by limited availability of key raw materials and increased demand, poses a significant hurdle for market growth.
- Companies seeking to capitalize on market opportunities must navigate this challenge by securing reliable supply chains and exploring alternative sources. Additionally, investments in research and development could lead to innovative solutions, such as the production of bio-based polyamide resins, which may alleviate the supply issue while reducing environmental impact. Their applications extend to epoxy primers, anticorrosion coatings, coated mortars, antisepsis coatings, epoxy glues, and anti-rust paints.
What will be the Size of the Polyamide Resins Market during the forecast period?
Explore in-depth regional segment analysis with market size data - historical 2019-2023 and forecasts 2025-2029 - in the full report.
Request Free Sample
- Polyamide resins, a versatile class of thermoplastic polymers, exhibit significant market activity and trends in various industries. Polyamide thermoplastics find extensive applications in automotive, electrical, and electronics sectors due to their excellent mechanical properties and chemical resistance. In the coatings segment, polyamide nanocomposites offer enhanced performance through improved durability and weatherability in protective coatings. Polyamide recycling gains traction as businesses prioritize sustainability, driving innovation in the production of polyamide yarn, fibers, and fabrics from post-consumer waste. Meanwhile, polyamide monomer and oligomer markets experience growth due to increasing demand for polyamide polymerization and modification processes. Certification and testing play crucial roles in ensuring product quality and compliance with industry standards, as seen in polyamide films, elastomers, and membranes.
- Crosslinking, grafting, and molding techniques contribute to the development of advanced polyamide alloys and blends, enhancing their performance in various applications. Polyamide upcycling and biocomposites represent emerging trends, as researchers explore new ways to reduce waste and create eco-friendly alternatives. Functionalization and standards development continue to shape the market, driving innovation and ensuring product excellence. In the packaging industry, these resins are used to produce pellets and liquid forms for use in packed food.
How is this Polyamide Resins Industry segmented?
The polyamide resins industry research report provides comprehensive data (region-wise segment analysis), with forecasts and estimates in "USD million" for the period 2025-2029, as well as historical data from 2019-2023 for the following segments.
- Type
- Reactive
- Non-reactive
- Product Type
- Pellets
- Liquids
- Application
- Molded components
- Films and fibers
- Adhesives and sealants
- Others
- End-user
- Automotive
- Electronics and electrical
- Textiles
- Packaging
- Others
- Geography
- North America
- US
- Canada
- Europe
- France
- Germany
- Italy
- APAC
- China
- India
- Japan
- South Korea
- South America
- Brazil
- Rest of World (ROW)
- North America
By Type Insights
The reactive segment is estimated to witness significant growth during the forecast period. Reactive polyamide resins, a type of semi-solid viscous synthetic resins, are primarily utilized as curing agents in epoxy resins for surface coatings and adhesives. Manufactured from dimer fatty acids, these resins exhibit excellent bending properties and superior curing and adhesion qualities, with high impact resistance. The construction industry's growing demand for durable and resilient coatings is expected to drive the market growth of reactive polyamide resins during the forecast period. Polymer additives play a crucial role in enhancing the properties of reactive polyamide resins. In the automotive sector, biaxially oriented polyamide films are utilized for manufacturing fuel-efficient components, such as engine covers and under-the-hood components, due to their excellent thermal and chemical resistance properties.
Flame retardants, UV stabilizers, impact modifiers, and heat distortion temperature regulators are among the essential additives used to improve the overall performance of these resins. Additionally, the integration of carbon fiber and glass fiber reinforcements further boosts their mechanical strength and chemical resistance. The circular economy concept is gaining momentum in the polyamide industry, leading to the increased production and utilization of recycled polyamides. These eco-friendly alternatives offer significant cost savings and reduce the environmental impact of polyamide manufacturing. Moreover, the development of high-performance and reinforced polyamides caters to the evolving demands of various industries, including automotive, engineering plastics, and industrial equipment applications.
Polyamide innovations, such as bio-based polyamides and 3D printing, are transforming the market landscape by offering sustainable alternatives and enabling the production of complex geometries, respectively. Injection molding, extrusion molding, filament extrusion, and additive manufacturing are the primary processing techniques used to manufacture polyamide products. Polyamide regulations and standards, such as REACH and RoHS, ensure the safe production and use of these resins. Despite their advantages, polyamides face challenges like water absorption and high carbon footprint. However, ongoing research and development efforts aim to address these concerns through the use of advanced additives and production techniques. The reactive the market is characterized by continuous innovation, evolving applications, and a growing emphasis on sustainability.
The market's dynamics are driven by factors such as increasing demand for high-performance coatings, advancements in additive technology, and the circular economy's adoption.
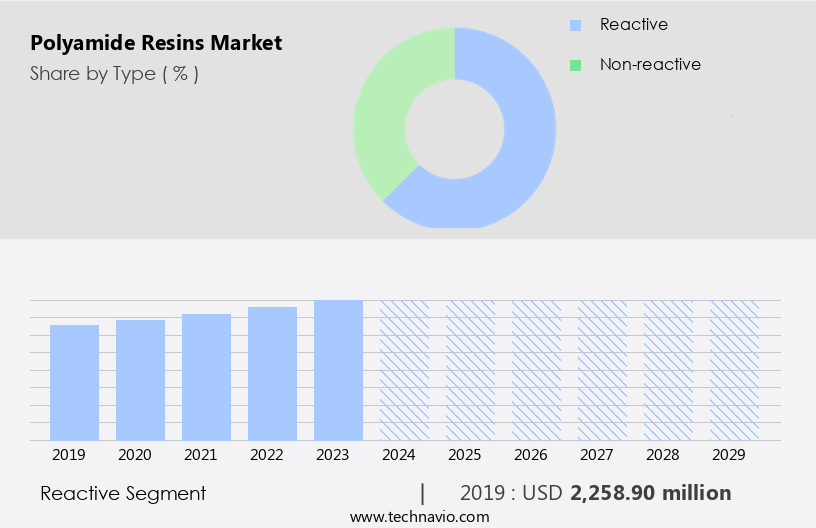
The Reactive segment was valued at USD 2.26 billion in 2019 and showed a gradual increase during the forecast period.
The Polyamide Resins Market is expanding with advancements in carbon fiber reinforcement and mineral filled polyamides, enhancing durability and lightweight applications. The rise of high performance polyamides fuels innovation in electronics applications, where thermal stability and strength are crucial. Comprehensive polyamide market analysis reveals steady growth, driven by fluctuating polyamide pricing and increasing polyamide demand across industries. Optimized polyamide processing techniques improve efficiency, supporting diverse polyamide applications from automotive to healthcare. Adherence to polyamide standards ensures regulatory compliance and polyamide safety, enhancing reliability. Evaluating polyamide performance involves assessing polyamide properties, balancing polyamide advantages such as flexibility and strength with polyamide disadvantages like moisture sensitivity. In the ink industry, they function as plasticizers, improving the flow and clarity of printing.
The Polyamide Resins Market is advancing with innovations in polyamide blends, enhancing material performance across industries. Protective polyamide coatings improve durability, while polyamide membranes enable superior filtration solutions. Growth in polyamide fibers and polyamide fabrics supports textile applications, alongside research into polyamide oligomer properties. Addressing polyamide degradation, manufacturers focus on polyamide modification and polyamide functionalization to enhance longevity. Techniques like polyamide crosslinking and polyamide grafting drive customization, while polyamide biocomposites expand sustainable materials. Demand for polyamide elastomers, polyamide foams, and polyamide molding continues to rise. Advances in polyamide machining, polyamide finishing, and rigorous polyamide testing ensure product reliability. Industry focus on polyamide certification and polyamide standards development strengthens regulatory compliance, fueling further market expansion.
Regional Analysis
APAC is estimated to contribute 48% to the growth of the global market during the forecast period.Technavio's analysts have elaborately explained the regional trends and drivers that shape the market during the forecast period.

The market in the Asia Pacific (APAC) region is experiencing notable growth due to the rapid industrialization in countries like China and India. This industrial expansion drives the demand for polyamide resins in various sectors, including automotive, electronics, packaging, and textiles. The APAC region is a significant player in the global automotive industry, producing and consuming around 6 million vehicles in 2024, with China leading the way. Polyamide resins are essential in automotive manufacturing due to their desirable properties, such as lightweight, durability, and heat resistance. Moreover, polyamide resins exhibit superior abrasion resistance, tensile strength, and chemical resistance, making them suitable for various industrial applications.
The polyamide supply chain incorporates polymer additives, such as flame retardants, impact modifiers, and UV stabilizers, to enhance the material's performance. The use of recycled polyamides and fiber spinning in the production process contributes to the circular economy, reducing the carbon footprint. In the automotive sector, high-performance reinforced polyamides, such as PA6T and PA66, are increasingly being used in automotive applications, including engine components, electrical connectors, and fuel systems. The demand for these high-performance polyamides is driven by their excellent mechanical properties, such as high impact resistance and flexural strength. Polyamide resins also find extensive applications in consumer goods, engineering plastics, and industrial equipment. Furthermore, they are increasingly used in label manufacturing due to their adhesion properties and resistance to various environmental conditions.
The market analysis indicates a growing trend towards the use of 3D printing and injection molding for manufacturing polyamide components. Additionally, the development of bio-based polyamides and mineral-filled polyamides caters to the demand for eco-friendly and cost-effective alternatives. The polyamide market is subject to regulations concerning safety, performance, and environmental impact. Compliance with these standards ensures the production of high-quality polyamide resins that meet the evolving demands of various industries. Despite the advantages, polyamide resins face challenges, such as heat distortion temperature and water absorption, which manufacturers address through the use of additives and innovative processing techniques.
Market Dynamics
Our researchers analyzed the data with 2024 as the base year, along with the key drivers, trends, and challenges. A holistic analysis of drivers will help companies refine their marketing strategies to gain a competitive advantage.
What are the Polyamide Resins market drivers leading to the rise in the adoption of Industry?
- The significant expansion of polyamide resins utilization in the automotive sector serves as the primary market driver. The automotive industry, encompassing passenger automobiles and light trucks, is experiencing significant growth due to increasing global sales. Major automobile-producing countries include China, the US, Japan, Germany, and India. This expanding automotive sector will fuel the demand for polyamide resins. The quest for lighter vehicles to enhance fuel efficiency and better handling has been a consistent trend in the industry. Stringent automobile emission control regulations and concerns over fuel efficiency have led automakers to adopt lightweight materials.
- Techniques like extrusion molding and filament extrusion are commonly used in the manufacturing process. Reinforcement with carbon fiber or glass fibers further enhances the performance of polyamide resins. Despite these advantages, it's essential to acknowledge potential challenges, including manufacturing complexities and specific processing requirements. Overall, the automotive industry's ongoing evolution and the unique properties of polyamide resins make for a compelling market dynamic. In the realm of automotive applications, polyamide resins offer desirable properties such as impact resistance, chemical resistance, and high flexural strength.
What are the Polyamide Resins market trends shaping the Industry?
- The trend in the market involves expanding capacity for the production of raw materials. This is a necessary step for businesses aiming to remain competitive. The market is experiencing significant growth due to the increasing demand for these high-performance materials in various industries. The scarcity of raw materials, specifically ADNs, has led to increased investments in capacity expansions to enhance availability. This development is expected to propel market growth during the forecast period. Polyamide resins offer desirable properties such as flexibility, water resistance, abrasion resistance, corrosion resistance, and superior thermal insulation and adhesion.
- In the engineering plastics segment, polyamide resins are used in heat-sensitive applications due to their high heat distortion temperature. In the electronics industry, these resins are utilized in the production of connectors, printed circuit boards, and other components due to their excellent electrical insulation properties. The market growth is further fueled by the extensive use of impact modifiers to enhance the mechanical properties of polyamide resins. The growing demand for these resins in various end-use industries, coupled with the ongoing research and development activities, is expected to drive the market growth during the forecast period. These attributes make them a preferred choice in consumer goods applications and industrial equipment sectors. Moreover, the emphasis on circular economy and reducing carbon footprint has led to the increasing adoption of bio-based polyamide resins.
How does Polyamide Resins market faces challenges during its growth?
- The polyamide resin supply shortage poses a significant challenge to the industry's growth trajectory. Polyamide resins, commonly known as nylon resins, play a significant role in various industries, particularly in manufacturing components for automotive airbags. However, the increasing demand for these resins, primarily nylon 66, outpaces the supply due to the limited number of large-capacity production plants for the raw material, adiponitrile (ADN), which is used to produce nylon 66. The production of ADN is concentrated in a few locations, with three plants in the US and one in France. The production process of turning raw materials into commercially available polyamide virgin polymer can take a considerable amount of time, leading to supply shortages.
- Moreover, environmental factors such as extreme weather conditions can disrupt the supply chain and exacerbate the shortage. These circumstances can impact the pricing of polyamide resins, making it essential for businesses to consider alternative solutions, such as using mineral-filled polyamides or exploring additive manufacturing techniques like 3D printing for polyamide composites in injection molding processes. Polyamide resins' unique properties, including high strength, heat resistance, and excellent chemical resistance, make them indispensable in various industries, including aerospace applications. To mitigate potential supply issues, businesses can also consider using antistatic agents to enhance the functionality of their polyamide products or adhere to regulations to ensure a steady supply of compliant materials.
Exclusive Customer Landscape
The polyamide resins market forecasting report includes the adoption lifecycle of the market, covering from the innovator's stage to the laggard's stage. It focuses on adoption rates in different regions based on penetration. Furthermore, the polyamide resins market report also includes key purchase criteria and drivers of price sensitivity to help companies evaluate and develop their market growth analysis strategies.

Customer Landscape
Key Companies & Market Insights
Companies are implementing various strategies, such as strategic alliances, polyamide resins market forecast, partnerships, mergers and acquisitions, geographical expansion, and product/service launches, to enhance their presence in the industry.
Arkema - This company specializes in the production and supply of high-performance polyamide resins, including Rilsamid polyamide, Orgalloy polyolefin, Platamid copolyamide, and Orgasol.
The industry research and growth report includes detailed analyses of the competitive landscape of the market and information about key companies, including:
- Arkema
- Ascend Performance Materials
- BASF SE
- Celanese Corp.
- Domo Chemicals GmbH
- DSM-Firmenich AG
- DuPont de Nemours Inc.
- Ensinger
- Evonik Industries AG
- Honeywell International Inc.
- Koch Industries Inc.
- Lanxess AG
- Merck KGaA
- Mitsubishi Gas Chemical Co. Inc.
- Nexis Fibers a.s.
- Solvay SA
- Thomas Swan and Co. Ltd.
- Toray Industries Inc.
- Toyobo Co. Ltd.
- Unitika Ltd.
Qualitative and quantitative analysis of companies has been conducted to help clients understand the wider business environment as well as the strengths and weaknesses of key industry players. Data is qualitatively analyzed to categorize companies as pure play, category-focused, industry-focused, and diversified; it is quantitatively analyzed to categorize companies as dominant, leading, strong, tentative, and weak.
Recent Development and News in Polyamide Resins Market
- In February 2023, BASF SE, a leading chemical producer, announced the expansion of its PA 6.6 production capacity at its Verbund site in Ludwigshafen, Germany. This expansion aims to meet the increasing demand for polyamide 6.6 resins in various industries, including automotive and engineering (BASF press release, 2023).
- In May 2024, Covestro AG and Adidas AG entered into a strategic partnership to develop and produce recycled polyamide resins for use in sportswear. This collaboration is expected to reduce the environmental impact of the production process and enhance Covestro's market presence in the sportswear industry (Covestro press release, 2024).
- In August 2024, INEOS Styrolution, the world's leading styrenics supplier, and LG Chem, a leading chemical company, announced a joint venture to produce and market polyamide 12 resins. This strategic move aims to strengthen their market position and cater to the growing demand for high-performance materials in various industries (INEOS Styrolution press release, 2024).
Research Analyst Overview
The market exhibits a dynamic and evolving landscape, shaped by ongoing innovations and expanding applications across various sectors. These high-performance polymers, also known as nylon resins, offer desirable properties such as heat distortion temperature resistance, impact strength, and chemical resistance. Impact modifiers play a crucial role in enhancing the impact resistance of polyamides, making them suitable for use in automotive components and consumer goods. The circular economy is gaining momentum, driving the demand for recycled polyamides and the development of sustainable manufacturing processes. High-performance polyamides, including reinforced and bio-based varieties, are increasingly used in engineering plastics and industrial equipment applications due to their superior strength and durability.
Life cycle analysis and carbon footprint reduction are key considerations in the polyamide market, with a focus on minimizing environmental impact. Polyamides find extensive applications in electronics, with their excellent electrical insulation properties and resistance to moisture and chemicals. The ongoing development of new polyamide grades and applications continues to unfold, including in 3D printing, filament extrusion, and additive manufacturing. Polyamide manufacturing processes, such as extrusion molding and injection molding, are continually optimized to improve efficiency and reduce costs. Carbon fiber and glass fiber reinforcement further enhance the strength and performance of polyamides, making them ideal for use in aerospace and medical devices applications.
Despite their advantages, polyamides face challenges such as heat distortion temperature limitations and water absorption. Addressing these challenges through the development of new additives, such as UV stabilizers and antistatic agents, and adhering to stringent regulations ensures the ongoing success of the polyamide market. A life cycle analysis of polyamide resins reveals their environmental benefits, making them an attractive alternative to traditional materials. The market analysis indicates a positive outlook for polyamide resins, with their market value expected to grow steadily in the coming years. The melt flow rate of these resins can be customized to cater to various applications, further expanding their market potential.
Dive into Technavio's strong research methodology, blending expert interviews, extensive data synthesis, and validated models for unparalleled Polyamide Resins Market insights. See full methodology.
|
Market Scope |
|
|
Report Coverage |
Details |
|
Page number |
251 |
|
Base year |
2024 |
|
Historic period |
2019-2023 |
|
Forecast period |
2025-2029 |
|
Growth momentum & CAGR |
Accelerate at a CAGR of 6.4% |
|
Market growth 2025-2029 |
USD 1.6 billion |
|
Market structure |
Fragmented |
|
YoY growth 2024-2025(%) |
5.9 |
|
Key countries |
China, US, Germany, Brazil, India, France, Japan, Canada, Italy, and South Korea |
|
Competitive landscape |
Leading Companies, Market Positioning of Companies, Competitive Strategies, and Industry Risks |
What are the Key Data Covered in this Polyamide Resins Market Research and Growth Report?
- CAGR of the Polyamide Resins industry during the forecast period
- Detailed information on factors that will drive the growth and forecasting between 2025 and 2029
- Precise estimation of the size of the market and its contribution of the industry in focus to the parent market
- Accurate predictions about upcoming growth and trends and changes in consumer behaviour
- Growth of the market across APAC, Europe, North America, South America, and Middle East and Africa
- Thorough analysis of the market's competitive landscape and detailed information about companies
- Comprehensive analysis of factors that will challenge the polyamide resins market growth of industry companies
We can help! Our analysts can customize this polyamide resins market research report to meet your requirements.
 RIA -
RIA - 
