Precipitated Calcium Carbonate Market Analysis, Size, and Forecast 2026-2030: APAC (China, India, and Japan), Europe (Germany, France, and Italy), North America (US, Canada, and Mexico), Middle East and Africa (South Africa, Saudi Arabia, and UAE), South America (Brazil, Argentina, and Colombia), and Rest of World (ROW)

Precipitated Calcium Carbonate Market Analysis, Size, and Forecast 2026-2030:
APAC (China, India, and Japan), Europe (Germany, France, and Italy), North America (US, Canada, and Mexico), Middle East and Africa (South Africa, Saudi Arabia, and UAE), South America (Brazil, Argentina, and Colombia), and Rest of World (ROW)

Published: Jan 2026 293 Pages SKU: IRTNTR45583

Market Overview at a Glance

$2.68 B
Market Opportunity
4.5%
CAGR 2025 - 2030
38.5%
APAC Growth
$8.27 B
Pharmaceutical grade segment 2024

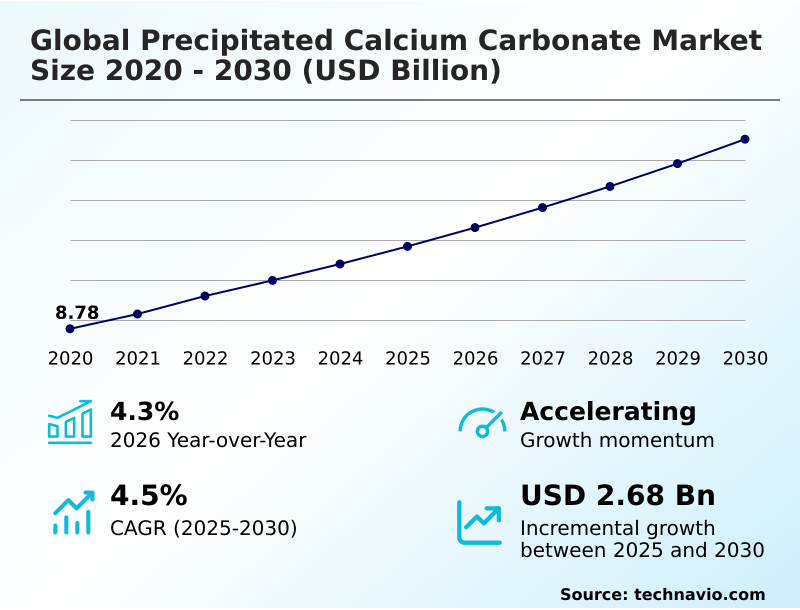
Precipitated Calcium Carbonate Market Size 2026-2030

The precipitated calcium carbonate market size is valued to increase by USD 2.68 billion, at a CAGR of 4.5% from 2025 to 2030. Increasing demand from paper and pulp industry will drive the precipitated calcium carbonate market.

Major Market Trends & Insights

  • APAC dominated the market and accounted for a 38.5% growth during the forecast period.
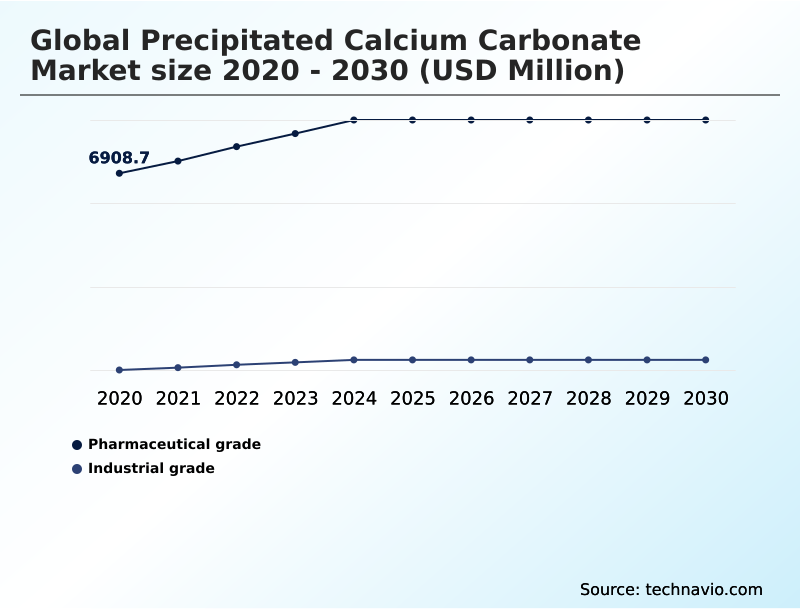
  • By Type - Pharmaceutical grade segment was valued at USD 8.27 billion in 2024
  • By End-user - Paper segment accounted for the largest market revenue share in 2024

Market Size & Forecast

  • Market Opportunities: USD 4.74 billion
  • Market Future Opportunities: USD 2.68 billion
  • CAGR from 2025 to 2030 : 4.5%

Market Summary

  • The precipitated calcium carbonate market is defined by its role as a synthetic industrial mineral that provides tailored functionality across diverse sectors. Unlike mechanically processed alternatives, its chemical synthesis allows for precise control over physical properties, making it an essential component in high-performance applications.
  • The market is driven by expanding use in paper, plastics, and paints, where it enhances brightness, opacity, and durability. Key trends include a pivot toward specialty applications like nano-PCC in automotive lightweighting and the adoption of sustainable production methods, including carbon capture.
  • For instance, a manufacturer in the packaging sector might leverage PCC's properties to increase the recycled content in its products by 15% without sacrificing strength, aligning with circular economy goals. However, the industry navigates challenges related to its energy-intensive production process and logistical complexities, which influence regional supply dynamics and pricing structures for precipitated calcium carbonate.

What will be the Size of the Precipitated Calcium Carbonate Market during the forecast period?

Get Key Insights on Market Forecast (PDF) Request Free Sample

How is the Precipitated Calcium Carbonate Market Segmented?

The precipitated calcium carbonate industry research report provides comprehensive data (region-wise segment analysis), with forecasts and estimates in "USD million" for the period 2026-2030, as well as historical data from 2020-2024 for the following segments.

  • Type
    • Pharmaceutical grade
    • Industrial grade
  • End-user
    • Paper
    • Plastic
    • Paint
    • Adhesive and sealant
    • Others
  • Form factor
    • Dry PCC
    • Slurry PCC
  • Geography
    • APAC
      • China
      • India
      • Japan
    • Europe
      • Germany
      • France
      • Italy
    • North America
      • US
      • Canada
      • Mexico
    • Middle East and Africa
      • South Africa
      • Saudi Arabia
      • UAE
    • South America
      • Brazil
      • Argentina
      • Colombia
    • Rest of World (ROW)

By Type Insights

The pharmaceutical grade segment is estimated to witness significant growth during the forecast period.

The pharmaceutical grade precipitated calcium carbonate market represents a high-value category defined by exacting pharmacopoeial standards. This grade acts as a critical excipient in solid dosage forms and is a primary calcium supplements source.

The synthesis process, which begins with high-purity limestone, involves controlled calcium carbonate precipitation to precisely manage particle size distribution and specific surface area, ensuring purity for pcc in pharmaceutical applications.

The sector's growth is tied to the expanding nutraceuticals field, where it serves as a buffering agent in food and an essential calcium source for nutraceuticals, along with uses in pcc in water treatment and as anti-caking agents.

This segment accounts for over 80% of the total market value, underscoring its financial significance.

Request Free Sample

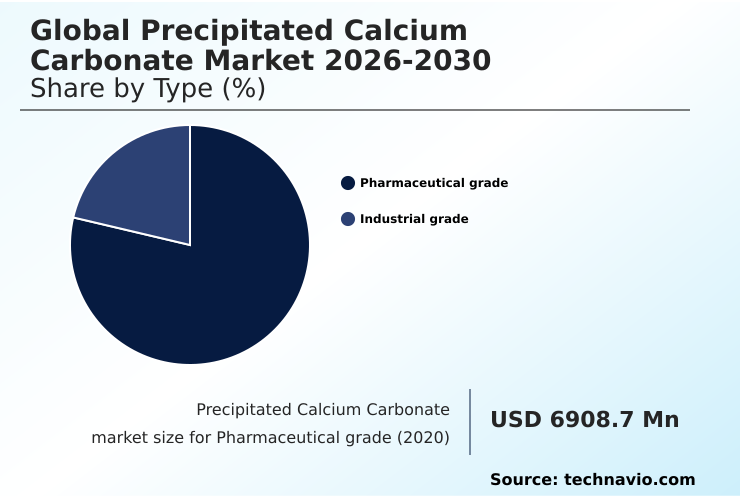
The Pharmaceutical grade segment was valued at USD 8.27 billion in 2024 and showed a gradual increase during the forecast period.

Request Free Sample

Regional Analysis

APAC is estimated to contribute 38.5% to the growth of the global market during the forecast period.Technavio’s analysts have elaborately explained the regional trends and drivers that shape the market during the forecast period.

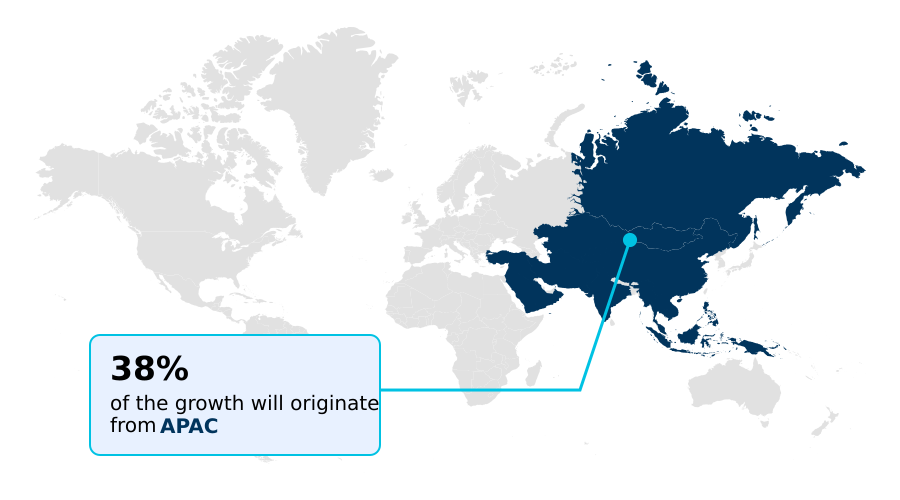
See How Precipitated Calcium Carbonate Market Demand is Rising in APAC Request Free Sample

The geographic landscape of the precipitated calcium carbonate market is dominated by APAC, which represents a market opportunity nearly 1.5 times that of Europe.

In this region, the use of nano-precipitated calcium carbonate is expanding, particularly in automotive underbody coatings and pvc plastisol formulations. This growth is driven by the automotive sector's demand for high-performance polymer compounds and mineral-based rheology modifiers.

The application of surface-treated calcium carbonate as a functional impact modifier enhances the durability of pvc window profiles, a key use in the region's booming construction sector.

Additionally, its role as an acid neutralization agent and in calcium carbonate for soil treatment supports the agricultural industry. The US market, over five times larger than Canada's, heavily influences North American trends, especially in high-performance polymer compounds.

Market Dynamics

Our researchers analyzed the data with 2025 as the base year, along with the key drivers, trends, and challenges. A holistic analysis of drivers will help companies refine their marketing strategies to gain a competitive advantage.

  • Strategic applications of precipitated calcium carbonate are diversifying, creating opportunities beyond traditional uses. The selection between precipitated vs ground calcium carbonate properties often hinges on specific performance requirements. In construction, using pcc to improve paint opacity is a standard practice, with formulators choosing ultrafine pcc for rigid pvc siding to enhance weatherability.
  • For plastics, the focus is on improving plastic impact resistance with pcc and using pcc for vehicle weight reduction. Nano-pcc for automotive sealant applications is a key growth area, where its impact on sealant rheology is critical.
  • In papermaking, the role of pcc in alkaline papermaking continues, especially with pcc slurry for on-site paper mills and its use for enhancing paperboard printability, where it can improve surface gloss by up to 10% compared to other fillers.
  • The growth of surface-treated pcc in polymer composites is enabling new product developments, including precipitated calcium carbonate in biodegradable plastics and its role as a tio2 extender in coatings. Other niche but important uses include precipitated calcium carbonate in food fortification, pharmaceutical grade pcc for antacids, and calcium carbonate for rubber reinforcement.

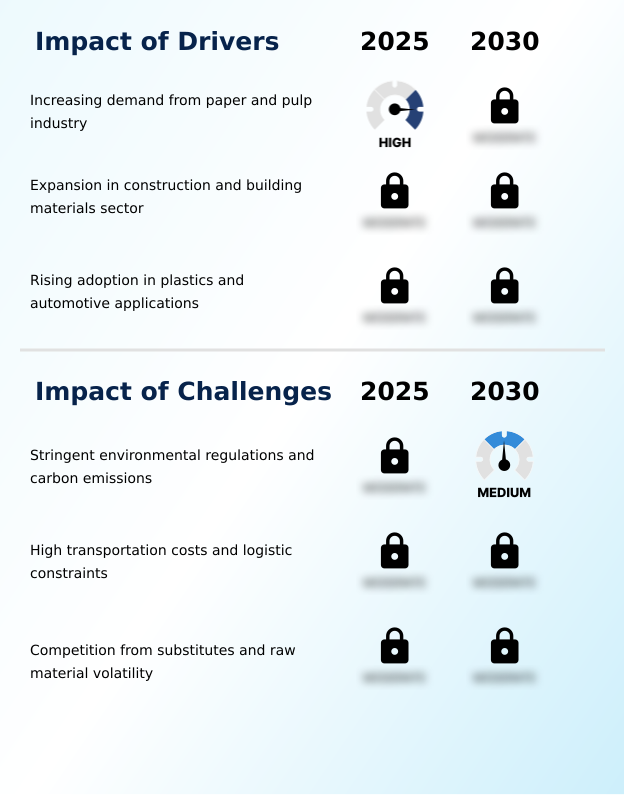
What are the key market drivers leading to the rise in the adoption of Precipitated Calcium Carbonate Industry?

  • The primary driver for the market is the increasing demand from the paper and pulp industry.

  • Demand from the paper and construction sectors remains a primary market driver. The alkaline papermaking process relies heavily on precipitated calcium carbonate for wet-end paper filling, where its superior light scattering properties are used for enhancing paper brightness.
  • The use of pcc satellite plants at paper mills has improved supply chain efficiency by over 25% in some cases.
  • In paints, it serves as a functional extender pigment, offering significant cost reduction in paint formulation by enabling titanium dioxide extension.
  • The momentum in APAC, outpacing South America by over 45%, is fueled by extensive use of this industrial mineral filler in new construction and infrastructure, where it is a key component in mineral fillers in construction and fillers for adhesives and sealants.
  • This robust demand across multiple core industries underpins the market's steady growth trajectory and encourages ongoing investment in capacity.

What are the market trends shaping the Precipitated Calcium Carbonate Industry?

  • The market is increasingly influenced by the acceleration of decarbonization and the integration of circular economy principles within manufacturing processes.

  • Key market trends are centered on sustainability and high-value applications. The adoption of carbon capture and utilization is reshaping production, with manufacturers leveraging biogenic carbon dioxide to create sustainable mineral additives.
  • This shift supports the growing demand for eco-friendly building materials, where pcc in green construction is gaining traction, contributing to a 15% increase in the use of certified materials in some regions. Innovations in crystal structures, like aragonitic needle-shaped pcc and scalenohedral calcite morphology, are enabling new functionalities.
  • In packaging, the focus is on fillers for recyclable packaging and pcc for paper coating, with the use of stearic acid coating enhancing dispersion in hydrophobic polymer matrices. The development of water-based barrier coatings is critical for replacing plastics.
  • These trends are moving the market toward applications where performance, not just cost, is the primary driver, with APAC representing a growth opportunity nearly 1.5 times that of Europe.

What challenges does the Precipitated Calcium Carbonate Industry face during its growth?

  • Stringent environmental regulations and concerns over carbon emissions represent a key challenge impacting the industry's growth trajectory.

  • The market faces challenges from operational costs and competitive materials. The energy-intensive quicklime calcination process and subsequent calcium oxide hydration contribute significantly to production costs. Logistical complexities are a major hurdle, as transporting pcc slurry, which can have solids content below 70%, is economically inefficient compared to dry alternatives.
  • Competition from ground calcium carbonate, a less expensive alternative, pressures margins in applications where high performance is not critical. Furthermore, in plastics and rubber, formulators must optimize polymer matrix reinforcement, balancing the benefits of precipitated calcium carbonate with cost.
  • Issues such as managing oil absorption value and ensuring proper dispersion with tools like stearic acid coating are critical for achieving desired outcomes, such as improving polymer impact strength in applications for rigid pvc.

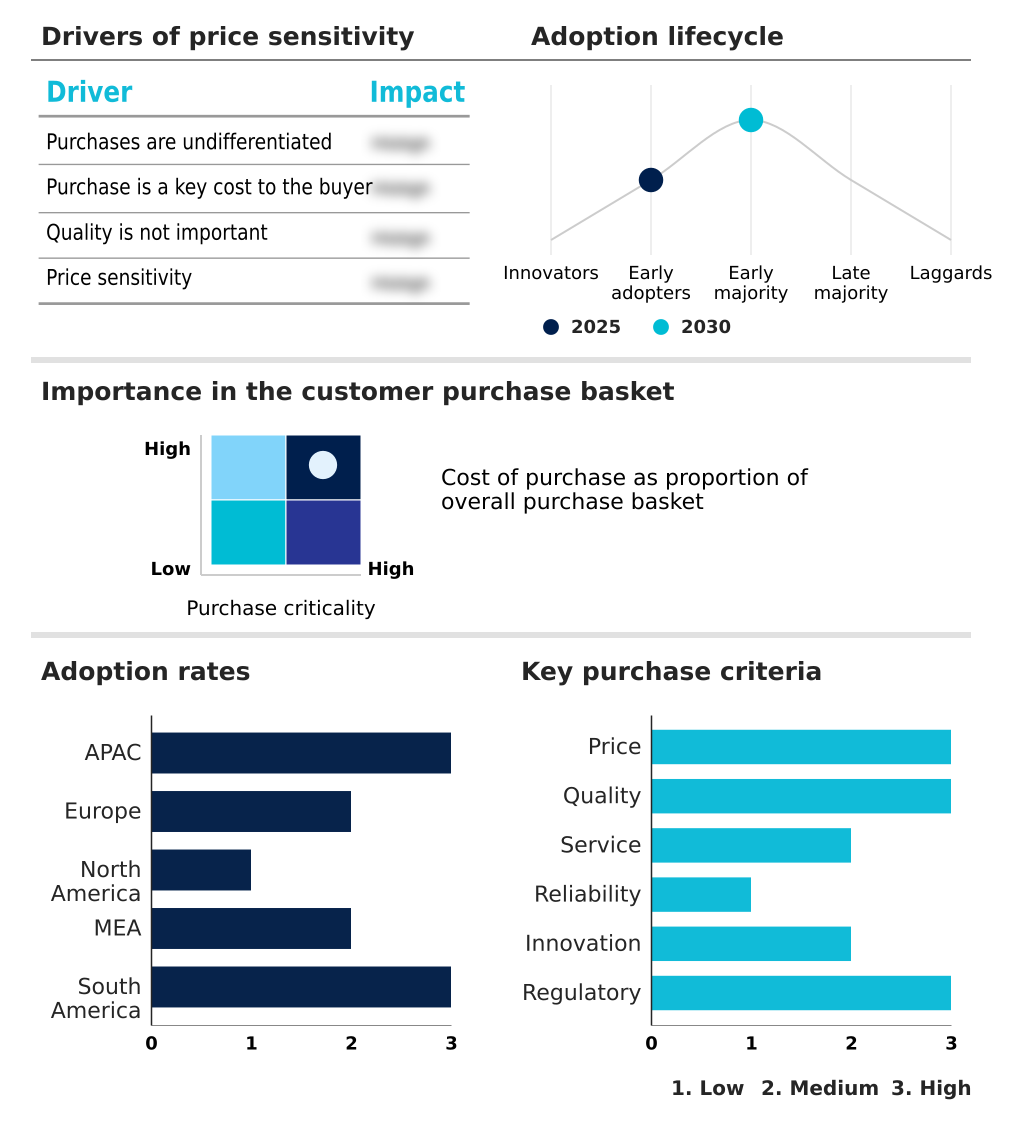
Exclusive Technavio Analysis on Customer Landscape

The precipitated calcium carbonate market forecasting report includes the adoption lifecycle of the market, covering from the innovator’s stage to the laggard’s stage. It focuses on adoption rates in different regions based on penetration. Furthermore, the precipitated calcium carbonate market report also includes key purchase criteria and drivers of price sensitivity to help companies evaluate and develop their market growth analysis strategies.

Customer Landscape of Precipitated Calcium Carbonate Industry

Competitive Landscape

Companies are implementing various strategies, such as strategic alliances, precipitated calcium carbonate market forecast, partnerships, mergers and acquisitions, geographical expansion, and product/service launches, to enhance their presence in the industry.

Cales de Llierca SA - Offers industrial mineral solutions, including functional fillers and pigments derived from calcium carbonate and dolomite, for diverse manufacturing applications.

The industry research and growth report includes detailed analyses of the competitive landscape of the market and information about key companies, including:

  • Cales de Llierca SA
  • Carmeuse Coordination Center SA
  • Chemical and Mineral Industries Ltd.
  • Fimatec Ltd.
  • Graymont Ltd.
  • Gulshan Polyols Ltd.
  • Henan Shunbang Chemical Industry CO. Ltd
  • Hi-Tech Minerals and Chemicals
  • Imerys S.A.
  • Lhoist SA
  • Longcliffe Quarries Ltd.
  • Mangalam Group of Industries
  • Minerals Technologies Inc.
  • Mississippi Lime Co.
  • Ningyang Globalbas Co., Ltd.
  • Nordkalk Corp.
  • Omya International AG
  • SCHAEFER KALK GmbH
  • SCR Sibelco NV

Qualitative and quantitative analysis of companies has been conducted to help clients understand the wider business environment as well as the strengths and weaknesses of key industry players. Data is qualitatively analyzed to categorize companies as pure play, category-focused, industry-focused, and diversified; it is quantitatively analyzed to categorize companies as dominant, leading, strong, tentative, and weak.

Recent Development and News in Precipitated calcium carbonate market

  • In March 2025, Omya AG unveiled a new portfolio of functionalized calcium carbonate grades produced using renewable energy sources, specifically designed to enhance the recyclability of polyolefin-based packaging.
  • In June 2025, the Environmental Protection Agency announced intentions to revise current limits on greenhouse gas emissions from specific power plants, impacting energy-intensive manufacturing sectors.
  • In October 2025, CarbonFree and Univar Solutions announced a partnership to increase the US supply of carbon-neutral, mine-free calcium carbonate, with Univar Solutions set to distribute the product.
  • In December 2025, India's Ministry of Finance imposed anti-dumping duties on imports of calcium carbonate filler masterbatch from Vietnam to protect its domestic industry from dumping practices.

Dive into Technavio’s robust research methodology, blending expert interviews, extensive data synthesis, and validated models for unparalleled Precipitated Calcium Carbonate Market insights. See full methodology.

Market Scope
Page number 293
Base year 2025
Historic period 2020-2024
Forecast period 2026-2030
Growth momentum & CAGR Accelerate at a CAGR of 4.5%
Market growth 2026-2030 USD 2678.9 million
Market structure Fragmented
YoY growth 2025-2026(%) 4.3%
Key countries China, India, Japan, South Korea, Australia, Indonesia, Germany, France, Italy, UK, Spain, The Netherlands, US, Canada, Mexico, South Africa, Saudi Arabia, UAE, Israel, Turkey, Brazil, Argentina and Colombia
Competitive landscape Leading Companies, Market Positioning of Companies, Competitive Strategies, and Industry Risks

Request Free Sample

Research Analyst Overview

  • The precipitated calcium carbonate market is evolving from a commodity-driven space to one defined by technical specialization and sustainability. The ability to engineer specific properties such as scalenohedral calcite morphology and rhombohedral crystal structures is critical for performance in advanced applications.
  • In boardroom decisions, the focus is shifting to lifecycle impact, where the use of carbon capture and utilization and biogenic carbon dioxide in production offers a competitive advantage. For example, firms that have integrated pcc satellite plants at customer sites report logistical efficiency gains of over 30%.
  • Key technical considerations include managing particle size distribution, specific surface area, and oil absorption value. The market sees a continuous interplay between various material science aspects, from titanium dioxide extension in paints and coatings to the use of nano-precipitated calcium carbonate and surface-treated calcium carbonate in polymer matrix reinforcement for automotive underbody coatings and pvc window profiles.
  • The transition to the alkaline papermaking process cemented its role in wet-end paper filling, where its light scattering properties are invaluable.

What are the Key Data Covered in this Precipitated Calcium Carbonate Market Research and Growth Report?

  • What is the expected growth of the Precipitated Calcium Carbonate Market between 2026 and 2030?

    • USD 2.68 billion, at a CAGR of 4.5%

  • What segmentation does the market report cover?

    • The report is segmented by Type (Pharmaceutical grade, and Industrial grade), End-user (Paper, Plastic, Paint, Adhesive and sealant, and Others), Form Factor (Dry PCC, and Slurry PCC) and Geography (APAC, Europe, North America, Middle East and Africa, South America)

  • Which regions are analyzed in the report?

    • APAC, Europe, North America, Middle East and Africa and South America

  • What are the key growth drivers and market challenges?

    • Increasing demand from paper and pulp industry, Stringent environmental regulations and carbon emissions

  • Who are the major players in the Precipitated Calcium Carbonate Market?

    • Cales de Llierca SA, Carmeuse Coordination Center SA, Chemical and Mineral Industries Ltd., Fimatec Ltd., Graymont Ltd., Gulshan Polyols Ltd., Henan Shunbang Chemical Industry CO. Ltd, Hi-Tech Minerals and Chemicals, Imerys S.A., Lhoist SA, Longcliffe Quarries Ltd., Mangalam Group of Industries, Minerals Technologies Inc., Mississippi Lime Co., Ningyang Globalbas Co., Ltd., Nordkalk Corp., Omya International AG, SCHAEFER KALK GmbH and SCR Sibelco NV

Market Research Insights

  • The precipitated calcium carbonate market is shaped by demand for specialized functionalities across industries. Formulations leverage mineral-based rheology modifiers to achieve performance gains, such as a 20% improvement in sag resistance for sealants. The adoption of high-performance polymer compounds is critical, as is the use of pcc for printing inks and additives for thermal stability.
  • The market sees pcc in green construction becoming more prevalent, with lightweighting in automotive plastics driving innovation. In paints, it serves as an extender for titanium dioxide, while in paper, it is used for enhancing paper brightness. Sustainable mineral additives and fillers for recyclable packaging are key trends.
  • Producers are also addressing needs for pcc for tissue and towel and pcc for rigid pvc. The use of pcc in plastic applications can improve impact strength by up to 30%, showcasing its value beyond simple cost reduction.

We can help! Our analysts can customize this precipitated calcium carbonate market research report to meet your requirements.

Get in touch

1. Executive Summary

1.1 Market overview

Executive Summary - Chart on Market Overview
Executive Summary - Data Table on Market Overview
Executive Summary - Chart on Global Market Characteristics
Executive Summary - Chart on Market by Geography
Executive Summary - Chart on Market Segmentation by Type
Executive Summary - Chart on Market Segmentation by End-user
Executive Summary - Chart on Market Segmentation by Form Factor
Executive Summary - Chart on Incremental Growth
Executive Summary - Data Table on Incremental Growth
Executive Summary - Chart on Company Market Positioning

2. Technavio Analysis

2.1 Analysis of price sensitivity, lifecycle, customer purchase basket, adoption rates, and purchase criteria

2.2 Criticality of inputs and Factors of differentiation

Chart on Overview on criticality of inputs and factors of differentiation

2.3 Factors of disruption

Chart on Overview on factors of disruption

2.4 Impact of drivers and challenges

Chart on Impact of drivers and challenges in 2025 and 2030

3. Market Landscape

3.1 Market ecosystem

Chart on Parent Market
Data Table on - Parent Market

3.2 Market characteristics

Chart on Market characteristics analysis

3.3 Value chain analysis

Chart on Value chain analysis

4. Market Sizing

4.1 Market definition

Data Table on Offerings of companies included in the market definition

4.2 Market segment analysis

Market segments

4.3 Market size 2025

4.4 Market outlook: Forecast for 2025-2030

Chart on Global - Market size and forecast 2025-2030 ($ million)
Data Table on Global - Market size and forecast 2025-2030 ($ million)
Chart on Global Market: Year-over-year growth 2025-2030 (%)
Data Table on Global Market: Year-over-year growth 2025-2030 (%)

5. Historic Market Size

5.1 Global Precipitated Calcium Carbonate Market 2020 - 2024

Historic Market Size - Data Table on Global Precipitated Calcium Carbonate Market 2020 - 2024 ($ million)

5.2 Type segment analysis 2020 - 2024

Historic Market Size - Type Segment 2020 - 2024 ($ million)

5.3 End-user segment analysis 2020 - 2024

Historic Market Size - End-user Segment 2020 - 2024 ($ million)

5.4 Form Factor segment analysis 2020 - 2024

Historic Market Size - Form Factor Segment 2020 - 2024 ($ million)

5.5 Geography segment analysis 2020 - 2024

Historic Market Size - Geography Segment 2020 - 2024 ($ million)

5.6 Country segment analysis 2020 - 2024

Historic Market Size - Country Segment 2020 - 2024 ($ million)

6. Qualitative Analysis

6.1 Impact of AI on the Global Precipitated Calcium Carbonate Market

7. Five Forces Analysis

7.1 Five forces summary

Five forces analysis - Comparison between 2025 and 2030

7.2 Bargaining power of buyers

Bargaining power of buyers - Impact of key factors 2025 and 2030

7.3 Bargaining power of suppliers

Bargaining power of suppliers - Impact of key factors in 2025 and 2030

7.4 Threat of new entrants

Threat of new entrants - Impact of key factors in 2025 and 2030

7.5 Threat of substitutes

Threat of substitutes - Impact of key factors in 2025 and 2030

7.6 Threat of rivalry

Threat of rivalry - Impact of key factors in 2025 and 2030

7.7 Market condition

Chart on Market condition - Five forces 2025 and 2030

8. Market Segmentation by Type

8.1 Market segments

Chart on Type - Market share 2025-2030 (%)
Data Table on Type - Market share 2025-2030 (%)

8.2 Comparison by Type

Chart on Comparison by Type
Data Table on Comparison by Type

8.3 Pharmaceutical grade - Market size and forecast 2025-2030

Chart on Pharmaceutical grade - Market size and forecast 2025-2030 ($ million)
Data Table on Pharmaceutical grade - Market size and forecast 2025-2030 ($ million)
Chart on Pharmaceutical grade - Year-over-year growth 2025-2030 (%)
Data Table on Pharmaceutical grade - Year-over-year growth 2025-2030 (%)

8.4 Industrial grade - Market size and forecast 2025-2030

Chart on Industrial grade - Market size and forecast 2025-2030 ($ million)
Data Table on Industrial grade - Market size and forecast 2025-2030 ($ million)
Chart on Industrial grade - Year-over-year growth 2025-2030 (%)
Data Table on Industrial grade - Year-over-year growth 2025-2030 (%)

8.5 Market opportunity by Type

Market opportunity by Type ($ million)
Data Table on Market opportunity by Type ($ million)

9. Market Segmentation by End-user

9.1 Market segments

Chart on End-user - Market share 2025-2030 (%)
Data Table on End-user - Market share 2025-2030 (%)

9.2 Comparison by End-user

Chart on Comparison by End-user
Data Table on Comparison by End-user

9.3 Paper - Market size and forecast 2025-2030

Chart on Paper - Market size and forecast 2025-2030 ($ million)
Data Table on Paper - Market size and forecast 2025-2030 ($ million)
Chart on Paper - Year-over-year growth 2025-2030 (%)
Data Table on Paper - Year-over-year growth 2025-2030 (%)

9.4 Plastic - Market size and forecast 2025-2030

Chart on Plastic - Market size and forecast 2025-2030 ($ million)
Data Table on Plastic - Market size and forecast 2025-2030 ($ million)
Chart on Plastic - Year-over-year growth 2025-2030 (%)
Data Table on Plastic - Year-over-year growth 2025-2030 (%)

9.5 Paint - Market size and forecast 2025-2030

Chart on Paint - Market size and forecast 2025-2030 ($ million)
Data Table on Paint - Market size and forecast 2025-2030 ($ million)
Chart on Paint - Year-over-year growth 2025-2030 (%)
Data Table on Paint - Year-over-year growth 2025-2030 (%)

9.6 Adhesive and sealant - Market size and forecast 2025-2030

Chart on Adhesive and sealant - Market size and forecast 2025-2030 ($ million)
Data Table on Adhesive and sealant - Market size and forecast 2025-2030 ($ million)
Chart on Adhesive and sealant - Year-over-year growth 2025-2030 (%)
Data Table on Adhesive and sealant - Year-over-year growth 2025-2030 (%)

9.7 Others - Market size and forecast 2025-2030

Chart on Others - Market size and forecast 2025-2030 ($ million)
Data Table on Others - Market size and forecast 2025-2030 ($ million)
Chart on Others - Year-over-year growth 2025-2030 (%)
Data Table on Others - Year-over-year growth 2025-2030 (%)

9.8 Market opportunity by End-user

Market opportunity by End-user ($ million)
Data Table on Market opportunity by End-user ($ million)

10. Market Segmentation by Form Factor

10.1 Market segments

Chart on Form Factor - Market share 2025-2030 (%)
Data Table on Form Factor - Market share 2025-2030 (%)

10.2 Comparison by Form Factor

Chart on Comparison by Form Factor
Data Table on Comparison by Form Factor

10.3 Dry PCC - Market size and forecast 2025-2030

Chart on Dry PCC - Market size and forecast 2025-2030 ($ million)
Data Table on Dry PCC - Market size and forecast 2025-2030 ($ million)
Chart on Dry PCC - Year-over-year growth 2025-2030 (%)
Data Table on Dry PCC - Year-over-year growth 2025-2030 (%)

10.4 Slurry PCC - Market size and forecast 2025-2030

Chart on Slurry PCC - Market size and forecast 2025-2030 ($ million)
Data Table on Slurry PCC - Market size and forecast 2025-2030 ($ million)
Chart on Slurry PCC - Year-over-year growth 2025-2030 (%)
Data Table on Slurry PCC - Year-over-year growth 2025-2030 (%)

10.5 Market opportunity by Form Factor

Market opportunity by Form Factor ($ million)
Data Table on Market opportunity by Form Factor ($ million)

11. Customer Landscape

11.1 Customer landscape overview

Analysis of price sensitivity, lifecycle, customer purchase basket, adoption rates, and purchase criteria

12. Geographic Landscape

12.1 Geographic segmentation

Chart on Market share by geography 2025-2030 (%)
Data Table on Market share by geography 2025-2030 (%)

12.2 Geographic comparison

Chart on Geographic comparison
Data Table on Geographic comparison

12.3 APAC - Market size and forecast 2025-2030

Chart on APAC - Market size and forecast 2025-2030 ($ million)
Data Table on APAC - Market size and forecast 2025-2030 ($ million)
Chart on APAC - Year-over-year growth 2025-2030 (%)
Data Table on APAC - Year-over-year growth 2025-2030 (%)
Chart on Regional Comparison - APAC
Data Table on Regional Comparison - APAC

12.3.1 China - Market size and forecast 2025-2030

Chart on China - Market size and forecast 2025-2030 ($ million)
Data Table on China - Market size and forecast 2025-2030 ($ million)
Chart on China - Year-over-year growth 2025-2030 (%)
Data Table on China - Year-over-year growth 2025-2030 (%)

12.3.2 India - Market size and forecast 2025-2030

Chart on India - Market size and forecast 2025-2030 ($ million)
Data Table on India - Market size and forecast 2025-2030 ($ million)
Chart on India - Year-over-year growth 2025-2030 (%)
Data Table on India - Year-over-year growth 2025-2030 (%)

12.3.3 Japan - Market size and forecast 2025-2030

Chart on Japan - Market size and forecast 2025-2030 ($ million)
Data Table on Japan - Market size and forecast 2025-2030 ($ million)
Chart on Japan - Year-over-year growth 2025-2030 (%)
Data Table on Japan - Year-over-year growth 2025-2030 (%)

12.3.4 South Korea - Market size and forecast 2025-2030

Chart on South Korea - Market size and forecast 2025-2030 ($ million)
Data Table on South Korea - Market size and forecast 2025-2030 ($ million)
Chart on South Korea - Year-over-year growth 2025-2030 (%)
Data Table on South Korea - Year-over-year growth 2025-2030 (%)

12.3.5 Australia - Market size and forecast 2025-2030

Chart on Australia - Market size and forecast 2025-2030 ($ million)
Data Table on Australia - Market size and forecast 2025-2030 ($ million)
Chart on Australia - Year-over-year growth 2025-2030 (%)
Data Table on Australia - Year-over-year growth 2025-2030 (%)

12.3.6 Indonesia - Market size and forecast 2025-2030

Chart on Indonesia - Market size and forecast 2025-2030 ($ million)
Data Table on Indonesia - Market size and forecast 2025-2030 ($ million)
Chart on Indonesia - Year-over-year growth 2025-2030 (%)
Data Table on Indonesia - Year-over-year growth 2025-2030 (%)

12.4 Europe - Market size and forecast 2025-2030

Chart on Europe - Market size and forecast 2025-2030 ($ million)
Data Table on Europe - Market size and forecast 2025-2030 ($ million)
Chart on Europe - Year-over-year growth 2025-2030 (%)
Data Table on Europe - Year-over-year growth 2025-2030 (%)
Chart on Regional Comparison - Europe
Data Table on Regional Comparison - Europe

12.4.1 Germany - Market size and forecast 2025-2030

Chart on Germany - Market size and forecast 2025-2030 ($ million)
Data Table on Germany - Market size and forecast 2025-2030 ($ million)
Chart on Germany - Year-over-year growth 2025-2030 (%)
Data Table on Germany - Year-over-year growth 2025-2030 (%)

12.4.2 France - Market size and forecast 2025-2030

Chart on France - Market size and forecast 2025-2030 ($ million)
Data Table on France - Market size and forecast 2025-2030 ($ million)
Chart on France - Year-over-year growth 2025-2030 (%)
Data Table on France - Year-over-year growth 2025-2030 (%)

12.4.3 Italy - Market size and forecast 2025-2030

Chart on Italy - Market size and forecast 2025-2030 ($ million)
Data Table on Italy - Market size and forecast 2025-2030 ($ million)
Chart on Italy - Year-over-year growth 2025-2030 (%)
Data Table on Italy - Year-over-year growth 2025-2030 (%)

12.4.4 UK - Market size and forecast 2025-2030

Chart on UK - Market size and forecast 2025-2030 ($ million)
Data Table on UK - Market size and forecast 2025-2030 ($ million)
Chart on UK - Year-over-year growth 2025-2030 (%)
Data Table on UK - Year-over-year growth 2025-2030 (%)

12.4.5 Spain - Market size and forecast 2025-2030

Chart on Spain - Market size and forecast 2025-2030 ($ million)
Data Table on Spain - Market size and forecast 2025-2030 ($ million)
Chart on Spain - Year-over-year growth 2025-2030 (%)
Data Table on Spain - Year-over-year growth 2025-2030 (%)

12.4.6 The Netherlands - Market size and forecast 2025-2030

Chart on The Netherlands - Market size and forecast 2025-2030 ($ million)
Data Table on The Netherlands - Market size and forecast 2025-2030 ($ million)
Chart on The Netherlands - Year-over-year growth 2025-2030 (%)
Data Table on The Netherlands - Year-over-year growth 2025-2030 (%)

12.5 North America - Market size and forecast 2025-2030

Chart on North America - Market size and forecast 2025-2030 ($ million)
Data Table on North America - Market size and forecast 2025-2030 ($ million)
Chart on North America - Year-over-year growth 2025-2030 (%)
Data Table on North America - Year-over-year growth 2025-2030 (%)
Chart on Regional Comparison - North America
Data Table on Regional Comparison - North America

12.5.1 US - Market size and forecast 2025-2030

Chart on US - Market size and forecast 2025-2030 ($ million)
Data Table on US - Market size and forecast 2025-2030 ($ million)
Chart on US - Year-over-year growth 2025-2030 (%)
Data Table on US - Year-over-year growth 2025-2030 (%)

12.5.2 Canada - Market size and forecast 2025-2030

Chart on Canada - Market size and forecast 2025-2030 ($ million)
Data Table on Canada - Market size and forecast 2025-2030 ($ million)
Chart on Canada - Year-over-year growth 2025-2030 (%)
Data Table on Canada - Year-over-year growth 2025-2030 (%)

12.5.3 Mexico - Market size and forecast 2025-2030

Chart on Mexico - Market size and forecast 2025-2030 ($ million)
Data Table on Mexico - Market size and forecast 2025-2030 ($ million)
Chart on Mexico - Year-over-year growth 2025-2030 (%)
Data Table on Mexico - Year-over-year growth 2025-2030 (%)

12.6 Middle East and Africa - Market size and forecast 2025-2030

Chart on Middle East and Africa - Market size and forecast 2025-2030 ($ million)
Data Table on Middle East and Africa - Market size and forecast 2025-2030 ($ million)
Chart on Middle East and Africa - Year-over-year growth 2025-2030 (%)
Data Table on Middle East and Africa - Year-over-year growth 2025-2030 (%)
Chart on Regional Comparison - Middle East and Africa
Data Table on Regional Comparison - Middle East and Africa

12.6.1 South Africa - Market size and forecast 2025-2030

Chart on South Africa - Market size and forecast 2025-2030 ($ million)
Data Table on South Africa - Market size and forecast 2025-2030 ($ million)
Chart on South Africa - Year-over-year growth 2025-2030 (%)
Data Table on South Africa - Year-over-year growth 2025-2030 (%)

12.6.2 Saudi Arabia - Market size and forecast 2025-2030

Chart on Saudi Arabia - Market size and forecast 2025-2030 ($ million)
Data Table on Saudi Arabia - Market size and forecast 2025-2030 ($ million)
Chart on Saudi Arabia - Year-over-year growth 2025-2030 (%)
Data Table on Saudi Arabia - Year-over-year growth 2025-2030 (%)

12.6.3 UAE - Market size and forecast 2025-2030

Chart on UAE - Market size and forecast 2025-2030 ($ million)
Data Table on UAE - Market size and forecast 2025-2030 ($ million)
Chart on UAE - Year-over-year growth 2025-2030 (%)
Data Table on UAE - Year-over-year growth 2025-2030 (%)

12.6.4 Israel - Market size and forecast 2025-2030

Chart on Israel - Market size and forecast 2025-2030 ($ million)
Data Table on Israel - Market size and forecast 2025-2030 ($ million)
Chart on Israel - Year-over-year growth 2025-2030 (%)
Data Table on Israel - Year-over-year growth 2025-2030 (%)

12.6.5 Turkey - Market size and forecast 2025-2030

Chart on Turkey - Market size and forecast 2025-2030 ($ million)
Data Table on Turkey - Market size and forecast 2025-2030 ($ million)
Chart on Turkey - Year-over-year growth 2025-2030 (%)
Data Table on Turkey - Year-over-year growth 2025-2030 (%)

12.7 South America - Market size and forecast 2025-2030

Chart on South America - Market size and forecast 2025-2030 ($ million)
Data Table on South America - Market size and forecast 2025-2030 ($ million)
Chart on South America - Year-over-year growth 2025-2030 (%)
Data Table on South America - Year-over-year growth 2025-2030 (%)
Chart on Regional Comparison - South America
Data Table on Regional Comparison - South America

12.7.1 Brazil - Market size and forecast 2025-2030

Chart on Brazil - Market size and forecast 2025-2030 ($ million)
Data Table on Brazil - Market size and forecast 2025-2030 ($ million)
Chart on Brazil - Year-over-year growth 2025-2030 (%)
Data Table on Brazil - Year-over-year growth 2025-2030 (%)

12.7.2 Argentina - Market size and forecast 2025-2030

Chart on Argentina - Market size and forecast 2025-2030 ($ million)
Data Table on Argentina - Market size and forecast 2025-2030 ($ million)
Chart on Argentina - Year-over-year growth 2025-2030 (%)
Data Table on Argentina - Year-over-year growth 2025-2030 (%)

12.7.3 Colombia - Market size and forecast 2025-2030

Chart on Colombia - Market size and forecast 2025-2030 ($ million)
Data Table on Colombia - Market size and forecast 2025-2030 ($ million)
Chart on Colombia - Year-over-year growth 2025-2030 (%)
Data Table on Colombia - Year-over-year growth 2025-2030 (%)

12.8 Market opportunity by geography

Market opportunity by geography ($ million)
Data Tables on Market opportunity by geography ($ million)

13. Drivers, Challenges, and Opportunity

13.1 Market drivers

Increasing demand from paper and pulp industry
Expansion in construction and building materials sector
Rising adoption in plastics and automotive applications

13.2 Market challenges

Stringent environmental regulations and carbon emissions
High transportation costs and logistic constraints
Competition from substitutes and raw material volatility

13.3 Impact of drivers and challenges

Impact of drivers and challenges in 2025 and 2030

13.4 Market opportunities

Acceleration of decarbonization and circular economy integration in manufacturing
Strategic shift from graphic paper to advanced packaging and tissue applications
Escalating demand for nano-pcc in high-performance polymers and automotive

14. Competitive Landscape

14.1 Overview

14.2

Overview on criticality of inputs and factors of differentiation

14.3 Landscape disruption

Overview on factors of disruption

14.4 Industry risks

Impact of key risks on business

15. Competitive Analysis

15.1 Companies profiled

Companies covered

15.2 Company ranking index

15.3 Market positioning of companies

Matrix on companies position and classification

15.4 Cales de Llierca SA

Cales de Llierca SA - Overview
Cales de Llierca SA - Product / Service
Cales de Llierca SA - Key offerings
SWOT

15.5 Carmeuse Coordination Center SA

Carmeuse Coordination Center SA - Overview
Carmeuse Coordination Center SA - Product / Service
Carmeuse Coordination Center SA - Key offerings
SWOT

15.6 Chemical and Mineral Industries Ltd.

Chemical and Mineral Industries Ltd. - Overview
Chemical and Mineral Industries Ltd. - Product / Service
Chemical and Mineral Industries Ltd. - Key offerings
SWOT

15.7 Fimatec Ltd.

Fimatec Ltd. - Overview
Fimatec Ltd. - Product / Service
Fimatec Ltd. - Key offerings
SWOT

15.8 Graymont Ltd.

Graymont Ltd. - Overview
Graymont Ltd. - Product / Service
Graymont Ltd. - Key offerings
SWOT

15.9 Gulshan Polyols Ltd.

Gulshan Polyols Ltd. - Overview
Gulshan Polyols Ltd. - Business segments
Gulshan Polyols Ltd. - Key offerings
Gulshan Polyols Ltd. - Segment focus
SWOT

15.10 Imerys S.A.

Imerys S.A. - Overview
Imerys S.A. - Business segments
Imerys S.A. - Key offerings
Imerys S.A. - Segment focus
SWOT

15.11 Lhoist SA

Lhoist SA - Overview
Lhoist SA - Product / Service
Lhoist SA - Key offerings
SWOT

15.12 Longcliffe Quarries Ltd.

Longcliffe Quarries Ltd. - Overview
Longcliffe Quarries Ltd. - Product / Service
Longcliffe Quarries Ltd. - Key offerings
SWOT

15.13 Minerals Technologies Inc.

Minerals Technologies Inc. - Overview
Minerals Technologies Inc. - Business segments
Minerals Technologies Inc. - Key news
Minerals Technologies Inc. - Key offerings
Minerals Technologies Inc. - Segment focus
SWOT

15.14 Mississippi Lime Co.

Mississippi Lime Co. - Overview
Mississippi Lime Co. - Product / Service
Mississippi Lime Co. - Key offerings
SWOT

15.15 Nordkalk Corp.

Nordkalk Corp. - Overview
Nordkalk Corp. - Product / Service
Nordkalk Corp. - Key offerings
SWOT

15.16 Omya International AG

Omya International AG - Overview
Omya International AG - Product / Service
Omya International AG - Key offerings
SWOT

15.17 SCHAEFER KALK GmbH

SCHAEFER KALK GmbH - Overview
SCHAEFER KALK GmbH - Product / Service
SCHAEFER KALK GmbH - Key offerings
SWOT

15.18 SCR Sibelco NV

SCR Sibelco NV - Overview
SCR Sibelco NV - Product / Service
SCR Sibelco NV - Key news
SCR Sibelco NV - Key offerings
SWOT

16. Appendix

16.1 Scope of the report

Market definition
Objectives
Notes and caveats

16.2 Inclusions and exclusions checklist

Inclusions checklist
Exclusions checklist

16.3 Currency conversion rates for US$

16.4 Research methodology

16.5 Data procurement

Information sources

16.6 Data validation

16.7 Validation techniques employed for market sizing

16.8 Data synthesis

16.9 360 degree market analysis

16.10 List of abbreviations

Research Methodology

Technavio presents a detailed picture of the market by way of study, synthesis, and summation of data from multiple sources. The analysts have presented the various facets of the market with a particular focus on identifying the key industry influencers. The data thus presented is comprehensive, reliable, and the result of extensive research, both primary and secondary.

INFORMATION SOURCES

Primary sources

  • Manufacturers and suppliers
  • Channel partners
  • Industry experts
  • Strategic decision makers

Secondary sources

  • Industry journals and periodicals
  • Government data
  • Financial reports of key industry players
  • Historical data
  • Press releases

DATA ANALYSIS

Data Synthesis

  • Collation of data
  • Estimation of key figures
  • Analysis of derived insights

Data Validation

  • Triangulation with data models
  • Reference against proprietary databases
  • Corroboration with industry experts

REPORT WRITING

Qualitative

  • Market drivers
  • Market challenges
  • Market trends
  • Five forces analysis

Quantitative

  • Market size and forecast
  • Market segmentation
  • Geographical insights
  • Competitive landscape

Interested in this report?

Get your sample now to see our research methodology and insights!

Download Now

Frequently Asked Questions

Precipitated Calcium Carbonate market growth will increase by USD 2678.9 million during 2026-2030.

The Precipitated Calcium Carbonate market is expected to grow at a CAGR of 4.5% during 2026-2030.

Precipitated Calcium Carbonate market is segmented by Type (Pharmaceutical grade, Industrial grade) End-user (Paper, Plastic, Paint, Adhesive and sealant, Others) Form factor (Dry PCC, Slurry PCC)

Cales de Llierca SA, Carmeuse Coordination Center SA, Chemical and Mineral Industries Ltd., Fimatec Ltd., Graymont Ltd., Gulshan Polyols Ltd., Henan Shunbang Chemical Industry CO. Ltd, Hi-Tech Minerals and Chemicals, Imerys S.A., Lhoist SA, Longcliffe Quarries Ltd., Mangalam Group of Industries, Minerals Technologies Inc., Mississippi Lime Co., Ningyang Globalbas Co., Ltd., Nordkalk Corp., Omya International AG, SCHAEFER KALK GmbH, SCR Sibelco NV are a few of the key vendors in the Precipitated Calcium Carbonate market.

APAC will register the highest growth rate of 38.5% among the other regions. Therefore, the Precipitated Calcium Carbonate market in APAC is expected to garner significant business opportunities for the vendors during the forecast period.

China, India, Japan, South Korea, Australia, Indonesia, Germany, France, Italy, UK, Spain, The Netherlands, US, Canada, Mexico, South Africa, Saudi Arabia, UAE, Israel, Turkey, Brazil, Argentina, Colombia

  • Increasing demand from paper and pulp industry is the driving factor this market.

The Precipitated Calcium Carbonate market vendors should focus on grabbing business opportunities from the Type segment as it accounted for the largest market share in the base year.