Prompt Engineering Tools Market Analysis, Size, and Forecast 2026-2030: North America (US, Canada, and Mexico), Europe (Germany, UK, and France), APAC (China, Japan, and India), South America (Brazil and Argentina), Middle East and Africa (Saudi Arabia, UAE, and South Africa), and Rest of World (ROW)

Prompt Engineering Tools Market Analysis, Size, and Forecast 2026-2030:
North America (US, Canada, and Mexico), Europe (Germany, UK, and France), APAC (China, Japan, and India), South America (Brazil and Argentina), Middle East and Africa (Saudi Arabia, UAE, and South Africa), and Rest of World (ROW)

Published: Apr 2026 321 Pages SKU: IRTNTR80664

Market Overview at a Glance

$2.63 B
Market Opportunity
18.9%
CAGR 2025 - 2030
34.4%
North America Growth
$1.35 B
Self-hosted segment 2024

Prompt Engineering Tools Market Size 2026-2030

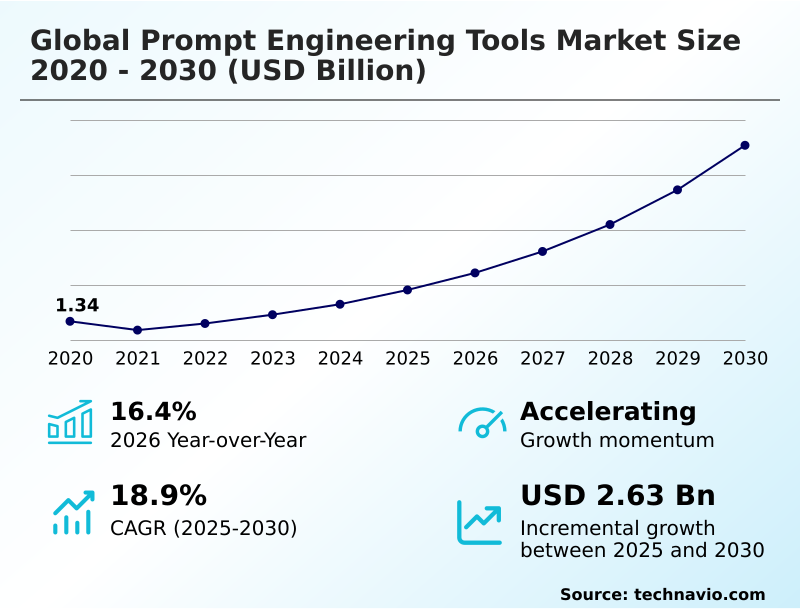
The prompt engineering tools market size is valued to increase by USD 2.63 billion, at a CAGR of 18.9% from 2025 to 2030. Increasing proliferation and sophistication of foundation models will drive the prompt engineering tools market.

Major Market Trends & Insights

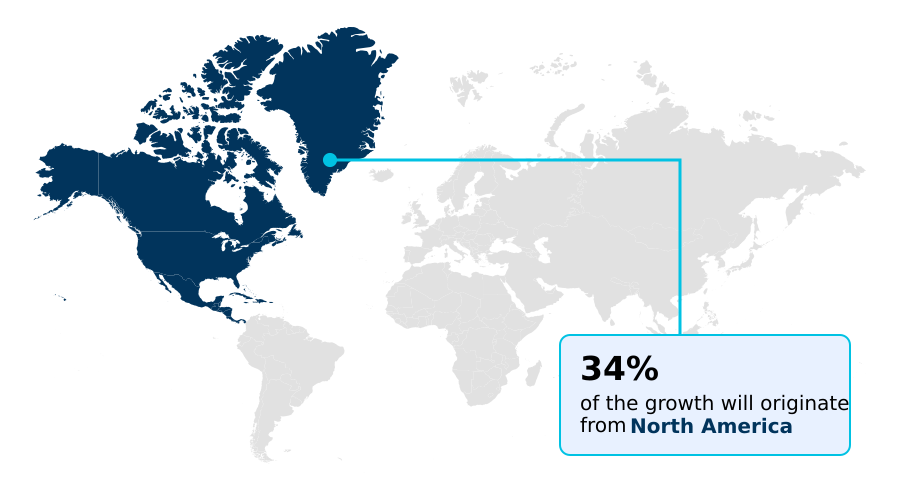
  • North America dominated the market and accounted for a 34.4% growth during the forecast period.
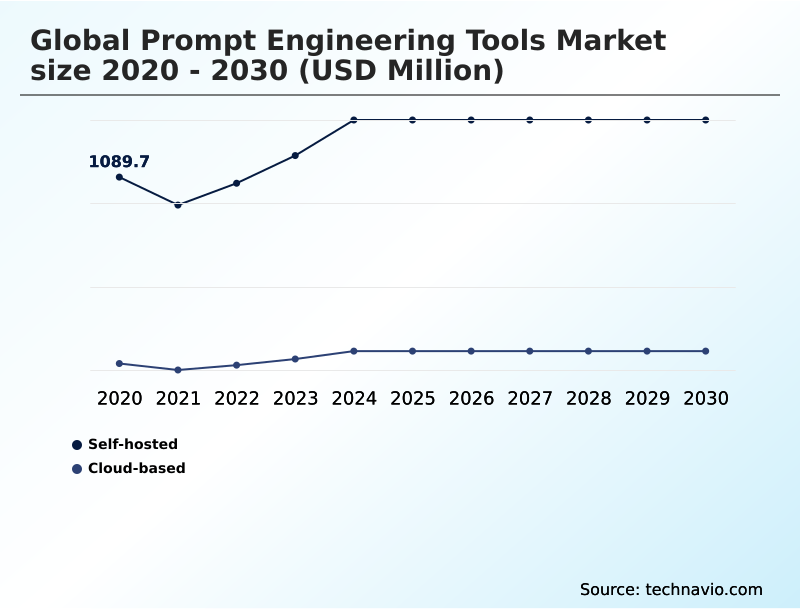
  • By Deployment - Self-hosted segment was valued at USD 1.35 billion in 2024
  • By Application - NLP enhancement segment accounted for the largest market revenue share in 2024

Market Size & Forecast

  • Market Opportunities: USD 3.20 billion
  • Market Future Opportunities: USD 2.63 billion
  • CAGR from 2025 to 2030 : 18.9%

Market Summary

  • The prompt engineering tools market is defined by a fundamental need to systematize interactions with powerful generative models. As organizations move beyond experimentation to deploy production-grade AI systems, the focus shifts to ensuring model response consistency and reliability.
  • This requires more than just crafting clever inputs; it demands a comprehensive approach to prompt lifecycle management, encompassing prompt A/B testing, version control, and performance analytics. For example, a financial services firm leveraging AI to generate compliance reports cannot tolerate variability or inaccuracies.
  • It must implement a context engineering framework with robust AI guardrail implementation to ensure every output is verifiable and safe. The adoption of specialized developer productivity tools and enterprise AI platforms is therefore not a luxury but a necessity for scalable AI development.
  • These platforms provide the AI model observability and governance needed to manage risk, optimize costs, and build secure AI applications, transforming an artisanal craft into a disciplined engineering practice.

What will be the Size of the Prompt Engineering Tools Market during the forecast period?

Get Key Insights on Market Forecast (PDF) Get Free Sample

How is the Prompt Engineering Tools Market Segmented?

The prompt engineering tools industry research report provides comprehensive data (region-wise segment analysis), with forecasts and estimates in "USD million" for the period 2026-2030, as well as historical data from 2020-2024 for the following segments.

  • Deployment
    • Self-hosted
    • Cloud-based
  • Application
    • NLP enhancement
    • Code generation
    • Multimodal systems
    • Others
  • Delivery mode
    • Prompt generation
    • Prompt optimization
    • Prompt debugging
    • Prompt storage and management
  • End-user
    • Enterprises
    • Developers and researchers
    • Educational institutions
    • Government and defense
  • Geography
    • North America
      • US
      • Canada
      • Mexico
    • Europe
      • Germany
      • UK
      • France
    • APAC
      • China
      • Japan
      • India
    • South America
      • Brazil
      • Argentina
    • Middle East and Africa
      • Saudi Arabia
      • UAE
      • South Africa
    • Rest of World (ROW)

By Deployment Insights

The self-hosted segment is estimated to witness significant growth during the forecast period.

The self-hosted deployment of prompt engineering tools addresses the critical needs of organizations requiring maximum control over their AI infrastructure.

This on-premises approach is driven by the necessity for unparalleled data governance, particularly within regulated sectors like finance and healthcare where keeping sensitive data, including proprietary prompts and model interactions, within the corporate network is non-negotiable.

This model of prompt library management offers extensive customization, allowing for deep integration with bespoke internal systems and existing security protocols, and some have reported a 15% reduction in compliance-related incidents.

While providing control over the AI development lifecycle, it necessitates significant upfront investment and a skilled internal IT team for ongoing maintenance, updates, and scaling, making it a strategic choice for large enterprises where the value of absolute security outweighs the operational overhead of production-grade AI systems and building trustworthy AI.

Get Free Sample

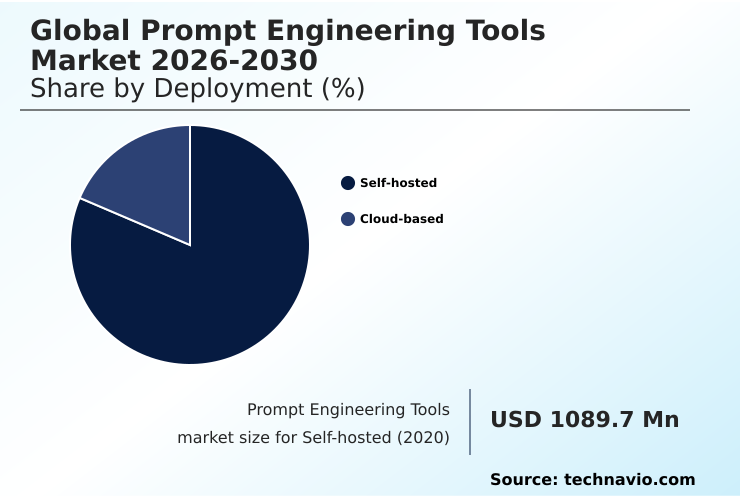
The Self-hosted segment was valued at USD 1.35 billion in 2024 and showed a gradual increase during the forecast period.

Get Free Sample

Regional Analysis

North America is estimated to contribute 34.4% to the growth of the global market during the forecast period.Technavio’s analysts have elaborately explained the regional trends and drivers that shape the market during the forecast period.

See How Prompt Engineering Tools Market Demand is Rising in North America Get Free Sample

The geographic landscape of the market is led by North America, where the high concentration of model developers and venture capital fuels innovation in enterprise AI platforms and model-agnostic tooling.

Europe’s market is distinctly shaped by a regulatory focus on creating responsible AI deployment and AI governance frameworks, mandating features like AI guardrail implementation and robust generative AI governance.

This has led to an adoption environment where secure AI applications are paramount.

Meanwhile, the APAC region is the most dynamic, driven by mobile-first adoption and government initiatives in countries like Singapore, which report a 25% improvement in multilingual content generation efficiency.

This regional diversity underscores the need for localized LLM integration strategies and a nuanced understanding of varying business priorities from building trustworthy AI to pure performance.

Market Dynamics

Our researchers analyzed the data with 2025 as the base year, along with the key drivers, trends, and challenges. A holistic analysis of drivers will help companies refine their marketing strategies to gain a competitive advantage.

  • As organizations mature in their AI adoption, the conversation shifts from basic implementation to sophisticated optimization, frequently beginning with the question of how to measure prompt engineering ROI. This leads to the adoption of specific tools for comparing large language models to select the optimal foundation for a given task.
  • Establishing best practices for enterprise prompt management becomes critical, moving beyond ad-hoc solutions to structured, auditable systems. A key part of this is addressing security through prompt injection attack mitigation techniques, which has become a non-negotiable for production systems. The complexity further increases when exploring prompt engineering for multimodal systems, where text, image, and data inputs must be orchestrated.
  • Teams are now automating prompt testing and validation to ensure consistency, integrating this process directly into their workflows. A core component of this advanced stage involves integrating prompt management into DevOps, treating prompts as first-class citizens in the software lifecycle. This is particularly vital for prompt engineering for regulated industries, where every interaction must be traceable.
  • For specific use cases, prompt engineering tools for code generation have demonstrated a two-fold increase in developer output compared to manual methods. This holistic approach, from initial setup to continuous improvement, defines the current state of advanced AI implementation.

What are the key market drivers leading to the rise in the adoption of Prompt Engineering Tools Industry?

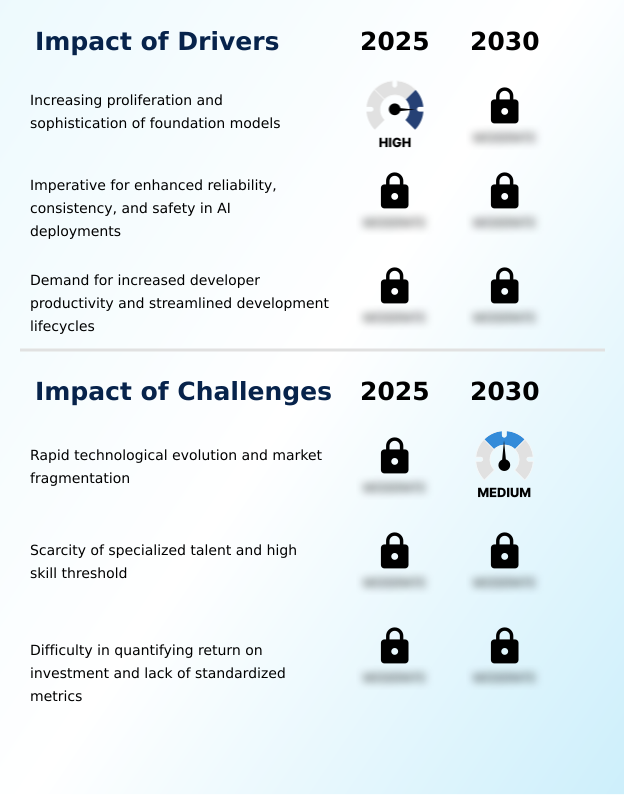
  • The increasing proliferation and sophistication of foundation models is a key driver for the prompt engineering tools market.

  • The market's rapid expansion is primarily fueled by the increasing complexity of the AI ecosystem and the enterprise-level demand for reliable, production-ready systems.
  • The proliferation of diverse foundation models creates significant challenges, as prompt sensitivity can cause output variance of up to 70% between platforms.
  • Specialized developer productivity tools providing functionalities like side-by-side model comparison and prompt A/B testing are critical for mitigating this variability. Moreover, the transition of generative AI to mission-critical roles necessitates predictable outcomes and adherence to responsible AI deployment.
  • Prompt engineering platforms offer essential governance capabilities, with some users reporting a 15% reduction in costs associated with generating non-compliant content, directly impacting the bottom line and accelerating AI development lifecycle.

What are the market trends shaping the Prompt Engineering Tools Industry?

  • The market is witnessing a significant trend toward automated and programmatic prompt optimization. This reflects a shift from manual crafting to systematic, algorithm-driven refinement.

  • The market is undergoing a definitive shift toward automation and deep integration, which are key to enabling scalable AI development. A significant trend is the move to automated and programmatic prompt optimization, where advanced prompt optimization services can improve response accuracy by over 20%. This evolution from manual crafting to a systematic, data-driven discipline signifies the industrialization of prompt engineering.
  • Concurrently, there is a strong push for deep integration with broader large language model operations and LLMOps frameworks. This convergence, incorporating robust prompt versioning systems and CI/CD pipeline integration, allows for automated testing and validation, which has been shown to reduce deployment errors by more than 50%. This holistic approach ensures greater governance, reproducibility, and scalability.

What challenges does the Prompt Engineering Tools Industry face during its growth?

  • The rapid technological evolution and fragmentation of the market present a key challenge to industry growth.

  • Key challenges restraining market growth include the hyper-evolution of underlying AI technology and a significant talent deficit. The constant introduction of new model architectures creates a risk of technological obsolescence, forcing tool providers into a resource-intensive cycle of adaptation.
  • Simultaneously, the scarcity of specialized talent is a major barrier, with job postings for prompt engineers increasing by over 300% in the last year, far outpacing the supply of qualified candidates. This is compounded by the difficulty in demonstrating a clear return on investment.
  • The absence of standardized metrics for evaluating prompt performance makes the value proposition appear subjective, though some firms using prompt engineering training and advanced tooling report a 15% reduction in project rework.

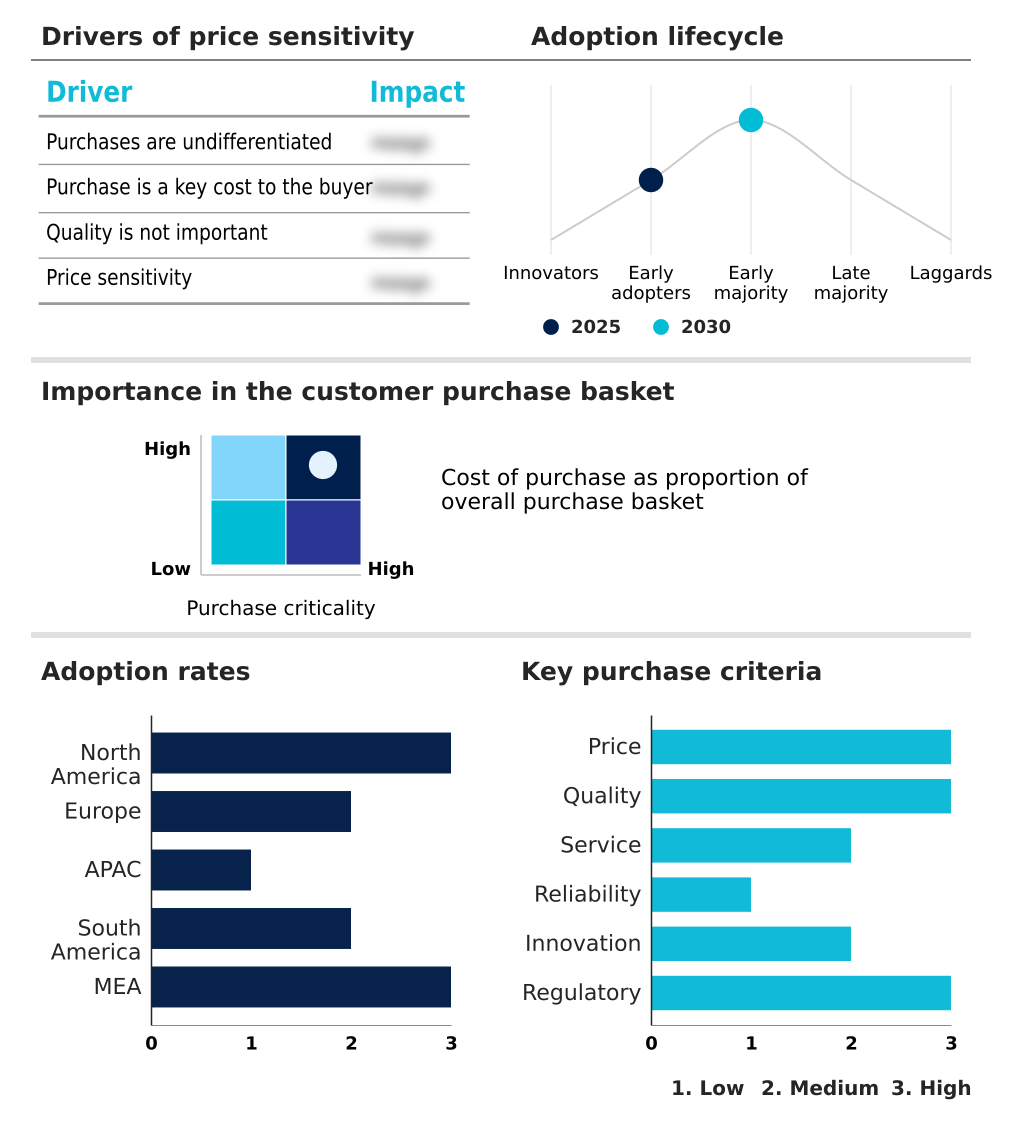
Exclusive Technavio Analysis on Customer Landscape

The prompt engineering tools market forecasting report includes the adoption lifecycle of the market, covering from the innovator’s stage to the laggard’s stage. It focuses on adoption rates in different regions based on penetration. Furthermore, the prompt engineering tools market report also includes key purchase criteria and drivers of price sensitivity to help companies evaluate and develop their market growth analysis strategies.

Customer Landscape of Prompt Engineering Tools Industry

Competitive Landscape

Companies are implementing various strategies, such as strategic alliances, prompt engineering tools market forecast, partnerships, mergers and acquisitions, geographical expansion, and product/service launches, to enhance their presence in the industry.

Agentatech UG - Specialized platforms and AI agent tools streamline workflow automation, enhancing operational efficiency through structured prompt engineering.

The industry research and growth report includes detailed analyses of the competitive landscape of the market and information about key companies, including:

  • Agentatech UG
  • Amazon Web Services Inc.
  • ArthurAI Inc.
  • Cohere
  • FlowGPT
  • Google LLC
  • Helicone Inc.
  • Humanloop Inc.
  • LangChain Inc.
  • LATITUDE S.L.
  • Microsoft Corp.
  • Orq.ai
  • Portkey Inc.
  • PromptBase
  • PromptLayer Inc.
  • PromptLoop
  • Promptmetheus
  • Scale AI
  • Vellum
  • Weights and Biases Inc.

Qualitative and quantitative analysis of companies has been conducted to help clients understand the wider business environment as well as the strengths and weaknesses of key industry players. Data is qualitatively analyzed to categorize companies as pure play, category-focused, industry-focused, and diversified; it is quantitatively analyzed to categorize companies as dominant, leading, strong, tentative, and weak.

Recent Development and News in Prompt engineering tools market

  • In February 2025, OpenAI released its GPT-4.5 (Orion) model, which featured significant improvements in factual consistency and complex instruction-following capabilities, impacting the requirements for prompt engineering.
  • In February 2025, Microsoft Corp. enhanced its Azure AI Studio with a feature named Prompt Flow Sentinel, designed to offer real-time monitoring and defense against prompt injection attacks for enterprise users.
  • In March 2025, Vellum introduced an Automated Prompt Synthesis capability that leverages a meta-model to autonomously generate and evaluate numerous prompt variations, accelerating the optimization lifecycle for developers.
  • In April 2025, a consortium including Microsoft, Google, and Anthropic announced the formation of the Enterprise Generative AI Alliance (E-GAIA) to establish standardized best practices and interoperable frameworks for managing large language models in corporate environments.

Dive into Technavio’s robust research methodology, blending expert interviews, extensive data synthesis, and validated models for unparalleled Prompt Engineering Tools Market insights. See full methodology.

Market Scope
Page number 321
Base year 2025
Historic period 2020-2024
Forecast period 2026-2030
Growth momentum & CAGR Accelerate at a CAGR of 18.9%
Market growth 2026-2030 USD 2629.2 million
Market structure Fragmented
YoY growth 2025-2026(%) 16.4%
Key countries US, Canada, Mexico, Germany, UK, France, Italy, Spain, The Netherlands, China, Japan, India, South Korea, Australia, Indonesia, Brazil, Argentina, Chile, Saudi Arabia, UAE, South Africa, Israel and Turkey
Competitive landscape Leading Companies, Market Positioning of Companies, Competitive Strategies, and Industry Risks

Request Free Sample

Research Analyst Overview

  • The market's evolution is marked by a decisive pivot towards integrated, enterprise-grade solutions that treat prompt engineering as a core engineering discipline. The proliferation of diverse models necessitates sophisticated model-agnostic tooling and comprehensive prompt library management to maintain control and efficiency.
  • This trend toward large language model operations is a direct response to boardroom demands for quantifiable ROI and robust generative AI governance, connecting development efforts to strategic business outcomes. Advanced platforms now incorporate prompt optimization algorithms and automated prompt evaluation, moving beyond simple creation to focus on performance.
  • For instance, firms adopting integrated prompt management frameworks report a 40% faster deployment cycle for new AI features. This disciplined approach, incorporating CI/CD pipeline integration, adversarial testing for LLMs, and detailed prompt performance analytics, is essential for building production-grade AI systems.
  • The ability to ensure model response consistency and manage the full prompt lifecycle is no longer an option but a requirement for any organization serious about leveraging AI at scale. Effective model behavior analysis and a strong context engineering framework are central to achieving this goal.

What are the Key Data Covered in this Prompt Engineering Tools Market Research and Growth Report?

  • What is the expected growth of the Prompt Engineering Tools Market between 2026 and 2030?

    • USD 2.63 billion, at a CAGR of 18.9%

  • What segmentation does the market report cover?

    • The report is segmented by Deployment (Self-hosted, and Cloud-based), Application (NLP enhancement, Code generation, Multimodal systems, and Others), Delivery Mode (Prompt generation, Prompt optimization, Prompt debugging, and Prompt storage and management), End-user (Enterprises, Developers and researchers, Educational institutions, and Government and defense) and Geography (North America, Europe, APAC, South America, Middle East and Africa)

  • Which regions are analyzed in the report?

    • North America, Europe, APAC, South America and Middle East and Africa

  • What are the key growth drivers and market challenges?

    • Increasing proliferation and sophistication of foundation models, Rapid technological evolution and market fragmentation

  • Who are the major players in the Prompt Engineering Tools Market?

    • Agentatech UG, Amazon Web Services Inc., ArthurAI Inc., Cohere, FlowGPT, Google LLC, Helicone Inc., Humanloop Inc., LangChain Inc., LATITUDE S.L., Microsoft Corp., Orq.ai, Portkey Inc., PromptBase, PromptLayer Inc., PromptLoop, Promptmetheus, Scale AI, Vellum and Weights and Biases Inc.

Market Research Insights

  • Market dynamics are shaped by the dual pressures of rapid innovation and the enterprise need for control. Organizations are leveraging prompt management platforms to implement prompt engineering best practices, leading to a reported 25% improvement in AI application reliability.
  • As firms pursue scalable AI development, they find that a systematic approach to managing LLM outputs and prompt engineering workflows reduces model-related errors by over 40%. The drive for LLM cost optimization is also critical, with some platforms demonstrating an 18% reduction in token consumption through automated refinement.
  • These tools are central to building enterprise generative AI solutions that are not only powerful but also adhere to stringent AI governance frameworks.

We can help! Our analysts can customize this prompt engineering tools market research report to meet your requirements.

Get in touch

1. Executive Summary

1.1 Market overview

Executive Summary - Chart on Market Overview
Executive Summary - Data Table on Market Overview
Executive Summary - Chart on Global Market Characteristics
Executive Summary - Chart on Market by Geography
Executive Summary - Chart on Market Segmentation by Deployment
Executive Summary - Chart on Market Segmentation by Application
Executive Summary - Chart on Market Segmentation by Delivery Mode
Executive Summary - Chart on Market Segmentation by End-user
Executive Summary - Chart on Incremental Growth
Executive Summary - Data Table on Incremental Growth
Executive Summary - Chart on Company Market Positioning

2. Technavio Analysis

2.1 Analysis of price sensitivity, lifecycle, customer purchase basket, adoption rates, and purchase criteria

2.2 Criticality of inputs and Factors of differentiation

Chart on Overview on criticality of inputs and factors of differentiation

2.3 Factors of disruption

Chart on Overview on factors of disruption

2.4 Impact of drivers and challenges

Chart on Impact of drivers and challenges in 2025 and 2030

3. Market Landscape

3.1 Market ecosystem

Chart on Parent Market
Data Table on - Parent Market

3.2 Market characteristics

Chart on Market characteristics analysis

3.3 Value chain analysis

Chart on Value chain analysis

4. Market Sizing

4.1 Market definition

Data Table on Offerings of companies included in the market definition

4.2 Market segment analysis

Market segments

4.3 Market size 2025

4.4 Market outlook: Forecast for 2025-2030

Chart on Global - Market size and forecast 2025-2030 ($ million)
Data Table on Global - Market size and forecast 2025-2030 ($ million)
Chart on Global Market: Year-over-year growth 2025-2030 (%)
Data Table on Global Market: Year-over-year growth 2025-2030 (%)

5. Historic Market Size

5.1 Global Prompt Engineering Tools Market 2020 - 2024

Historic Market Size - Data Table on Global Prompt Engineering Tools Market 2020 - 2024 ($ million)

5.2 Deployment segment analysis 2020 - 2024

Historic Market Size - Deployment Segment 2020 - 2024 ($ million)

5.3 Application segment analysis 2020 - 2024

Historic Market Size - Application Segment 2020 - 2024 ($ million)

5.4 Delivery Mode segment analysis 2020 - 2024

Historic Market Size - Delivery Mode Segment 2020 - 2024 ($ million)

5.5 End-user segment analysis 2020 - 2024

Historic Market Size - End-user Segment 2020 - 2024 ($ million)

5.6 Geography segment analysis 2020 - 2024

Historic Market Size - Geography Segment 2020 - 2024 ($ million)

5.7 Country segment analysis 2020 - 2024

Historic Market Size - Country Segment 2020 - 2024 ($ million)

6. Qualitative Analysis

6.1 Impact of AI on global prompt engineering tools market

6.2 Impact of geopolitical conflicts on global prompt engineering tools market

7. Five Forces Analysis

7.1 Five forces summary

Five forces analysis - Comparison between 2025 and 2030

7.2 Bargaining power of buyers

Bargaining power of buyers - Impact of key factors 2025 and 2030

7.3 Bargaining power of suppliers

Bargaining power of suppliers - Impact of key factors in 2025 and 2030

7.4 Threat of new entrants

Threat of new entrants - Impact of key factors in 2025 and 2030

7.5 Threat of substitutes

Threat of substitutes - Impact of key factors in 2025 and 2030

7.6 Threat of rivalry

Threat of rivalry - Impact of key factors in 2025 and 2030

7.7 Market condition

Chart on Market condition - Five forces 2025 and 2030

8. Market Segmentation by Deployment

8.1 Market segments

Chart on Deployment - Market share 2025-2030 (%)
Data Table on Deployment - Market share 2025-2030 (%)

8.2 Comparison by Deployment

Chart on Comparison by Deployment
Data Table on Comparison by Deployment

8.3 Self-hosted - Market size and forecast 2025-2030

Chart on Self-hosted - Market size and forecast 2025-2030 ($ million)
Data Table on Self-hosted - Market size and forecast 2025-2030 ($ million)
Chart on Self-hosted - Year-over-year growth 2025-2030 (%)
Data Table on Self-hosted - Year-over-year growth 2025-2030 (%)

8.4 Cloud-based - Market size and forecast 2025-2030

Chart on Cloud-based - Market size and forecast 2025-2030 ($ million)
Data Table on Cloud-based - Market size and forecast 2025-2030 ($ million)
Chart on Cloud-based - Year-over-year growth 2025-2030 (%)
Data Table on Cloud-based - Year-over-year growth 2025-2030 (%)

8.5 Market opportunity by Deployment

Market opportunity by Deployment ($ million)
Data Table on Market opportunity by Deployment ($ million)

9. Market Segmentation by Application

9.1 Market segments

Chart on Application - Market share 2025-2030 (%)
Data Table on Application - Market share 2025-2030 (%)

9.2 Comparison by Application

Chart on Comparison by Application
Data Table on Comparison by Application

9.3 NLP enhancement - Market size and forecast 2025-2030

Chart on NLP enhancement - Market size and forecast 2025-2030 ($ million)
Data Table on NLP enhancement - Market size and forecast 2025-2030 ($ million)
Chart on NLP enhancement - Year-over-year growth 2025-2030 (%)
Data Table on NLP enhancement - Year-over-year growth 2025-2030 (%)

9.4 Code generation - Market size and forecast 2025-2030

Chart on Code generation - Market size and forecast 2025-2030 ($ million)
Data Table on Code generation - Market size and forecast 2025-2030 ($ million)
Chart on Code generation - Year-over-year growth 2025-2030 (%)
Data Table on Code generation - Year-over-year growth 2025-2030 (%)

9.5 Multimodal systems - Market size and forecast 2025-2030

Chart on Multimodal systems - Market size and forecast 2025-2030 ($ million)
Data Table on Multimodal systems - Market size and forecast 2025-2030 ($ million)
Chart on Multimodal systems - Year-over-year growth 2025-2030 (%)
Data Table on Multimodal systems - Year-over-year growth 2025-2030 (%)

9.6 Others - Market size and forecast 2025-2030

Chart on Others - Market size and forecast 2025-2030 ($ million)
Data Table on Others - Market size and forecast 2025-2030 ($ million)
Chart on Others - Year-over-year growth 2025-2030 (%)
Data Table on Others - Year-over-year growth 2025-2030 (%)

9.7 Market opportunity by Application

Market opportunity by Application ($ million)
Data Table on Market opportunity by Application ($ million)

10. Market Segmentation by Delivery Mode

10.1 Market segments

Chart on Delivery Mode - Market share 2025-2030 (%)
Data Table on Delivery Mode - Market share 2025-2030 (%)

10.2 Comparison by Delivery Mode

Chart on Comparison by Delivery Mode
Data Table on Comparison by Delivery Mode

10.3 Prompt generation - Market size and forecast 2025-2030

Chart on Prompt generation - Market size and forecast 2025-2030 ($ million)
Data Table on Prompt generation - Market size and forecast 2025-2030 ($ million)
Chart on Prompt generation - Year-over-year growth 2025-2030 (%)
Data Table on Prompt generation - Year-over-year growth 2025-2030 (%)

10.4 Prompt optimization - Market size and forecast 2025-2030

Chart on Prompt optimization - Market size and forecast 2025-2030 ($ million)
Data Table on Prompt optimization - Market size and forecast 2025-2030 ($ million)
Chart on Prompt optimization - Year-over-year growth 2025-2030 (%)
Data Table on Prompt optimization - Year-over-year growth 2025-2030 (%)

10.5 Prompt debugging - Market size and forecast 2025-2030

Chart on Prompt debugging - Market size and forecast 2025-2030 ($ million)
Data Table on Prompt debugging - Market size and forecast 2025-2030 ($ million)
Chart on Prompt debugging - Year-over-year growth 2025-2030 (%)
Data Table on Prompt debugging - Year-over-year growth 2025-2030 (%)

10.6 Prompt storage and management - Market size and forecast 2025-2030

Chart on Prompt storage and management - Market size and forecast 2025-2030 ($ million)
Data Table on Prompt storage and management - Market size and forecast 2025-2030 ($ million)
Chart on Prompt storage and management - Year-over-year growth 2025-2030 (%)
Data Table on Prompt storage and management - Year-over-year growth 2025-2030 (%)

10.7 Market opportunity by Delivery Mode

Market opportunity by Delivery Mode ($ million)
Data Table on Market opportunity by Delivery Mode ($ million)

11. Market Segmentation by End-user

11.1 Market segments

Chart on End-user - Market share 2025-2030 (%)
Data Table on End-user - Market share 2025-2030 (%)

11.2 Comparison by End-user

Chart on Comparison by End-user
Data Table on Comparison by End-user

11.3 Enterprises - Market size and forecast 2025-2030

Chart on Enterprises - Market size and forecast 2025-2030 ($ million)
Data Table on Enterprises - Market size and forecast 2025-2030 ($ million)
Chart on Enterprises - Year-over-year growth 2025-2030 (%)
Data Table on Enterprises - Year-over-year growth 2025-2030 (%)

11.4 Developers and researchers - Market size and forecast 2025-2030

Chart on Developers and researchers - Market size and forecast 2025-2030 ($ million)
Data Table on Developers and researchers - Market size and forecast 2025-2030 ($ million)
Chart on Developers and researchers - Year-over-year growth 2025-2030 (%)
Data Table on Developers and researchers - Year-over-year growth 2025-2030 (%)

11.5 Educational institutions - Market size and forecast 2025-2030

Chart on Educational institutions - Market size and forecast 2025-2030 ($ million)
Data Table on Educational institutions - Market size and forecast 2025-2030 ($ million)
Chart on Educational institutions - Year-over-year growth 2025-2030 (%)
Data Table on Educational institutions - Year-over-year growth 2025-2030 (%)

11.6 Government and defense - Market size and forecast 2025-2030

Chart on Government and defense - Market size and forecast 2025-2030 ($ million)
Data Table on Government and defense - Market size and forecast 2025-2030 ($ million)
Chart on Government and defense - Year-over-year growth 2025-2030 (%)
Data Table on Government and defense - Year-over-year growth 2025-2030 (%)

11.7 Market opportunity by End-user

Market opportunity by End-user ($ million)
Data Table on Market opportunity by End-user ($ million)

12. Customer Landscape

12.1 Customer landscape overview

Analysis of price sensitivity, lifecycle, customer purchase basket, adoption rates, and purchase criteria

13. Geographic Landscape

13.1 Geographic segmentation

Chart on Market share by geography 2025-2030 (%)
Data Table on Market share by geography 2025-2030 (%)

13.2 Geographic comparison

Chart on Geographic comparison
Data Table on Geographic comparison

13.3 North America - Market size and forecast 2025-2030

Chart on North America - Market size and forecast 2025-2030 ($ million)
Data Table on North America - Market size and forecast 2025-2030 ($ million)
Chart on North America - Year-over-year growth 2025-2030 (%)
Data Table on North America - Year-over-year growth 2025-2030 (%)
Chart on Regional Comparison - North America
Data Table on Regional Comparison - North America

13.3.1 US - Market size and forecast 2025-2030

Chart on US - Market size and forecast 2025-2030 ($ million)
Data Table on US - Market size and forecast 2025-2030 ($ million)
Chart on US - Year-over-year growth 2025-2030 (%)
Data Table on US - Year-over-year growth 2025-2030 (%)

13.3.2 Canada - Market size and forecast 2025-2030

Chart on Canada - Market size and forecast 2025-2030 ($ million)
Data Table on Canada - Market size and forecast 2025-2030 ($ million)
Chart on Canada - Year-over-year growth 2025-2030 (%)
Data Table on Canada - Year-over-year growth 2025-2030 (%)

13.3.3 Mexico - Market size and forecast 2025-2030

Chart on Mexico - Market size and forecast 2025-2030 ($ million)
Data Table on Mexico - Market size and forecast 2025-2030 ($ million)
Chart on Mexico - Year-over-year growth 2025-2030 (%)
Data Table on Mexico - Year-over-year growth 2025-2030 (%)

13.4 Europe - Market size and forecast 2025-2030

Chart on Europe - Market size and forecast 2025-2030 ($ million)
Data Table on Europe - Market size and forecast 2025-2030 ($ million)
Chart on Europe - Year-over-year growth 2025-2030 (%)
Data Table on Europe - Year-over-year growth 2025-2030 (%)
Chart on Regional Comparison - Europe
Data Table on Regional Comparison - Europe

13.4.1 Germany - Market size and forecast 2025-2030

Chart on Germany - Market size and forecast 2025-2030 ($ million)
Data Table on Germany - Market size and forecast 2025-2030 ($ million)
Chart on Germany - Year-over-year growth 2025-2030 (%)
Data Table on Germany - Year-over-year growth 2025-2030 (%)

13.4.2 UK - Market size and forecast 2025-2030

Chart on UK - Market size and forecast 2025-2030 ($ million)
Data Table on UK - Market size and forecast 2025-2030 ($ million)
Chart on UK - Year-over-year growth 2025-2030 (%)
Data Table on UK - Year-over-year growth 2025-2030 (%)

13.4.3 France - Market size and forecast 2025-2030

Chart on France - Market size and forecast 2025-2030 ($ million)
Data Table on France - Market size and forecast 2025-2030 ($ million)
Chart on France - Year-over-year growth 2025-2030 (%)
Data Table on France - Year-over-year growth 2025-2030 (%)

13.4.4 Italy - Market size and forecast 2025-2030

Chart on Italy - Market size and forecast 2025-2030 ($ million)
Data Table on Italy - Market size and forecast 2025-2030 ($ million)
Chart on Italy - Year-over-year growth 2025-2030 (%)
Data Table on Italy - Year-over-year growth 2025-2030 (%)

13.4.5 Spain - Market size and forecast 2025-2030

Chart on Spain - Market size and forecast 2025-2030 ($ million)
Data Table on Spain - Market size and forecast 2025-2030 ($ million)
Chart on Spain - Year-over-year growth 2025-2030 (%)
Data Table on Spain - Year-over-year growth 2025-2030 (%)

13.4.6 The Netherlands - Market size and forecast 2025-2030

Chart on The Netherlands - Market size and forecast 2025-2030 ($ million)
Data Table on The Netherlands - Market size and forecast 2025-2030 ($ million)
Chart on The Netherlands - Year-over-year growth 2025-2030 (%)
Data Table on The Netherlands - Year-over-year growth 2025-2030 (%)

13.5 APAC - Market size and forecast 2025-2030

Chart on APAC - Market size and forecast 2025-2030 ($ million)
Data Table on APAC - Market size and forecast 2025-2030 ($ million)
Chart on APAC - Year-over-year growth 2025-2030 (%)
Data Table on APAC - Year-over-year growth 2025-2030 (%)
Chart on Regional Comparison - APAC
Data Table on Regional Comparison - APAC

13.5.1 China - Market size and forecast 2025-2030

Chart on China - Market size and forecast 2025-2030 ($ million)
Data Table on China - Market size and forecast 2025-2030 ($ million)
Chart on China - Year-over-year growth 2025-2030 (%)
Data Table on China - Year-over-year growth 2025-2030 (%)

13.5.2 Japan - Market size and forecast 2025-2030

Chart on Japan - Market size and forecast 2025-2030 ($ million)
Data Table on Japan - Market size and forecast 2025-2030 ($ million)
Chart on Japan - Year-over-year growth 2025-2030 (%)
Data Table on Japan - Year-over-year growth 2025-2030 (%)

13.5.3 India - Market size and forecast 2025-2030

Chart on India - Market size and forecast 2025-2030 ($ million)
Data Table on India - Market size and forecast 2025-2030 ($ million)
Chart on India - Year-over-year growth 2025-2030 (%)
Data Table on India - Year-over-year growth 2025-2030 (%)

13.5.4 South Korea - Market size and forecast 2025-2030

Chart on South Korea - Market size and forecast 2025-2030 ($ million)
Data Table on South Korea - Market size and forecast 2025-2030 ($ million)
Chart on South Korea - Year-over-year growth 2025-2030 (%)
Data Table on South Korea - Year-over-year growth 2025-2030 (%)

13.5.5 Australia - Market size and forecast 2025-2030

Chart on Australia - Market size and forecast 2025-2030 ($ million)
Data Table on Australia - Market size and forecast 2025-2030 ($ million)
Chart on Australia - Year-over-year growth 2025-2030 (%)
Data Table on Australia - Year-over-year growth 2025-2030 (%)

13.5.6 Indonesia - Market size and forecast 2025-2030

Chart on Indonesia - Market size and forecast 2025-2030 ($ million)
Data Table on Indonesia - Market size and forecast 2025-2030 ($ million)
Chart on Indonesia - Year-over-year growth 2025-2030 (%)
Data Table on Indonesia - Year-over-year growth 2025-2030 (%)

13.6 South America - Market size and forecast 2025-2030

Chart on South America - Market size and forecast 2025-2030 ($ million)
Data Table on South America - Market size and forecast 2025-2030 ($ million)
Chart on South America - Year-over-year growth 2025-2030 (%)
Data Table on South America - Year-over-year growth 2025-2030 (%)
Chart on Regional Comparison - South America
Data Table on Regional Comparison - South America

13.6.1 Brazil - Market size and forecast 2025-2030

Chart on Brazil - Market size and forecast 2025-2030 ($ million)
Data Table on Brazil - Market size and forecast 2025-2030 ($ million)
Chart on Brazil - Year-over-year growth 2025-2030 (%)
Data Table on Brazil - Year-over-year growth 2025-2030 (%)

13.6.2 Argentina - Market size and forecast 2025-2030

Chart on Argentina - Market size and forecast 2025-2030 ($ million)
Data Table on Argentina - Market size and forecast 2025-2030 ($ million)
Chart on Argentina - Year-over-year growth 2025-2030 (%)
Data Table on Argentina - Year-over-year growth 2025-2030 (%)

13.6.3 Chile - Market size and forecast 2025-2030

Chart on Chile - Market size and forecast 2025-2030 ($ million)
Data Table on Chile - Market size and forecast 2025-2030 ($ million)
Chart on Chile - Year-over-year growth 2025-2030 (%)
Data Table on Chile - Year-over-year growth 2025-2030 (%)

13.7 Middle East and Africa - Market size and forecast 2025-2030

Chart on Middle East and Africa - Market size and forecast 2025-2030 ($ million)
Data Table on Middle East and Africa - Market size and forecast 2025-2030 ($ million)
Chart on Middle East and Africa - Year-over-year growth 2025-2030 (%)
Data Table on Middle East and Africa - Year-over-year growth 2025-2030 (%)
Chart on Regional Comparison - Middle East and Africa
Data Table on Regional Comparison - Middle East and Africa

13.7.1 Saudi Arabia - Market size and forecast 2025-2030

Chart on Saudi Arabia - Market size and forecast 2025-2030 ($ million)
Data Table on Saudi Arabia - Market size and forecast 2025-2030 ($ million)
Chart on Saudi Arabia - Year-over-year growth 2025-2030 (%)
Data Table on Saudi Arabia - Year-over-year growth 2025-2030 (%)

13.7.2 UAE - Market size and forecast 2025-2030

Chart on UAE - Market size and forecast 2025-2030 ($ million)
Data Table on UAE - Market size and forecast 2025-2030 ($ million)
Chart on UAE - Year-over-year growth 2025-2030 (%)
Data Table on UAE - Year-over-year growth 2025-2030 (%)

13.7.3 South Africa - Market size and forecast 2025-2030

Chart on South Africa - Market size and forecast 2025-2030 ($ million)
Data Table on South Africa - Market size and forecast 2025-2030 ($ million)
Chart on South Africa - Year-over-year growth 2025-2030 (%)
Data Table on South Africa - Year-over-year growth 2025-2030 (%)

13.7.4 Israel - Market size and forecast 2025-2030

Chart on Israel - Market size and forecast 2025-2030 ($ million)
Data Table on Israel - Market size and forecast 2025-2030 ($ million)
Chart on Israel - Year-over-year growth 2025-2030 (%)
Data Table on Israel - Year-over-year growth 2025-2030 (%)

13.7.5 Turkey - Market size and forecast 2025-2030

Chart on Turkey - Market size and forecast 2025-2030 ($ million)
Data Table on Turkey - Market size and forecast 2025-2030 ($ million)
Chart on Turkey - Year-over-year growth 2025-2030 (%)
Data Table on Turkey - Year-over-year growth 2025-2030 (%)

13.8 Market opportunity by geography

Market opportunity by geography ($ million)
Data Tables on Market opportunity by geography ($ million)

14. Drivers, Challenges, and Opportunity

14.1 Market drivers

Increasing proliferation and sophistication of foundation models
Imperative for enhanced reliability, consistency, and safety in AI deployments
Demand for increased developer productivity and streamlined development lifecycles

14.2 Market challenges

Rapid technological evolution and market fragmentation
Scarcity of specialized talent and high skill threshold
Difficulty in quantifying return on investment and lack of standardized metrics

14.3 Impact of drivers and challenges

Impact of drivers and challenges in 2025 and 2030

14.4 Market opportunities

Emergence of automated and programmatic prompt optimization
Deep integration with enterprise MLOps and LLMOps frameworks
Increasing demand for model-agnostic and multi-modal tooling

15. Competitive Landscape

15.1 Overview

15.2

Overview on criticality of inputs and factors of differentiation

15.3 Landscape disruption

Overview on factors of disruption

15.4 Industry risks

Impact of key risks on business

16. Competitive Analysis

16.1 Companies profiled

Companies covered

16.2 Company ranking index

16.3 Market positioning of companies

Matrix on companies position and classification

16.4 Agentatech UG

Agentatech UG - Overview
Agentatech UG - Product / Service
Agentatech UG - Key offerings
SWOT

16.5 Amazon Web Services Inc.

Amazon Web Services Inc. - Overview
Amazon Web Services Inc. - Product / Service
Amazon Web Services Inc. - Key offerings
SWOT

16.6 Cohere

Cohere - Overview
Cohere - Product / Service
Cohere - Key offerings
SWOT

16.7 Google LLC

Google LLC - Overview
Google LLC - Product / Service
Google LLC - Key offerings
SWOT

16.8 Helicone Inc.

Helicone Inc. - Overview
Helicone Inc. - Product / Service
Helicone Inc. - Key offerings
SWOT

16.9 Humanloop Inc.

Humanloop Inc. - Overview
Humanloop Inc. - Product / Service
Humanloop Inc. - Key offerings
SWOT

16.10 LangChain Inc.

LangChain Inc. - Overview
LangChain Inc. - Product / Service
LangChain Inc. - Key offerings
SWOT

16.11 Microsoft Corp.

Microsoft Corp. - Overview
Microsoft Corp. - Business segments
Microsoft Corp. - Key news
Microsoft Corp. - Key offerings
Microsoft Corp. - Segment focus
SWOT

16.12 Orq.ai

Orq.ai - Overview
Orq.ai - Product / Service
Orq.ai - Key offerings
SWOT

16.13 Portkey Inc.

Portkey Inc. - Overview
Portkey Inc. - Product / Service
Portkey Inc. - Key offerings
SWOT

16.14 PromptBase

PromptBase - Overview
PromptBase - Product / Service
PromptBase - Key offerings
SWOT

16.15 PromptLayer Inc.

PromptLayer Inc. - Overview
PromptLayer Inc. - Product / Service
PromptLayer Inc. - Key offerings
SWOT

16.16 PromptLoop

PromptLoop - Overview
PromptLoop - Product / Service
PromptLoop - Key offerings
SWOT

16.17 Vellum

Vellum - Overview
Vellum - Product / Service
Vellum - Key offerings
SWOT

16.18 Weights and Biases Inc.

Weights and Biases Inc. - Overview
Weights and Biases Inc. - Product / Service
Weights and Biases Inc. - Key offerings
SWOT

17. Appendix

17.1 Scope of the report

Market definition
Objectives
Notes and caveats

17.2 Inclusions and exclusions checklist

Inclusions checklist
Exclusions checklist

17.3 Currency conversion rates for US$

17.4 Research methodology

17.5 Data procurement

Information sources

17.6 Data validation

17.7 Validation techniques employed for market sizing

17.8 Data synthesis

17.9 360 degree market analysis

17.10 List of abbreviations

Research Methodology

Technavio presents a detailed picture of the market by way of study, synthesis, and summation of data from multiple sources. The analysts have presented the various facets of the market with a particular focus on identifying the key industry influencers. The data thus presented is comprehensive, reliable, and the result of extensive research, both primary and secondary.

INFORMATION SOURCES

Primary sources

  • Manufacturers and suppliers
  • Channel partners
  • Industry experts
  • Strategic decision makers

Secondary sources

  • Industry journals and periodicals
  • Government data
  • Financial reports of key industry players
  • Historical data
  • Press releases

DATA ANALYSIS

Data Synthesis

  • Collation of data
  • Estimation of key figures
  • Analysis of derived insights

Data Validation

  • Triangulation with data models
  • Reference against proprietary databases
  • Corroboration with industry experts

REPORT WRITING

Qualitative

  • Market drivers
  • Market challenges
  • Market trends
  • Five forces analysis

Quantitative

  • Market size and forecast
  • Market segmentation
  • Geographical insights
  • Competitive landscape

Interested in this report?

Get your sample now to see our research methodology and insights!

Download Now

Frequently Asked Questions

Prompt Engineering Tools market growth will increase by USD 2629.2 million during 2026-2030.

The Prompt Engineering Tools market is expected to grow at a CAGR of 18.9% during 2026-2030.

Prompt Engineering Tools market is segmented by Deployment (Self-hosted, Cloud-based) Application (NLP enhancement, Code generation, Multimodal systems, Others) Delivery mode (Prompt generation, Prompt optimization, Prompt debugging, Prompt storage and management) End-user (Enterprises, Developers and researchers, Educational institutions, Government and defense)

Agentatech UG, Amazon Web Services Inc., ArthurAI Inc., Cohere, FlowGPT, Google LLC, Helicone Inc., Humanloop Inc., LangChain Inc., LATITUDE S.L., Microsoft Corp., Orq.ai, Portkey Inc., PromptBase, PromptLayer Inc., PromptLoop, Promptmetheus, Scale AI, Vellum, Weights and Biases Inc. are a few of the key vendors in the Prompt Engineering Tools market.

North America will register the highest growth rate of 34.4% among the other regions. Therefore, the Prompt Engineering Tools market in North America is expected to garner significant business opportunities for the vendors during the forecast period.

US, Canada, Mexico, Germany, UK, France, Italy, Spain, The Netherlands, China, Japan, India, South Korea, Australia, Indonesia, Brazil, Argentina, Chile, Saudi Arabia, UAE, South Africa, Israel, Turkey

  • Increasing proliferation and sophistication of foundation models is the driving factor this market.

The Prompt Engineering Tools market vendors should focus on grabbing business opportunities from the Deployment segment as it accounted for the largest market share in the base year.
RIA - Research AI Assistant
Ask RIA