North America Proppants Market Size 2024-2028
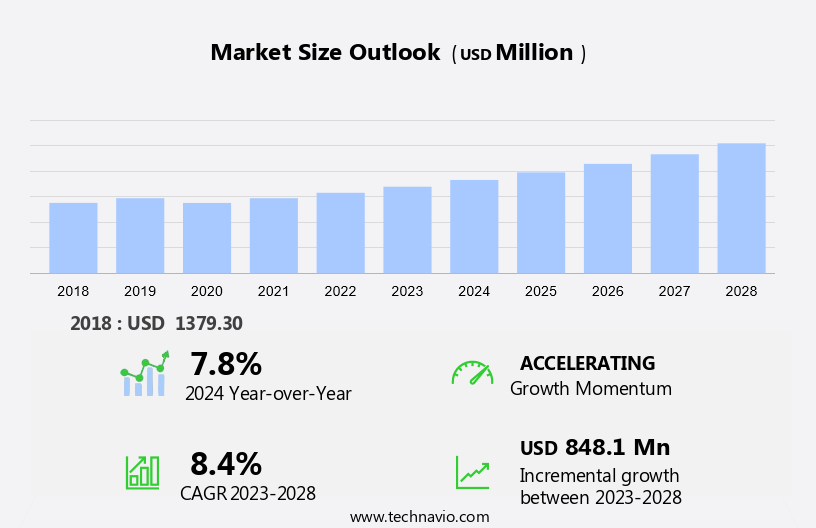
The North America proppants market size is forecast to increase by USD 848.1 million, at a CAGR of 8.4% between 2023 and 2028.
- The market is experiencing significant growth due to the increasing demand for fine mesh raw frac sand in hydraululic fracturing processes. This trend is driven by the ongoing expansion of the shale gas industry. Additionally, technological advancements in the hydraulic fracturing process are leading to the use of alternative proppants such as ceramics and sintered bauxite. However, closure stresses and fracture conductivity remain key challenges in the market. Environmental concerns, particularly water contamination, are also pressing issues that are prompting the exploration of recycled proppants and biodegradable polymers as potential solutions. Overall, the proppants market is witnessing continuous evolution as industry players seek to address these challenges and meet the demands of the shale gas industry.
What will be the size of the market during the forecast period?
- The market plays a crucial role in the hydraulic fracturing process, which is a widely used technique for extracting hydrocarbons from shale formations. Proppants are essential in maintaining hydrocarbon flow by keeping the fractures in shale rock open after the hydraulic fracturing process. Hydrocarbons, including natural gas and tight gas, are extracted from shale formations using hydraulic fracturing. Proppants, such as resin-coated, ceramic, and lightweight varieties, are used to keep the fractures open despite closure stresses. These proppants offer varying properties, including crush resistance, hydrocarbon flow enhancement, and improved embedment. Ceramic proppants, made from sintered bauxite, are known for their high crush resistance and durability. They have been widely used in the industry due to their ability to withstand the harsh conditions of hydraulic fracturing.
- Silica proppants, on the other hand, offer advantages such as low cost and good hydrocarbon flow properties. Proppant technology continues to evolve, with the development of advanced proppants, such as ultra-lightweight varieties. These proppants offer improved performance and cost savings by reducing the amount of proppants required for effective fracturing. The use of proppants in hydraulic fracturing has been a subject of controversy due to concerns over water contamination and seismic activity. However, advancements in proppant technology, such as the use of natural proppants and man-made proppants with reduced environmental impact, are being explored to mitigate these concerns. Silica dust, a byproduct of silica sand proppants, is a health concern for workers involved in the hydraulic fracturing process.
How is this market segmented and which is the largest segment?
The market research report provides comprehensive data (region-wise segment analysis), with forecasts and estimates in "USD million" for the period 2024-2028, as well as historical data from 2018-2022 for the following segments.
- Type
- Regular sand
- Resin-coated
- Ceramic
- Geography
- North America
- Canada
- Mexico
- US
- North America
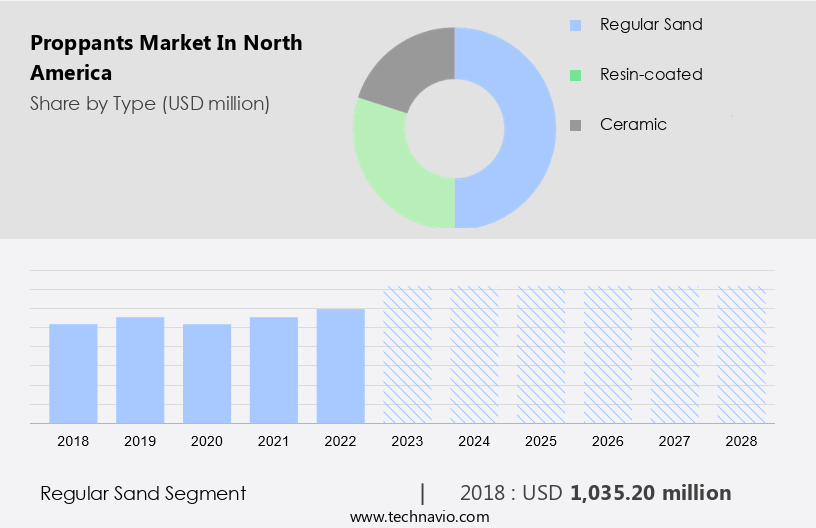
By Type Insights
- The regular sand segment is estimated to witness significant growth during the forecast period.
In the oil and gas industry, regular sand, commonly referred to as frac sand, plays a significant role during the hydraulic fracturing process. This type of sand consists of small, uniform particles that are injected into the rock formations alongside water to create fractures. The sand particles' uniformity allows for the efficient flow of fluids, including water, oil, and gas, through the fractures. Regular sand is the most widely used proppant due to its versatility in oil and natural gas wells and cost advantages compared to other proppants. However, the use of regular sand has raised concerns regarding closure stresses and fracture conductivity, which can lead to water contamination.
To address these concerns, alternative proppants have emerged, including ceramics and sintered bauxite. Recycled proppants and biodegradable polymers are also gaining popularity as eco-friendly options. These alternative materials offer improved performance and reduced environmental impact compared to regular sand. As the demand for sustainable and cost-effective proppants continues to grow, research and development efforts are focused on enhancing the properties of these alternative materials. The proppants market is expected to witness significant growth in the coming years, driven by the increasing adoption of these advanced materials.
Get a glance at the market share of various segments Request Free Sample
The regular sand segment was valued at USD 1.04 billion in 2018 and showed a gradual increase during the forecast period.
Market Dynamics
Our researchers analyzed the data with 2023 as the base year, along with the key drivers, trends, and challenges. A holistic analysis of drivers will help companies refine their marketing strategies to gain a competitive advantage.
What are the key market drivers leading to the rise in adoption of North America Proppants Market?
Growing demand for fine mesh raw frac sand is the key driver of the market.
- In the oil and gas industry, fine mesh raw frac sand serves as an essential proppant during the extraction process of Tight Gas and Coalbed Methane. Compared to other proppants like resin-coated sand and ceramics, raw frac sand is more cost-effective. The market for this type of proppant is experiencing growth due to its increasing utilization in fracturing technology.
- The demand for fine mesh raw frac sand, such as Northern White sand, is on the rise, particularly in the US. This trend can be attributed to several factors, including the implementation of advanced extraction methods, the escalating need for petroleum products, and the discovery and drilling of shale rock formations in North America.
What are the market trends shaping the North America Proppants Market?
Technological developments in hydraulic fracturing process is the upcoming trend in the market.
- Proppants play a crucial role in the hydraulic fracturing process, which is a primary method for extracting hydrocarbons from shale formations in the United States. The use of proppants, such as sand, resin-coated sand, and lightweight materials, helps maintain hydraulic fractures and ensure the efficient production of hydrocarbons. The crush resistance of proppants is essential to prevent the fractures from collapsing under the pressure of the reservoir. Advancements in hydraulic fracturing technology include the integration of sensors, software, and the Internet of Things (IoT) for data acquisition and analysis. Real-time pressure monitoring is critical to prevent over-fracturing and optimize the fracturing process.
- Machine learning algorithms are employed to analyze the data and improve the overall efficiency of the hydraulic fracturing process. The use of data analytics and machine learning enhances the performance of the tools used in hydraulic fracturing, ultimately contributing to increased productivity and cost savings. In summary, the hydraulic fracturing process relies on the effective use of proppants to maintain hydraulic fractures and maximize hydrocarbon production. Technological advancements, including the integration of IoT, data analytics, and machine learning, are essential for optimizing the hydraulic fracturing process and improving its efficiency.
What challenges does North America Proppants Market face during the growth?
Environmental concerns associated with hydraulic fracturing process is a key challenge affecting the market growth.
- The hydraulic fracturing process, a crucial method for energy production in the United States, relies on the utilization of water, sand, proppants, and chemicals. While hydraulic fracturing itself does not contribute significantly to carbon emissions, it does pose potential risks to the environment. The primary concerns include methane leaks and water pollution. The extensive use of water in hydraulic fracturing can lead to the depletion of groundwater and freshwater resources. Additionally, the chemicals employed during the process can pose health risks to nearby communities.
- For instance, hydrochloric acid, ethylene glycol, methanol, and isopropanol can negatively impact the respiratory and nervous systems. To mitigate these risks, advanced proppants, such as ultra-lightweight and multifunctional varieties, are being developed and employed. These proppants offer enhanced crushing resistance, ensuring the integrity of hydraulic fractures and reducing the need for excessive use of fracking fluids and chemical additives. This not only reduces the environmental impact but also lowers production costs. Incorporating such innovations into the hydraulic fracturing process is essential to ensure sustainable energy production while minimizing potential risks.
Exclusive North America Proppants Market Customer Landscape
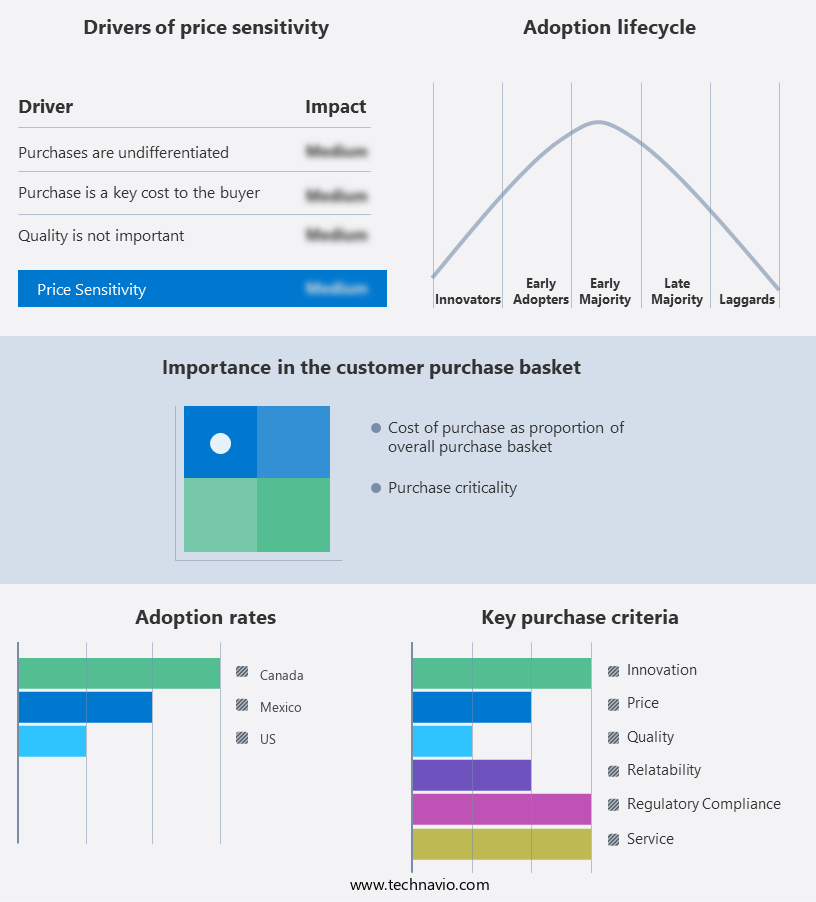
The market forecasting report includes the adoption lifecycle of the market, covering from the innovator’s stage to the laggard’s stage. It focuses on adoption rates in different regions based on penetration. Furthermore, the market report also includes key purchase criteria and drivers of price sensitivity to help companies evaluate and develop their market growth analysis strategies.
Customer Landscape
Key Companies & Market Insights
Companies are implementing various strategies, such as strategic alliances, market forecast partnerships, mergers and acquisitions, geographical expansion, and product/service launches, to enhance their presence in the market.
The market research and growth report includes detailed analyses of the competitive landscape of the market and information about key companies, including:
- Badger Mining Corp.
- Baker Hughes Co.
- CARBO Ceramics Inc.
- Casey Development Ltd.
- ChangQing Proppant Corp.
- Compagnie de Saint-Gobain SA
- Covia Holdings LLC
- Eagle Materials Inc.
- Fores Ltd.
- Halliburton Co.
- Hexion Inc.
- Hi Crush Inc.
- HORIBA Ltd.
- Imerys S.A.
- Preferred Proppants LLC
- SmartSand Inc.
- Superior Silica Sands LLC
- US Ceramics LLC
- US Silica Holdings Inc.
Qualitative and quantitative analysis of companies has been conducted to help clients understand the wider business environment as well as the strengths and weaknesses of key market players. Data is qualitatively analyzed to categorize companies as pure play, category-focused, industry-focused, and diversified; it is quantitatively analyzed to categorize companies as dominant, leading, strong, tentative, and weak.
Research Analyst Overview
Proppants play a crucial role in the hydraulic fracturing process used to extract hydrocarbons from shale formations, tight gas, coal bed methane, and other unconventional resources. These tiny grains, often made of sand, ceramics, or sintered bauxite, help maintain the hydraulic fractures created during the extraction process, ensuring hydrocarbon flow. Ceramic proppants, such as resin-coated and sintered bauxite, offer superior crush resistance, while lightweight proppants increase fracture conductivity. Alternative materials like biodegradable polymers and recycled proppants are gaining popularity due to environmental concerns. Proppant embedment and proppant technology are essential aspects of hydraulic fracturing, with advanced proppants like ultra-lightweight, multifunctional, and conductive hydraulic fractures enhancing the overall efficiency of the process.
In addition, fracking fluids and chemical additives are also critical components, but water contamination and seismic activity are concerns that continue to be addressed. Oilfield services companies offer various extraction methods and fracturing technologies to optimize the use of proppants and improve the productivity of shale rock wells. Natural proppants like silica sand and man-made proppants like ceramic proppants continue to dominate the market, with ongoing research and development focusing on improving their properties and reducing their environmental impact.
|
Market Scope |
|
|
Report Coverage |
Details |
|
Page number |
137 |
|
Base year |
2023 |
|
Historic period |
2018-2022 |
|
Forecast period |
2024-2028 |
|
Growth momentum & CAGR |
Accelerate at a CAGR of 8.4% |
|
Market Growth 2024-2028 |
USD 848.1 million |
|
Market structure |
Fragmented |
|
YoY growth 2023-2024(%) |
7.8 |
|
Competitive landscape |
Leading Companies, Market Positioning of Companies, Competitive Strategies, and Industry Risks |
What are the Key Data Covered in this Market Research Report?
- CAGR of the market during the market forecast period
- Detailed information on factors that will drive the market growth and forecasting between 2024 and 2028
- Precise estimation of the size of the market and its contribution of the market in focus to the parent market
- Accurate predictions about upcoming market growth and trends and changes in consumer behaviour
- Growth of the market across North America
- Thorough analysis of the market’s competitive landscape and detailed information about companies
- Comprehensive analysis of factors that will challenge the growth of market companies
We can help! Our analysts can customize this market research report to meet your requirements
 RIA -
RIA - 
