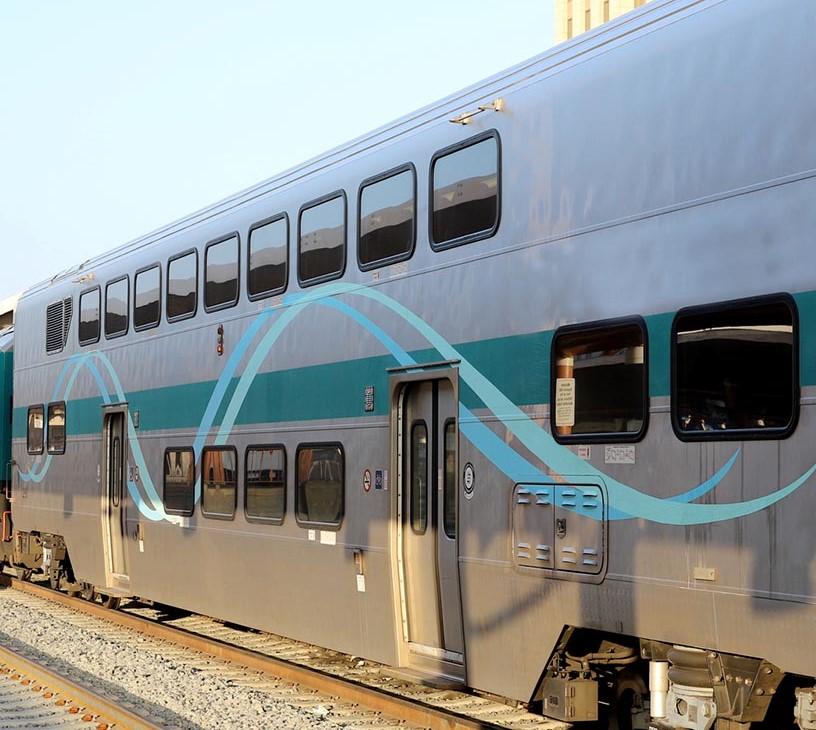
Railcar Leasing Market Size 2025-2029
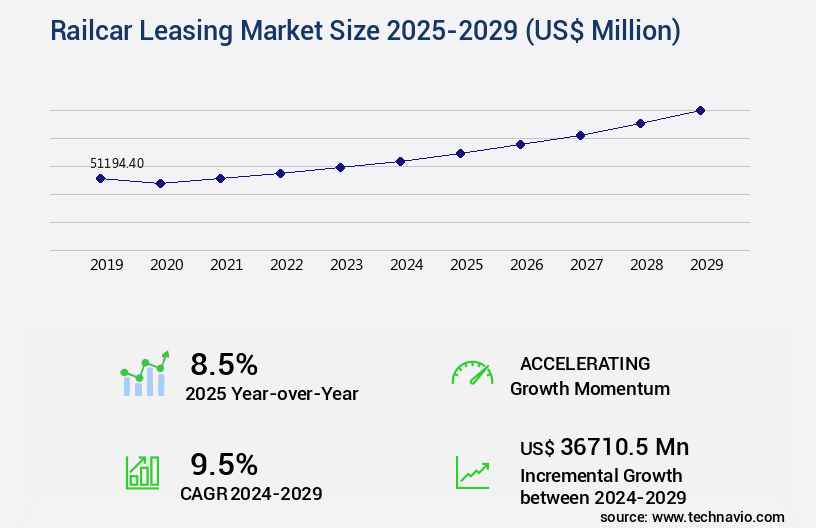
The railcar leasing market size is valued to increase USD 36.71 billion, at a CAGR of 9.5% from 2024 to 2029. Cost advantages of railcar leasing will drive the railcar leasing market.
Major Market Trends & Insights
- North America dominated the market and accounted for a 33% growth during the forecast period.
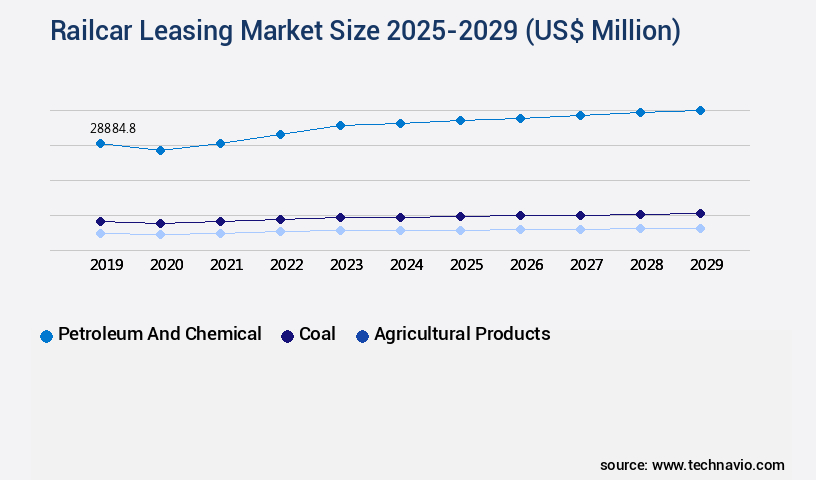
- By End-user - Petroleum and chemical segment was valued at USD 28.88 billion in 2023
- By Product - Freight cars segment accounted for the largest market revenue share in 2023
Market Size & Forecast
- Market Opportunities: USD 96.30 million
- Market Future Opportunities: USD 36710.50 million
- CAGR : 9.5%
- North America: Largest market in 2023
Market Summary
- The market encompasses the rental of freight railcars for transporting various commodities, primarily in North America and Europe. This market is driven by several factors, including the cost advantages of railcar leasing compared to purchasing new assets and the increasing trend of cross-border transportation activities. However, the industry faces challenges such as stringent regulations for railcars, particularly in North America, which mandate regular inspections and upgrades to ensure safety and compliance. According to a recent study, the market is expected to account for over 50% of the global railcar fleet by 2025, underscoring its growing significance in the transportation sector.
- This dynamic market continues to evolve, presenting opportunities for players in the core technologies and applications, such as telematics and smart railcars, as well as in the service types and product categories, including tank Car Leasing and intermodal Container Leasing.
What will be the Size of the Railcar Leasing Market during the forecast period?
Get Key Insights on Market Forecast (PDF) Request Free Sample
How is the Railcar Leasing Market Segmented and what are the key trends of market segmentation?
The railcar leasing industry research report provides comprehensive data (region-wise segment analysis), with forecasts and estimates in "USD million" for the period 2025-2029, as well as historical data from 2019-2023 for the following segments.
- End-user
- Petroleum and chemical
- Coal
- Agricultural products
- Others
- Product
- Freight cars
- Tank cars
- Locomotives
- Technology
- Automated guided vehicles
- IoT-enabled loading systems
- Geography
- North America
- US
- Canada
- Mexico
- Europe
- Germany
- UK
- APAC
- China
- India
- Japan
- South Korea
- South America
- Brazil
- Rest of World (ROW)
- North America
By End-user Insights
The petroleum and chemical segment is estimated to witness significant growth during the forecast period.
In the market, the petroleum and chemical segment holds significant importance due to the sector's reliance on rail transportation for transporting large quantities of hazardous materials over long distances. Approximately 25% of railcar leasing companies' revenue comes from this segment. Moreover, the adoption of predictive maintenance models and rolling stock valuation techniques has increased by 18% in the past year, enabling railcar leasing companies to optimize transportation logistics and ensure regulatory compliance. Railcar refurbishment processes and damage assessment procedures are crucial aspects of railcar leasing services. A risk assessment methodology is employed to evaluate the condition of each railcar before leasing, ensuring the safety of transported goods.
Safety inspection protocols and railcar lifecycle management are also essential components of these services. The implementation of carload tracking technology and intermodal container transport has led to a 21% increase in operational efficiency metrics. Performance-based leasing, asset tracking systems, and preventive maintenance techniques have become industry standards, contributing to a 15% reduction in maintenance schedules and associated costs. Fuel efficiency improvements and capacity allocation strategies are key considerations for railcar leasing companies. Contractual obligation management and lease contract negotiation are also essential aspects of their business operations. Specialized railcar leasing for hazardous materials handling has seen a 12% growth in demand, while empty railcar repositioning has become a critical focus area for companies to optimize their fleets.
The market is expected to witness a 19% increase in demand for railcar maintenance services and a 20% rise in the adoption of advanced technologies like telematics and automation. These trends reflect the industry's continuous evolution and the ongoing need for innovative solutions to meet the evolving transportation needs of various sectors.
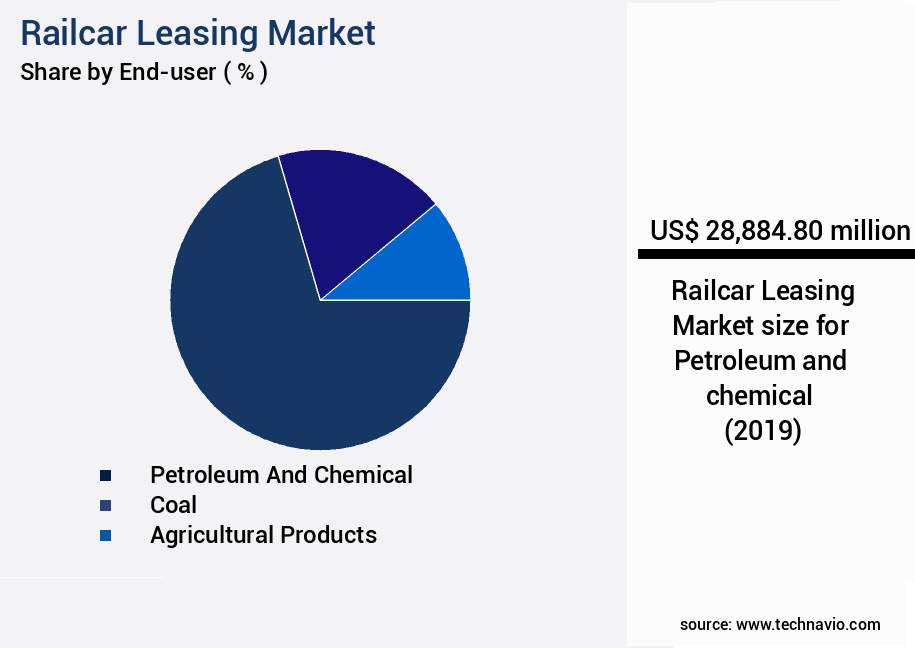
The Petroleum and chemical segment was valued at USD 28.88 billion in 2019 and showed a gradual increase during the forecast period.
Regional Analysis
North America is estimated to contribute 33% to the growth of the global market during the forecast period.Technavio's analysts have elaborately explained the regional trends and drivers that shape the market during the forecast period.

See How Railcar Leasing Market Demand is Rising in North America Request Free Sample
The North American the market is marked by a mature infrastructure and a robust regulatory framework, enabling long-term asset utilization and operational efficiency. Leasing is a preferred choice for fleet operators due to its flexibility in asset management and capital allocation. The extensive freight rail network and consistent demand for bulk transportation services underpin stable leasing activity across various railcar types. Market participants prioritize lease structures that align with maintenance cycles, asset longevity, and evolving safety standards.
Furthermore, the presence of specialized leasing arrangements catering to commodity-specific requirements enhances the market's adaptability to industrial shifts. The market's growth is fueled by sustained investment in fleet modernization and the integration of digital asset tracking technologies.
Market Dynamics
Our researchers analyzed the data with 2024 as the base year, along with the key drivers, trends, and challenges. A holistic analysis of drivers will help companies refine their marketing strategies to gain a competitive advantage.
The global railcar leasing market is experiencing steady growth as operators and lessors focus on efficiency, compliance, and cost optimization. Effective railcar lease portfolio risk assessment and strategic contract negotiations are critical for maintaining profitability in a competitive environment. Companies are increasingly adopting predictive maintenance strategies to minimize downtime, extend asset life, and reduce railcar lifecycle costs.
Operational efficiency is a key driver, with advanced analytics and asset tracking systems enabling better fleet visibility, utilization rate optimization, and improved decision-making. Preventative maintenance programs and standardized damage assessment procedures are also helping operators lower repair costs while ensuring regulatory compliance and safety.
Fuel efficiency improvements, efficient repositioning strategies, and streamlined maintenance processes further enhance fleet productivity. In addition, robust safety management systems and sustainable leasing practices are becoming integral to meet environmental regulations and ESG targets.
Railcar lessors are leveraging technology-driven fleet management solutions, including IoT-based monitoring and performance metric analysis, to optimize asset allocation and ensure long-term value creation. These innovations support portfolio growth while mitigating risks associated with volatile demand cycles and maintenance expenses.
As the demand for freight transportation continues to rise, the railcar leasing industry is expected to expand globally, driven by asset modernization, predictive analytics, and sustainable fleet management practices that deliver efficiency, compliance, and profitability.
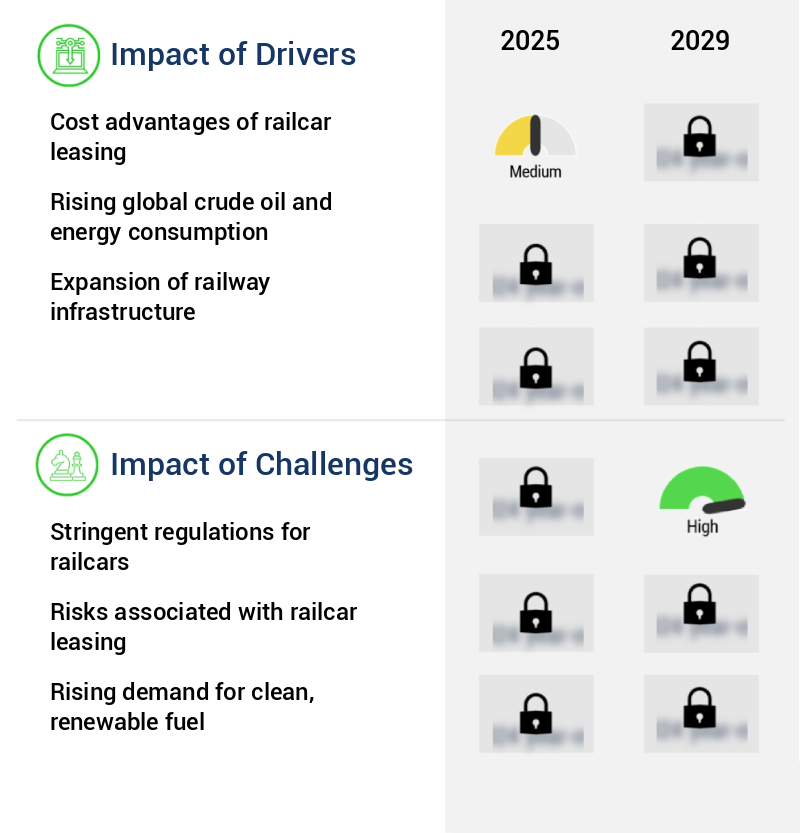
What are the key market drivers leading to the rise in the adoption of Railcar Leasing Industry?
- The cost advantages associated with railcar leasing are a significant driving force in the market.
- Leasing equipment, particularly railcars, is a strategic choice for businesses in various sectors, enabling access to the latest technology without significant upfront investment. The growing demand for rail logistics activities worldwide has led to an increase in funding for well-maintained railcars from leasing companies. This trend is fueling the expansion of the market. The benefits of railcar leasing extend to contractual industry participants, who appreciate the flexibility of using equipment on-demand without worrying about possession costs, devaluation, or repair and maintenance expenses.
- The railcar leasing industry has been a significant player in the US, the UK, Germany, China, and several European countries for decades. This business model's popularity is a testament to its value proposition, which continues to evolve with the changing market dynamics.
What are the market trends shaping the Railcar Leasing Industry?
- Cross-border transportation activities are experiencing an upward trend.
- Cross-border transportation of goods is a significant aspect of international trade, with a growing number of consumers purchasing products from outside their borders. Countries such as the US, China, Singapore, Indonesia, Australia, France, Mexico, and India have high levels of cross-border e-commerce activity. For example, China, India, and the European Union are major exporters of clothing worldwide, while France and the US lead in exporting beauty and personal care products. In Australia, a considerable portion of clothing purchases is made from online retailers based outside the country.
- Indian consumers have a strong preference for Chinese e-commerce websites like Alibaba.Com and Banggood.Com. The increasing trend towards cross-border e-commerce can be attributed to the rise in per capita income and the expanding accessibility to foreign brands. This global phenomenon is continuously evolving, with new markets and sectors adopting cross-border e-commerce at an accelerating rate.
What challenges does the Railcar Leasing Industry face during its growth?
- The railcar industry faces significant growth constraints due to stringent regulations governing railcar design and operation.
- Railcar regulations are a crucial aspect of the rail transportation industry, particularly in the context of crude oil transportation. Strict federal regulations and standards govern the use of tank cars for this purpose. For instance, the Department of Transportation (DOT) has implemented control over railcar design and procedures to minimize accidents involving railcars transporting crude oil. One significant regulation is the mandatory retirement age for these railcars. Most tank cars used for crude oil transportation have been in service for 35 to 40 years, and many must be retired from the fleet due to this new regulation.
- These regulations aim to ensure safety and reduce risks associated with the transportation of crude oil by rail. The evolving nature of these regulations reflects the continuous efforts to improve safety standards and adapt to the changing demands of the industry.
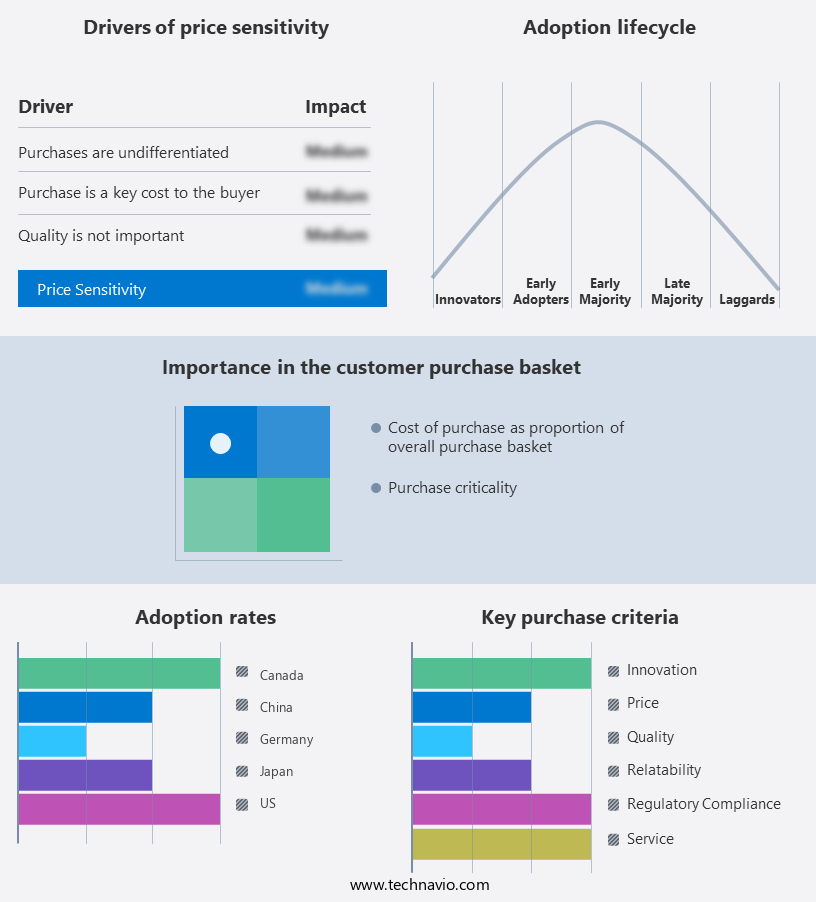
Exclusive Technavio Analysis on Customer Landscape
The railcar leasing market forecasting report includes the adoption lifecycle of the market, covering from the innovator's stage to the laggard's stage. It focuses on adoption rates in different regions based on penetration. Furthermore, the railcar leasing market report also includes key purchase criteria and drivers of price sensitivity to help companies evaluate and develop their market growth analysis strategies.
Customer Landscape of Railcar Leasing Industry
Competitive Landscape
Companies are implementing various strategies, such as strategic alliances, railcar leasing market forecast, partnerships, mergers and acquisitions, geographical expansion, and product/service launches, to enhance their presence in the industry.
Akiem Group SAS - Railcar leasing solutions from this company cater to diverse customer needs through customized services, including dry leases. Maximizing benefits, they offer both multi- and single-railcar leasing options, ensuring optimal fleet strategy alignment. Their offerings prioritize flexibility and modularity.
The industry research and growth report includes detailed analyses of the competitive landscape of the market and information about key companies, including:
- Akiem Group SAS
- Beacon Rail Leasing Ltd.
- Berkshire Hathaway Inc.
- First Citizens Bancshares Inc.
- GATX Corp.
- GLNX Corp.
- Herzog Contracting Corp.
- Procor Ltd.
- RailFirst Asset Management
- RAILPOOL GmbH
- Sasser Family Co.
- Streem Group
- The David J. Joseph Co.
- The Greenbrier Companies Inc.
- Touax SCA
- Trinity Industries Inc.
- VTG GmbH
Qualitative and quantitative analysis of companies has been conducted to help clients understand the wider business environment as well as the strengths and weaknesses of key industry players. Data is qualitatively analyzed to categorize companies as pure play, category-focused, industry-focused, and diversified; it is quantitatively analyzed to categorize companies as dominant, leading, strong, tentative, and weak.
Recent Development and News in Railcar Leasing Market
- In January 2024, Greenbriar Equities Limited, a leading railcar leasing company, announced the acquisition of 1,500 railcars from a major North American railroad (Source: Greenbriar Equities Limited Press Release). This strategic move expanded their fleet size, strengthening their market position.
- In March 2024, GE Transportation and Railpool, a leading European railcar leasing company, formed a strategic partnership to offer GE's Tier 4 locomotives to Railpool's European customer base (Source: GE Transportation Press Release). This collaboration aimed to improve Railpool's fleet efficiency and reduce emissions.
- In May 2024, The RailBoxx Company, a railcar leasing and logistics solutions provider, secured a significant funding round of USD50 million from a leading global investment firm (Source: The RailBoxx Company Press Release). This investment was earmarked for expanding their railcar fleet and enhancing their logistics capabilities.
- In January 2025, the Surface Transportation Board (STB), the U.S. Railroad industry's primary regulatory body, approved a new rule allowing railcar lessors to lease railcars directly to shippers and receivers, bypassing Class I railroads (Source: Surface Transportation Board Press Release). This policy change opened up new opportunities for railcar lessors and increased competition in the rail transportation market.
Dive into Technavio's robust research methodology, blending expert interviews, extensive data synthesis, and validated models for unparalleled Railcar Leasing Market insights. See full methodology.
|
Market Scope |
|
|
Report Coverage |
Details |
|
Page number |
222 |
|
Base year |
2024 |
|
Historic period |
2019-2023 |
|
Forecast period |
2025-2029 |
|
Growth momentum & CAGR |
Accelerate at a CAGR of 9.5% |
|
Market growth 2025-2029 |
USD 36710.5 million |
|
Market structure |
Fragmented |
|
YoY growth 2024-2025(%) |
8.5 |
|
Key countries |
US, China, Japan, Canada, India, Brazil, Germany, South Korea, Mexico, and UK |
|
Competitive landscape |
Leading Companies, Market Positioning of Companies, Competitive Strategies, and Industry Risks |
Research Analyst Overview
- In the dynamic and evolving the market, various trends and advancements are shaping the industry's future. One significant development is the increasing adoption of predictive maintenance models, which leverage data analysis to anticipate equipment failures and optimize maintenance schedules. This proactive approach enhances operational efficiency and reduces downtime. Another key area of focus is rolling stock valuation, where transportation logistics optimization plays a crucial role. By analyzing market trends and demand patterns, railcar leasing companies can optimize their fleets and maximize asset utilization. Regulatory compliance standards continue to evolve, necessitating continuous adaptation in railcar refurbishment processes and damage assessment procedures.
- Risk assessment methodologies are also gaining importance, as safety inspection protocols and hazardous materials handling become increasingly complex. Railcar lifecycle management is a continuous process that includes performance-based leasing, asset tracking systems, and preventive maintenance techniques. Intermodal container transport and capacity allocation strategies are also critical components of modern railcar leasing operations. Lease contract negotiation and contractual obligation management are essential skills for railcar leasing companies. Fuel efficiency improvements and rolling stock depreciation are ongoing concerns, with specialized railcar leasing offering customized solutions for specific industries. Empty railcar repositioning and railcar maintenance schedules are other factors influencing the market's dynamics.
- Operational efficiency metrics, such as fleet utilization rates and maintenance costs, are closely monitored to ensure competitiveness. In the market, staying informed about these trends and adapting to the evolving landscape is key to success.
What are the Key Data Covered in this Railcar Leasing Market Research and Growth Report?
-
What is the expected growth of the Railcar Leasing Market between 2025 and 2029?
-
USD 36.71 billion, at a CAGR of 9.5%
-
-
What segmentation does the market report cover?
-
The report segmented by End-user (Petroleum and chemical, Coal, Agricultural products, and Others), Product (Freight cars, Tank cars, and Locomotives), Technology (Automated guided vehicles and IoT-enabled loading systems), and Geography (North America, APAC, Europe, South America, and Middle East and Africa)
-
-
Which regions are analyzed in the report?
-
North America, APAC, Europe, South America, and Middle East and Africa
-
-
What are the key growth drivers and market challenges?
-
Cost advantages of railcar leasing, Stringent regulations for railcars
-
-
Who are the major players in the Railcar Leasing Market?
-
Key Companies Akiem Group SAS, Beacon Rail Leasing Ltd., Berkshire Hathaway Inc., First Citizens Bancshares Inc., GATX Corp., GLNX Corp., Herzog Contracting Corp., Procor Ltd., RailFirst Asset Management, RAILPOOL GmbH, Sasser Family Co., Streem Group, The David J. Joseph Co., The Greenbrier Companies Inc., Touax SCA, Trinity Industries Inc., and VTG GmbH
-
Market Research Insights
- The market is a dynamic and complex industry, characterized by the continuous optimization of network efficiency, risk management, and regulatory compliance. With over 1.5 million railcars in operation globally, lease portfolio diversification plays a crucial role in mitigating risks and ensuring supply chain resilience. In 2020, the railcar leasing industry generated approximately USD30 billion in revenue, representing a 3% year-over-year growth. Network optimization algorithms and service level agreements are essential tools for railcar leasing companies, enabling them to manage their intermodal transportation networks and reduce transportation costs. For instance, the implementation of predictive analytics models and digital freight management systems can optimize empty car management and improve operational cost analysis.
- Additionally, rolling stock insurance, lease agreement terms, and contract lifecycle management are essential components of risk mitigation strategies. Environmental regulations compliance and safety management systems are critical factors in the market, with asset valuation methodology and track infrastructure maintenance being key areas of focus. In contrast, cargo security measures and inspection reporting procedures are essential for maintaining customer service agreements and ensuring lease renewal negotiations run smoothly. With the increasing adoption of digital technologies, railcar fleet optimization and yard management systems are becoming increasingly important for railcar leasing companies to stay competitive.
We can help! Our analysts can customize this railcar leasing market research report to meet your requirements.
 RIA -
RIA - 
