
Rugged Handheld Devices Market Size 2026-2030
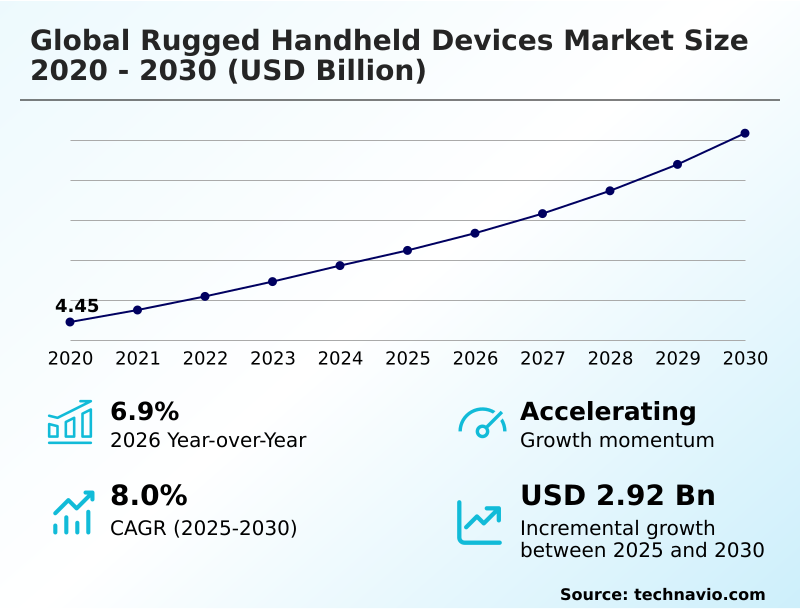
The rugged handheld devices market size is valued to increase by USD 2.92 billion, at a CAGR of 8% from 2025 to 2030. Widespread digitization and advent of industry 4.0 will drive the rugged handheld devices market.
Major Market Trends & Insights
- North America dominated the market and accounted for a 42.7% growth during the forecast period.
- By Product - Rugged mobile computer segment was valued at USD 4.48 billion in 2024
- By End-user - Industrial segment accounted for the largest market revenue share in 2024
Market Size & Forecast
- Market Opportunities: USD 4.72 billion
- Market Future Opportunities: USD 2.92 billion
- CAGR from 2025 to 2030 : 8%
Market Summary
- The rugged handheld devices market is defined by specialized mobile computing instruments engineered for reliability in harsh environments. Unlike consumer-grade electronics, these devices feature reinforced chassis and sealed enclosures, certified to military and Ingress Protection standards, to withstand drops, dust, and water.
- A key driver is the relentless digitization across industries like manufacturing and logistics, where Industry 4.0 initiatives demand robust human-machine interfaces at the operational edge. A significant trend is the convergence of industrial durability with consumer-grade ergonomics, making devices lighter and more user-friendly without sacrificing resilience.
- For instance, in a large distribution center, a worker using a rugged mobile computer with an integrated long-range scanner can perform inventory counts from a forklift, reducing cycle time and improving accuracy. However, the high initial acquisition cost compared to consumer alternatives remains a primary challenge, forcing a focus on total cost of ownership to justify the investment.
- These devices integrate advanced data capture technologies and robust processing for real-time data acquisition and communication, making them critical for improving operational efficiency and productivity in challenging work settings.
What will be the Size of the Rugged Handheld Devices Market during the forecast period?
Get Key Insights on Market Forecast (PDF) Get Free Sample
How is the Rugged Handheld Devices Market Segmented?
The rugged handheld devices industry research report provides comprehensive data (region-wise segment analysis), with forecasts and estimates in "USD million" for the period 2026-2030, as well as historical data from 2020-2024 for the following segments.
- Product
- Rugged mobile computer
- Rugged tablet
- End-user
- Industrial
- Commercial
- Military
- Government
- Type
- Fully-rugged
- Semi-rugged
- Ultra-rugged
- Geography
- North America
- US
- Canada
- Mexico
- Europe
- Germany
- UK
- France
- APAC
- China
- Japan
- India
- South America
- Brazil
- Argentina
- Colombia
- Middle East and Africa
- UAE
- Saudi Arabia
- South Africa
- Rest of World (ROW)
- North America
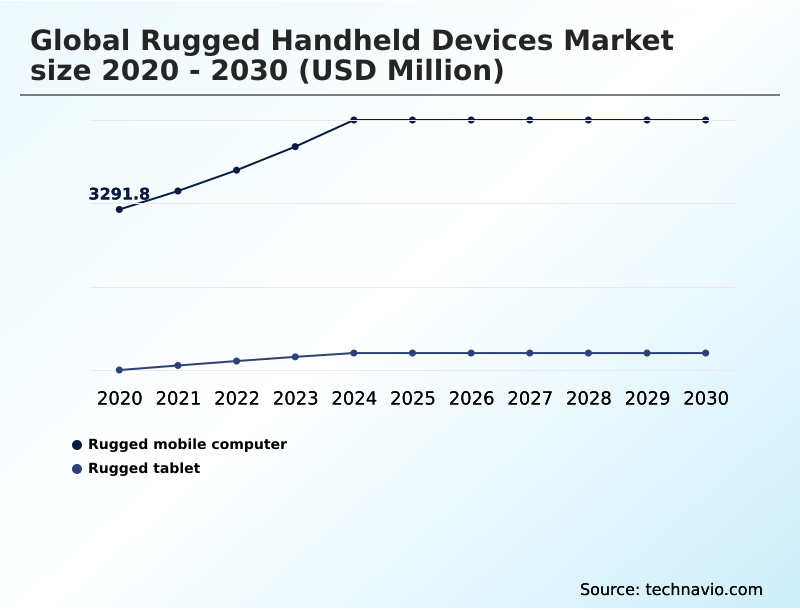
By Product Insights
The rugged mobile computer segment is estimated to witness significant growth during the forecast period.
The rugged mobile computer segment is foundational to the global rugged handheld devices market 2026-2030, engineered for intensive data capture technologies in demanding industrial workflows.
These purpose-built instruments, featuring integrated pistol grip scanners and physical keypads, are optimized for high-volume, repetitive tasks in logistics and manufacturing, improving inventory management device accuracy by over 99%.
Durability is paramount, validated by mil-std-810h certification and high ingress protection (ip) ratings to ensure operational uptime. The architecture is increasingly standardized on the android operating system, supported by enterprise mobility management for security and remote support.
With features like hot-swappable battery packs and advanced data capture engines, these devices are indispensable for optimizing efficiency within the modern supply chain.
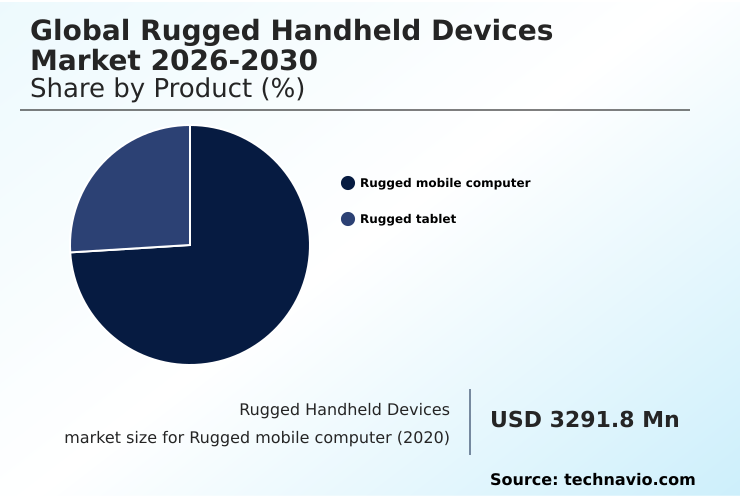
The Rugged mobile computer segment was valued at USD 4.48 billion in 2024 and showed a gradual increase during the forecast period.
Regional Analysis
North America is estimated to contribute 42.7% to the growth of the global market during the forecast period.Technavio’s analysts have elaborately explained the regional trends and drivers that shape the market during the forecast period.
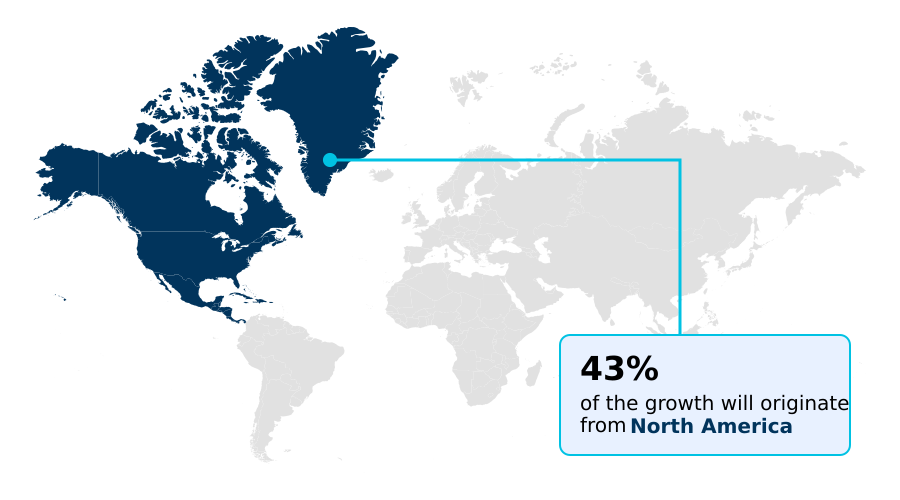
See How Rugged Handheld Devices Market Demand is Rising in North America Get Free Sample
The geographic landscape of the global rugged handheld devices market 2026-2030 is characterized by mature adoption in North America and rapid expansion in APAC.
In North America, industries such as logistics and public safety drive demand, with implementations showing up to a 30% reduction in data entry errors.
Europe, led by Germany's manufacturing sector, focuses on integrating these devices into Industry 4.0 workflows, where an outdoor readable screen and glove-operable touchscreen are critical.
Meanwhile, the explosive growth of e-commerce in APAC is fueling large-scale deployments in warehousing and last-mile delivery, where device durability is paramount.
Regions like South America and the Middle East and Africa are also witnessing growth, driven by modernization in mining and logistics.
This regional diversity underscores the demand for versatile hardware, including the durable touchscreen and semi-rugged options for varied operational needs.
Market Dynamics
Our researchers analyzed the data with 2025 as the base year, along with the key drivers, trends, and challenges. A holistic analysis of drivers will help companies refine their marketing strategies to gain a competitive advantage.
- Strategic procurement in the global rugged handheld devices market 2026-2030 increasingly involves a detailed rugged device tco vs consumer phone analysis, revealing significant long-term value despite higher initial costs. For specialized roles, choosing the best rugged scanner for warehouse inventory becomes a critical decision, as devices with advanced imagers can drastically reduce picking errors.
- Similarly, selecting an android rugged computer for manufacturing ensures seamless integration with existing MES platforms. The decision for a rugged tablet integrated barcode scanner is common in retail and healthcare for its versatility. In field operations, a 5g rugged phone for field service provides the necessary bandwidth for real-time data sync and remote assistance.
- Organizations in harsh environments often seek an ultra-rugged tablet for oil gas applications, demanding certifications like atex. The choice of a rugged device with gnss for logistics is essential for accurate tracking, with such systems often showing route optimization gains double that of consumer-grade alternatives. The mil-std-810h certified mobile computer remains the standard for defense and public safety.
- Furthermore, features like a hot-swappable battery rugged device are non-negotiable for ensuring continuous, shift-long operation, directly improving productivity with rugged handhelds. The durability comparison often highlights superior ingress protection, as seen in a waterproof android tablet for outdoor use or a rugged computer for extreme temperatures. As a result, rugged device selection for supply chain is now a strategic imperative.
What are the key market drivers leading to the rise in the adoption of Rugged Handheld Devices Industry?
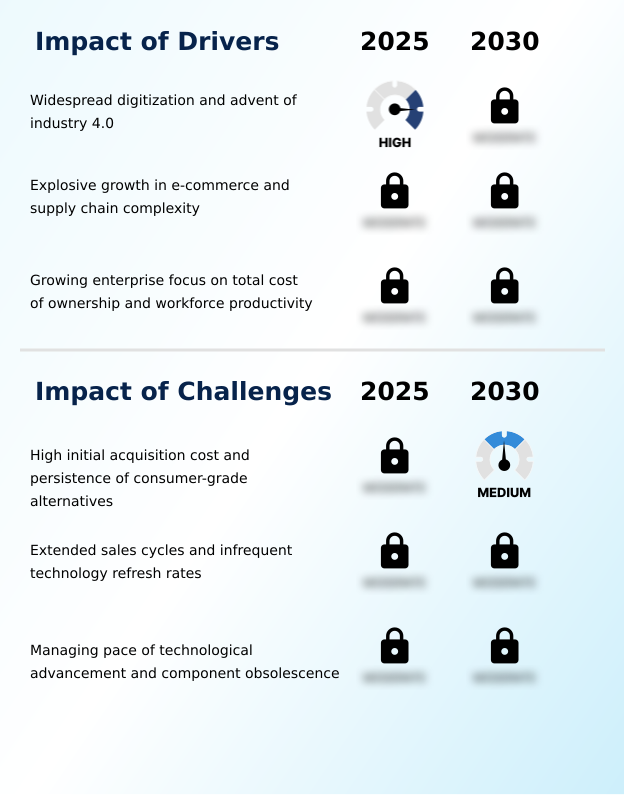
- Widespread digitization and the advent of Industry 4.0 are key drivers propelling market growth.
- The growth of the global rugged handheld devices market 2026-2030 is propelled by powerful secular drivers. The adoption of industry 4.0 principles in manufacturing has made these devices essential, improving production line visibility by over 30%.
- Simultaneously, the explosive growth of e-commerce has created immense demand in logistics, where purpose-built rugged handhelds with integrated barcode scanners reduce picking errors to less than 1%.
- A maturing driver is the enterprise focus on total cost of ownership (tco), as sophisticated buyers understand that a rugged handheld's lifecycle is 3-5 times longer than a consumer device in harsh environments.
- This long-lifecycle support, combined with features designed for workflow optimization tool, justifies the initial investment. The need for reliable mobile data collection in sectors from retail to public safety ensures sustained demand for these mission-critical assets.
What are the market trends shaping the Rugged Handheld Devices Industry?
- The proliferation of the Android operating system is a defining market trend, fostering an ecosystem of enterprise software platforms. This migration accelerates adoption through a familiar user interface and expanded application development.
- Key trends are reshaping the global rugged handheld devices market 2026-2030, enhancing functionality and user adoption. The near-universal migration to an enterprise-grade android platform has been transformative, reducing employee training time by up to 50% due to user familiarity.
- This is complemented by the integration of advanced connectivity, where the adoption of 5g and wi-fi 6 enables data transfer speeds up to 10 times faster than previous standards, unlocking new applications like real-time video support and augmented reality. Another major trend is the convergence of durability with consumer-style ergonomics.
- Manufacturers are now delivering slimmer, lighter devices that still meet rigorous mil-std-810h standards, leading to a reported 15% increase in mobile workforce productivity during long shifts by reducing user fatigue. Features like a glove-operable touchscreen and a proof-of-delivery system are now standard.
What challenges does the Rugged Handheld Devices Industry face during its growth?
- The high initial acquisition cost, coupled with the persistence of consumer-grade alternatives, presents a key challenge to industry growth.
- Despite strong drivers, the global rugged handheld devices market 2026-2030 faces structural challenges that temper growth. The high initial acquisition cost, often 3-4 times that of a consumer-grade alternative, remains a significant barrier, particularly for small and medium-sized enterprises. This price disparity complicates the total cost of ownership (tco) argument.
- The market is also characterized by long and infrequent replacement cycles, with device lifespans averaging 5-7 years, creating project-based revenue streams for vendors rather than predictable sales.
- A third challenge is managing the pace of technological advancement; core components like processors may be discontinued by suppliers within 24 months, while the rugged device requires a much longer support commitment, creating significant supply chain complexity and engineering overhead for ensuring long-term operational uptime and security.
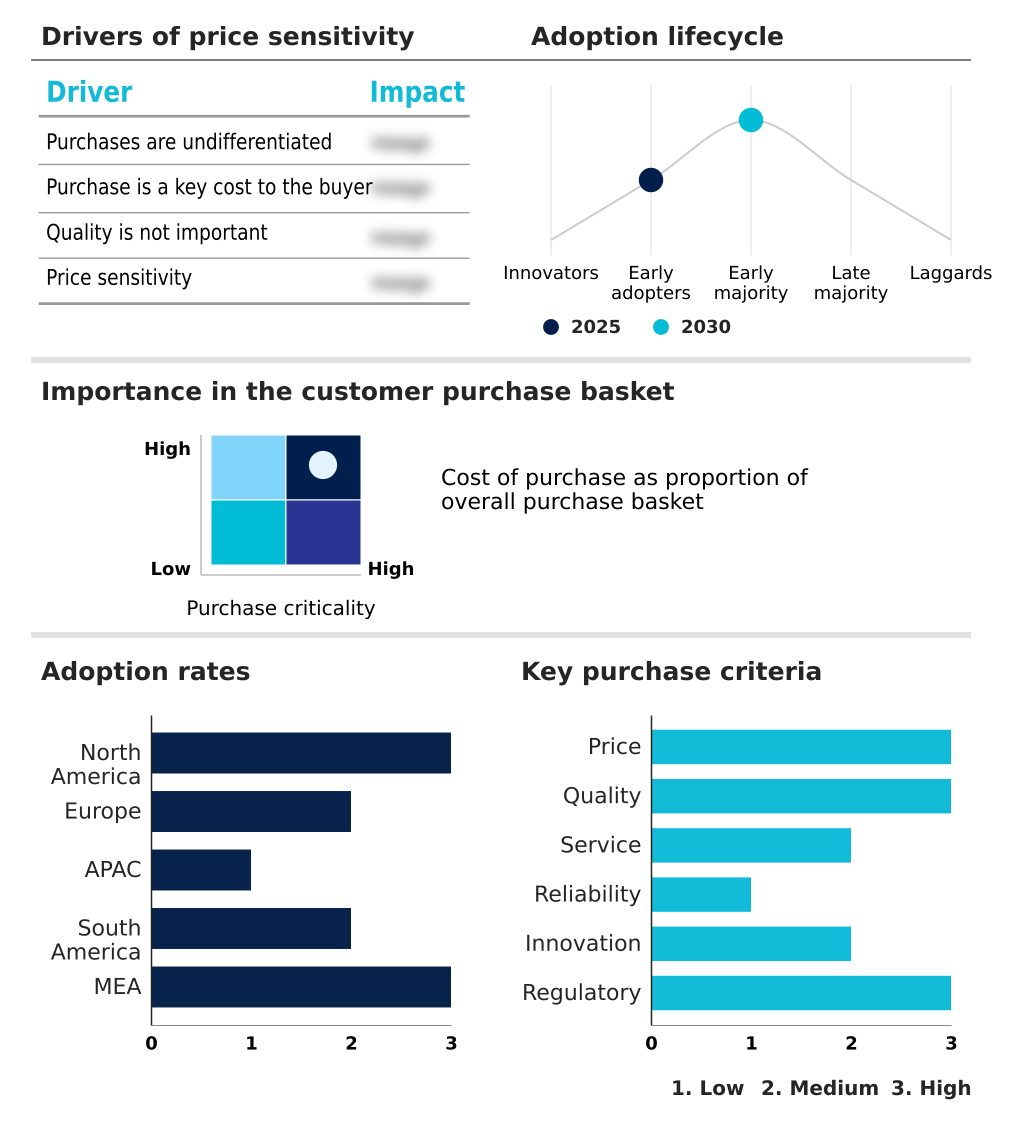
Exclusive Technavio Analysis on Customer Landscape
The rugged handheld devices market forecasting report includes the adoption lifecycle of the market, covering from the innovator’s stage to the laggard’s stage. It focuses on adoption rates in different regions based on penetration. Furthermore, the rugged handheld devices market report also includes key purchase criteria and drivers of price sensitivity to help companies evaluate and develop their market growth analysis strategies.
Customer Landscape of Rugged Handheld Devices Industry
Competitive Landscape
Companies are implementing various strategies, such as strategic alliances, rugged handheld devices market forecast, partnerships, mergers and acquisitions, geographical expansion, and product/service launches, to enhance their presence in the industry.
Aeroqual - Provision of industrial tablets, mobile terminals, and data collection devices addresses critical needs for durable, field-ready computing solutions.
The industry research and growth report includes detailed analyses of the competitive landscape of the market and information about key companies, including:
- Aeroqual
- ARBOR Technology Corp.
- BARTEC Top Holding GmbH
- Bluebird Inc.
- CipherLab Co. Ltd.
- Datalogic SpA
- DT Research Inc.
- Getac Holdings Corp.
- HID Global Corp.
- Honeywell International Inc.
- Juniper Systems Inc.
- KYOCERA Corp.
- Leonardo DRS Inc.
- MilDef Group AB
- Panasonic Holdings Corp.
- Samsung Electronics Co. Ltd.
- Touchstar Plc
- Unitech Electronics Co. Ltd.
- Winmate Inc.
- Zebra Technologies Corp.
Qualitative and quantitative analysis of companies has been conducted to help clients understand the wider business environment as well as the strengths and weaknesses of key industry players. Data is qualitatively analyzed to categorize companies as pure play, category-focused, industry-focused, and diversified; it is quantitatively analyzed to categorize companies as dominant, leading, strong, tentative, and weak.
Recent Development and News in Rugged handheld devices market
- In September 2024, Getac Technology Corporation announced its next-generation UX10 and UX10-IP fully rugged tablets, integrating an Intel AI Boost neural processing unit to accelerate edge AI tasks for logistics and public safety sectors.
- In October 2024, United Parcel Service (UPS) announced a major enhancement to its ORION platform, involving the rollout of its new proprietary DIAD VI rugged handheld device to leverage AI for dynamic route optimization.
- In January 2025, WEROCK Technologies GmbH introduced the Rocktab U210 G2, a durable Windows tablet designed specifically for public services, law enforcement, and the defense industry, addressing needs for navigation and evidence management.
- In April 2025, The First Responder Network Authority (FirstNet) certified a new portfolio of rugged smartphones and tablets, ensuring these devices are physically durable and optimized to operate on the dedicated public safety broadband network.
Dive into Technavio’s robust research methodology, blending expert interviews, extensive data synthesis, and validated models for unparalleled Rugged Handheld Devices Market insights. See full methodology.
| Market Scope | |
|---|---|
| Page number | 298 |
| Base year | 2025 |
| Historic period | 2020-2024 |
| Forecast period | 2026-2030 |
| Growth momentum & CAGR | Accelerate at a CAGR of 8% |
| Market growth 2026-2030 | USD 2924.2 million |
| Market structure | Fragmented |
| YoY growth 2025-2026(%) | 6.9% |
| Key countries | US, Canada, Mexico, Germany, UK, France, Italy, Spain, The Netherlands, China, Japan, India, South Korea, Australia, Indonesia, Brazil, Argentina, Colombia, UAE, Saudi Arabia, South Africa, Israel and Turkey |
| Competitive landscape | Leading Companies, Market Positioning of Companies, Competitive Strategies, and Industry Risks |
Research Analyst Overview
- The rugged handheld devices market is a critical enabler of digital transformation in mission-critical sectors. These devices, defined by their durability and specialized data capture technologies, are essential for maintaining operational continuity where consumer electronics fail.
- Boardroom decisions are increasingly influenced by the strategic adoption of the android operating system on these platforms, which requires long-term planning for software lifecycle management and security, moving the conversation beyond mere hardware procurement.
- This focus on a stable, enterprise-grade platform is justified by performance metrics; enterprises deploying fully-rugged devices have achieved up to a 40% reduction in device failure rates compared to non-rugged alternatives. The market is evolving with the integration of edge ai, 5g connectivity, and wi-fi 6, turning the rugged mobile computer and rugged tablet into powerful edge-computing nodes.
- Key features such as a hot-swappable battery, sunlight readable display, and integrated rfid reader are no longer niche but standard expectations for improving workforce productivity and ensuring a low total cost of ownership (tco). Adherence to standards like mil-std-810h and high ingress protection (ip) ratings remains a non-negotiable baseline for quality.
What are the Key Data Covered in this Rugged Handheld Devices Market Research and Growth Report?
-
What is the expected growth of the Rugged Handheld Devices Market between 2026 and 2030?
-
USD 2.92 billion, at a CAGR of 8%
-
-
What segmentation does the market report cover?
-
The report is segmented by Product (Rugged mobile computer, and Rugged tablet), End-user (Industrial, Commercial, Military, and Government), Type (Fully-rugged, Semi-rugged, and Ultra-rugged) and Geography (North America, Europe, APAC, South America, Middle East and Africa)
-
-
Which regions are analyzed in the report?
-
North America, Europe, APAC, South America and Middle East and Africa
-
-
What are the key growth drivers and market challenges?
-
Widespread digitization and advent of industry 4.0, High initial acquisition cost and persistence of consumer-grade alternatives
-
-
Who are the major players in the Rugged Handheld Devices Market?
-
Aeroqual, ARBOR Technology Corp., BARTEC Top Holding GmbH, Bluebird Inc., CipherLab Co. Ltd., Datalogic SpA, DT Research Inc., Getac Holdings Corp., HID Global Corp., Honeywell International Inc., Juniper Systems Inc., KYOCERA Corp., Leonardo DRS Inc., MilDef Group AB, Panasonic Holdings Corp., Samsung Electronics Co. Ltd., Touchstar Plc, Unitech Electronics Co. Ltd., Winmate Inc. and Zebra Technologies Corp.
-
Market Research Insights
- The market dynamics for rugged handheld devices are increasingly shaped by a strategic focus on total cost of ownership (TCO) and mobile workforce productivity. Enterprises are recognizing that deploying purpose-built hardware results in a 3-5 times longer operational lifespan compared to consumer-grade alternatives in similar environments.
- This shift justifies the higher initial investment, as implementations often achieve a positive ROI within 24 months through reduced downtime and repair costs. Furthermore, the adoption of an enterprise-grade Android platform for these devices has streamlined application deployment and reduced user training times by up to 40%.
- The focus on workflow optimization tools, such as integrated high-performance scanners and hot-swappable batteries, directly contributes to enhanced operational uptime, cementing their value in mission-critical sectors like logistics and field service.
We can help! Our analysts can customize this rugged handheld devices market research report to meet your requirements.
 RIA -
RIA - 
