Rugged Thermal Cameras Market Analysis, Size, and Forecast 2024-2028: North America (Mexico), Europe (France, Germany, Italy, Spain, and UK), Middle East and Africa (UAE), APAC (Australia, China, India, Japan, and South Korea), South America (Brazil), and Rest of World (ROW)

Rugged Thermal Cameras Market Analysis, Size, and Forecast 2024-2028:
North America (Mexico), Europe (France, Germany, Italy, Spain, and UK), Middle East and Africa (UAE), APAC (Australia, China, India, Japan, and South Korea), South America (Brazil), and Rest of World (ROW)

Published: Jul 2024 162 Pages SKU: IRTNTR74365

Market Overview at a Glance

$2.68 B
Market Opportunity
8.51%
CAGR
7.67
YoY growth 2023-2024(%)

Rugged Thermal Cameras Market Size 2024-2028

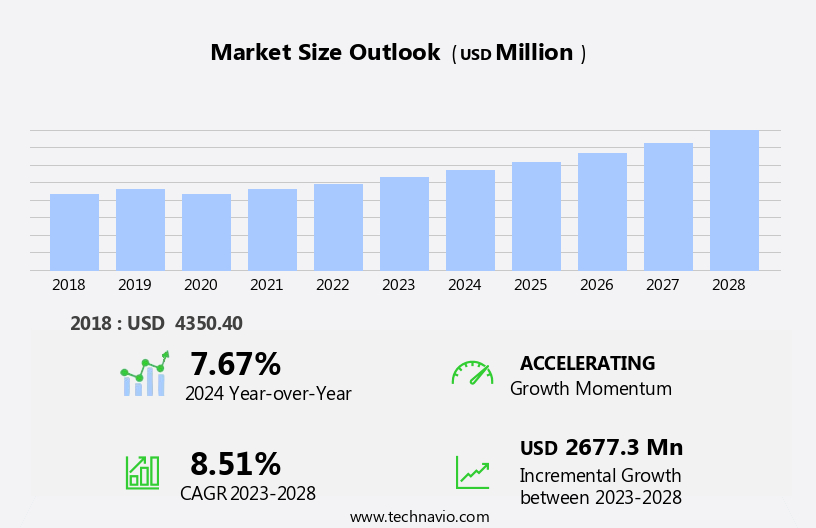
The rugged thermal cameras market size is forecast to increase by USD 2.68 billion at a CAGR of 8.51% between 2023 and 2028.

  • The market is poised for significant growth, driven primarily by increasing military expenditure and advancements in photogrammetry and thermal imaging technology. Military applications, particularly in border surveillance and defense, account for a substantial market share due to the heightened security concerns worldwide. This trend is further bolstered by the continuous improvement in thermal imaging technology, enabling higher resolution and accuracy in image data collection. However, the market faces challenges in obtaining precise image data due to environmental factors and technical limitations.
  • Inaccuracies in image data collection can lead to false alarms or missed threats, making it crucial for manufacturers to invest in research and development to address this issue. Companies that successfully navigate these challenges and leverage the market drivers will be well-positioned to capitalize on the growing demand for rugged thermal cameras in various industries, including military, security, and industrial applications.

What will be the Size of the Rugged Thermal Cameras Market during the forecast period?

Rugged Thermal Cameras Market Size

 Request Free Sample

  • The market continues to evolve, driven by advancements in imaging technology and its applications across various sectors. Thermal analysis plays a crucial role in scientific research, defense industry, and industrial inspection, enabling temperature measurement, process monitoring, and thermal signature analysis. Thermal imaging software, machine vision, and data analysis tools enhance image processing and recognition capabilities, while frame rate and image resolution improve video recording capabilities. Environmental monitoring and wildlife monitoring benefit from thermal imaging, providing insights into temperature changes and animal behavior. Deep learning and artificial intelligence (AI) integration enable advanced object recognition and fault detection, extending thermal imaging's applications to predictive maintenance, energy audits, and security industry.
  • Ruggedized cameras with wireless connectivity, noise reduction, and image stabilization cater to the demands of law enforcement, target identification, and search and rescue. Low-light imaging and heat detection are essential features for night vision applications, while battery life and thermal sensitivity are critical factors for military applications. Autonomous vehicles and remote control systems further expand the market's potential, offering new opportunities for thermal imaging in various industries. The ongoing unfolding of market activities and evolving patterns underscore the continuous dynamism of the market.

How is this Rugged Thermal Cameras Industry segmented?

The rugged thermal cameras industry research report provides comprehensive data (region-wise segment analysis), with forecasts and estimates in "USD million" for the period 2024-2028, as well as historical data from 2018-2022 for the following segments.

  • Application
    • Security and surveillance
    • Monitoring and inspection
    • Detection and measurement
    • Others
  • End-user
    • Military and defense
    • Commercial
    • Industrial
    • Residential
  • Type
    • Handheld
    • Fixed
  • Technology Specificity
    • Cooled
    • Uncooled
  • Geography
    • North America
      • US
      • Mexico
    • Europe
      • France
      • Germany
      • Italy
      • Spain
      • UK
    • Middle East and Africa
      • UAE
    • APAC
      • Australia
      • China
      • India
      • Japan
      • South Korea
    • South America
      • Brazil
    • Rest of World (ROW)

By Application Insights

The security and surveillance segment is estimated to witness significant growth during the forecast period.

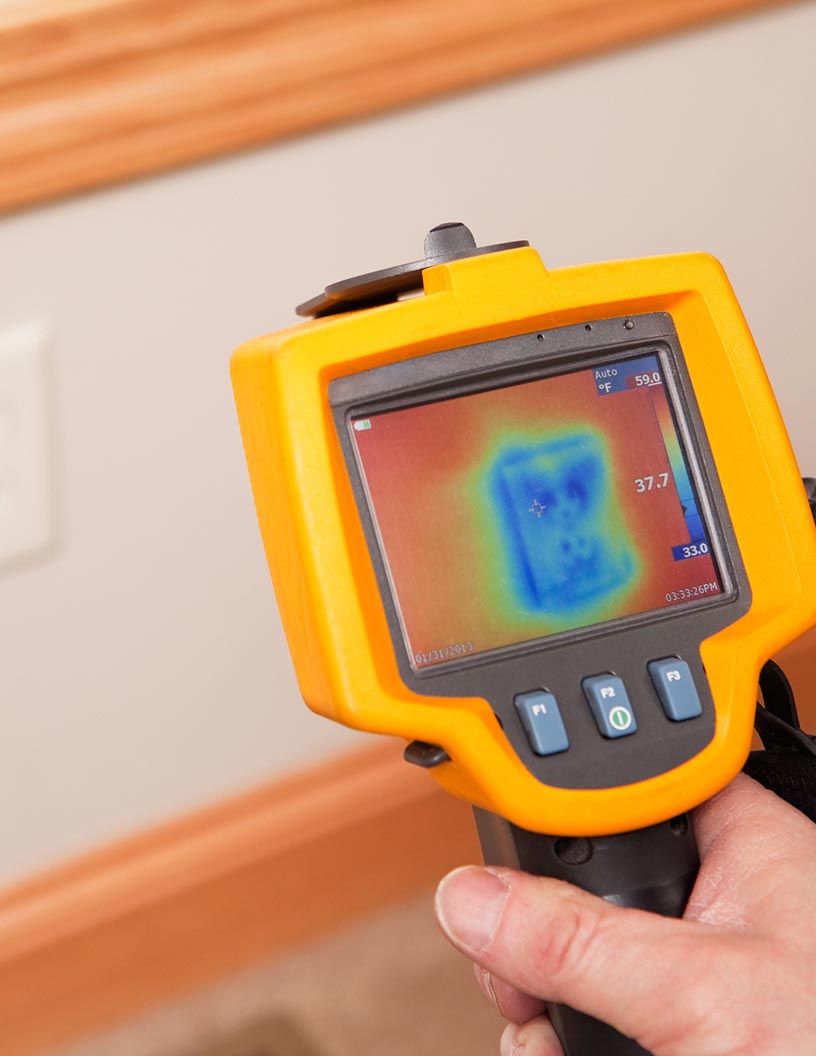
Rugged thermal cameras, also referred to as infrared thermal imaging cameras, are essential devices that produce images using infrared light. These cameras are widely adopted by security and defense industries for continuous monitoring and surveillance. Thermography, a key technology in these cameras, offers distinct advantages over traditional visual cameras. It can provide temperature data and identify heat signatures, enabling the detection of individuals or objects in various conditions, including low light and harsh environments. The global market for rugged thermal cameras is experiencing significant growth due to their applications in security and defense sectors. Thermal imaging is particularly useful for identifying intruders on private property or in restricted zones, enhancing security measures.

Thermal analysis, data logging, and image processing are integral components of these cameras, offering advanced capabilities such as thermal signature analysis, process monitoring, and quality control. In addition, rugged thermal cameras find applications in scientific research, industrial inspection, building maintenance, wildlife monitoring, remote sensing, and environmental monitoring. They are also employed in military applications, including target identification, night vision, and search and rescue operations. With advancements in technology, these cameras now offer features like deep learning, image recognition algorithms, noise reduction, wireless connectivity, image stabilization, and autonomous vehicles. Thermal sensitivity, battery life, predictive maintenance, and energy audits are crucial factors influencing the market's growth.

Ruggedized cameras, with their ability to withstand harsh conditions, are gaining popularity in various industries. Furthermore, the integration of artificial intelligence (AI) and machine vision in thermal imaging software is expected to drive market expansion.

Rugged Thermal Cameras Market Size

Request Free Sample

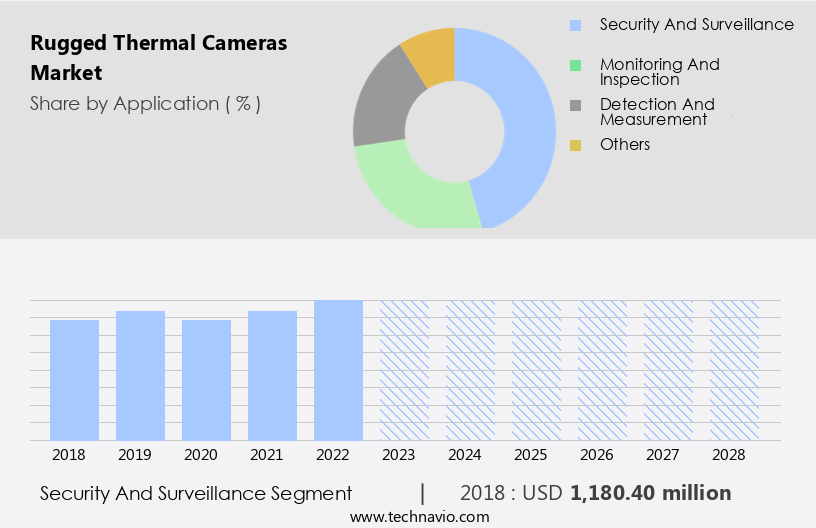
The Security and surveillance segment was valued at USD 1.18 billion in 2018 and showed a gradual increase during the forecast period.

Regional Analysis

North America is estimated to contribute 41% to the growth of the global market during the forecast period.Technavio's analysts have elaborately explained the regional trends and drivers that shape the market during the forecast period.

Rugged Thermal Cameras Market Share by Geography

 Request Free Sample

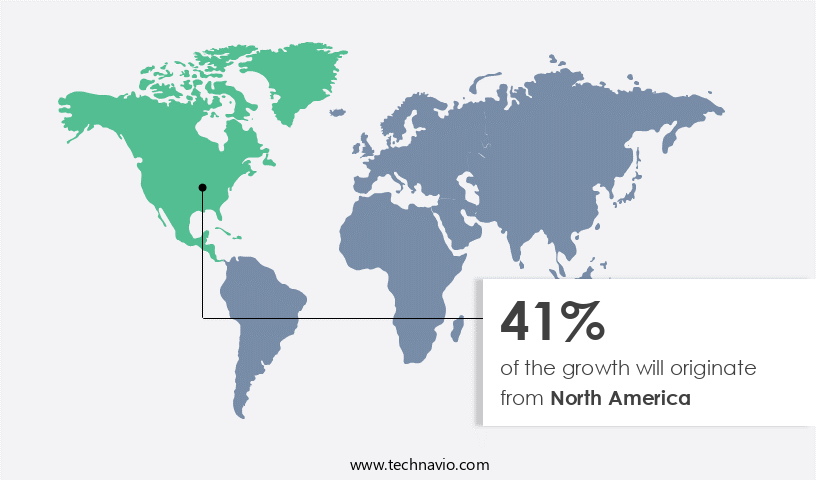
The market in North America is experiencing significant growth due to the presence of prominent defense and military firms, including Lockheed Martin Corporation, BAE Systems plc, and Temporal Defense Systems Inc. These organizations are expanding their investments in various sectors to innovate new defense technologies and weapons. The escalating defense expenditures are anticipated to fuel the demand for rugged thermal cameras in the geospatial industry. Thermal imaging applications, such as thermal signature analysis, process monitoring, and temperature measurement, are crucial components of geospatial research. As research and development activities increase, so does the demand for high-quality thermal imaging solutions.

Rugged thermal cameras offer superior image resolution, frame rate, and noise reduction capabilities, making them indispensable for various thermal imaging applications. Additionally, the integration of artificial intelligence (AI) and machine vision technologies in thermal imaging software further enhances the functionality of rugged thermal cameras. The market is also witnessing the adoption of ruggedized cameras with wireless connectivity, image stabilization, and deep learning algorithms for applications such as predictive maintenance, energy audits, and security industry. The increasing demand for thermal imaging in scientific research, wildlife monitoring, and environmental monitoring further reinforces the market's growth trajectory.

Market Dynamics

Our researchers analyzed the data with 2023 as the base year, along with the key drivers, trends, and challenges. A holistic analysis of drivers will help companies refine their marketing strategies to gain a competitive advantage.

The Global Rugged Thermal Cameras Market thrives with rugged thermal cameras for defense and thermal cameras for industrial inspections. Rugged thermal camera market trends highlight high-resolution thermal imaging and thermal cameras for firefighting. Rugged thermal cameras for surveillance and thermal imaging for search and rescue enhance safety, per rugged thermal camera forecast. IP67-rated thermal cameras leverage thermal cameras with AI analytics, while rugged thermal cameras for oil and gas ensure reliability. Thermal cameras for border security and rugged thermal cameras for construction drive demand. Thermal imaging for predictive maintenance, rugged thermal cameras for utilities, and thermal cameras for environmental monitoring optimize operations. Rugged thermal cameras for automotive, high-sensitivity thermal imaging, thermal cameras for hazardous environments, rugged thermal camera supply chain, advanced thermal camera sensors, and thermal cameras for disaster response fuel growth through 2028.

What are the key market drivers leading to the rise in the adoption of Rugged Thermal Cameras Industry?

  • The significant growth in military expenditures serves as the primary catalyst for the market's expansion. 
  • The global market for rugged thermal cameras is experiencing significant growth due to increasing military spending, which reached USD2.1 trillion in 2021, marking a 6.1% increase from the previous year. This growth can be attributed to substantial investments in research and development (R&D) for next-generation technologies. One such technology is rugged thermal cameras, which are gaining popularity in various industries, including military applications. These cameras are essential for heat detection, enabling predictive maintenance, energy audits, and fault detection. In the security industry, they are used for object recognition and intrusion detection. Furthermore, thermal sensors are increasingly being integrated into autonomous vehicles for improved safety and driver assistance.
  • Advancements in technology, such as image stabilization, thermal signature analysis, and artificial intelligence (AI), are enhancing the capabilities of rugged thermal cameras. For instance, AI algorithms can be used for fault detection and predictive maintenance, enabling organizations to address potential issues before they become major problems. In summary, The market is expected to grow exponentially due to the increasing demand for advanced thermal imaging technology in various industries, including military, security, and transportation. The integration of AI and other advanced technologies is further fueling the market's growth.

What are the market trends shaping the Rugged Thermal Cameras Industry?

  • The latest market trend involves significant advancements in photogrammetry and thermal imaging technologies. These innovations are expected to bring about substantial improvements in various industries, including surveying, agriculture, and security.
  • The market is experiencing significant growth due to the increasing demand for thermal imaging technology in various industries. Thermal analysis, a critical application of thermal imaging, is used for data logging, scientific research, and thermal signature analysis. In the defense industry, thermal imaging plays a crucial role in image processing and thermal image analysis for military applications. Industrial inspection is another major application where thermal cameras are extensively used for process monitoring and building maintenance. The integration of advanced features such as hyperspectral imagery is enhancing the accuracy and quality of thermal images, making it an attractive investment for end-users.
  • Companies are responding to this trend by introducing rugged thermal cameras with advanced capabilities to cater to the evolving needs of the market. For instance, some companies are offering these cameras as optional add-ons to their existing product lines, providing greater flexibility to customers. Overall, the market for rugged thermal cameras is expected to continue its growth trajectory during the forecast period, driven by the increasing demand for thermal imaging technology in various industries.

What challenges does the Rugged Thermal Cameras Industry face during its growth?

  • Inaccuracies in image data collection pose a significant challenge to the industry's growth, as reliable and precise data are essential for driving advancements and innovation within this field. 
  • Rugged thermal cameras play a crucial role in various applications, including remote sensing, temperature measurement, wildlife monitoring, and environmental monitoring. These cameras use thermal imaging technology to convert infrared radiation into visible images, enabling users to detect objects and measure temperatures in various environments. The market for rugged thermal cameras is driven by the increasing demand for machine vision applications, such as quality control and deep learning, which require high-performance thermal imaging systems. One challenge in using thermal cameras is positional accuracy, which is essential for geographic information systems (GISs). Inaccuracies in thermal images can lead to incorrect data analysis and impact the overall effectiveness of the system.
  • Scene contrast and atmospheric clarity are significant factors affecting image resolution, with low-resolution scans resulting in a loss of critical information and high-resolution scans requiring large storage capacities. Furthermore, thermal imaging software and data analysis tools are essential for effectively utilizing thermal camera data. These tools enable users to process and analyze large volumes of data, making it easier to identify patterns and trends. Video recording capabilities add an extra layer of functionality, allowing for real-time monitoring and analysis. In conclusion, the market for rugged thermal cameras is growing due to their increasing applications in various industries. However, challenges such as positional accuracy and data analysis require advanced thermal imaging software and data analysis tools to effectively utilize the data generated by these cameras.

Exclusive Customer Landscape

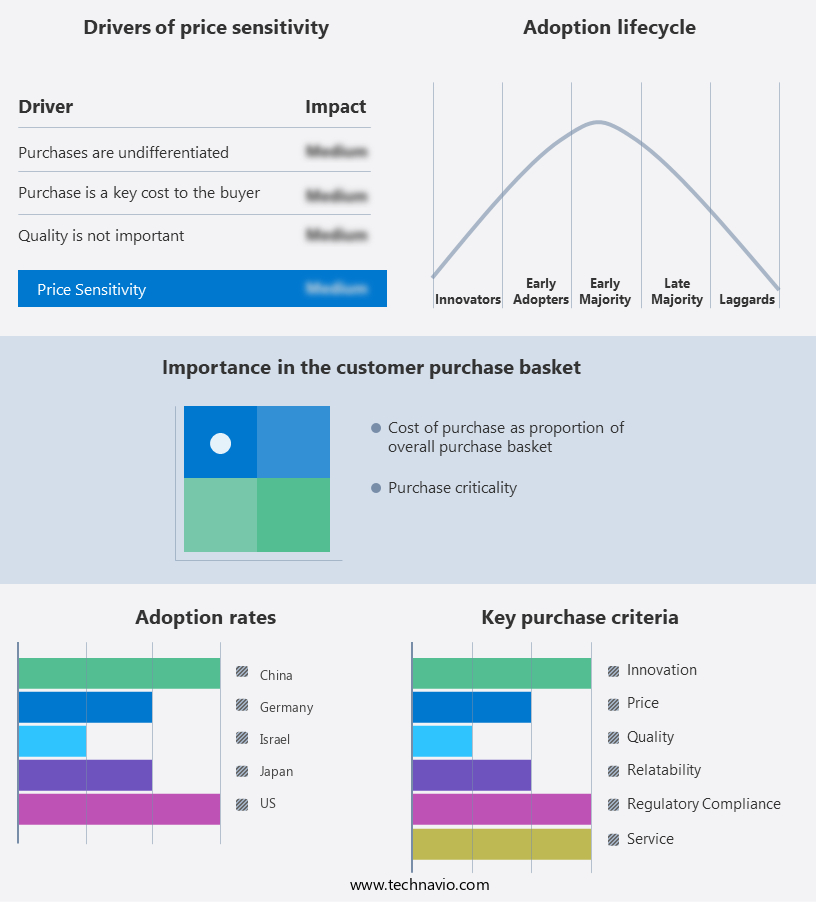
The rugged thermal cameras market forecasting report includes the adoption lifecycle of the market, covering from the innovator's stage to the laggard's stage. It focuses on adoption rates in different regions based on penetration. Furthermore, the rugged thermal cameras market report also includes key purchase criteria and drivers of price sensitivity to help companies evaluate and develop their market growth analysis strategies.

Rugged Thermal Cameras Market Share by Geography

 Customer Landscape

Key Companies & Market Insights

Companies are implementing various strategies, such as strategic alliances, rugged thermal cameras market forecast, partnerships, mergers and acquisitions, geographical expansion, and product/service launches, to enhance their presence in the industry.

The industry research and growth report includes detailed analyses of the competitive landscape of the market and information about key companies, including:

  • FLIR Systems
  • Teledyne Technologies
  • Axis Communications
  • Hikvision
  • Bosch Security
  • Leonardo DRS
  • Opgal
  • Xenics
  • Thermoteknix
  • Seek Thermal
  • InfiRay
  • Guide Infrared
  • Testo
  • Fluke
  • Keysight Technologies
  • AMETEK Land
  • Jenoptik
  • ULIS
  • DIAS Infrared
  • Sierra-Olympic

Qualitative and quantitative analysis of companies has been conducted to help clients understand the wider business environment as well as the strengths and weaknesses of key industry players. Data is qualitatively analyzed to categorize companies as pure play, category-focused, industry-focused, and diversified; it is quantitatively analyzed to categorize companies as dominant, leading, strong, tentative, and weak.

Recent Development and News in Rugged Thermal Cameras Market

  • In January 2023, FLIR Systems, a leading provider of thermal imaging and sensing technologies, announced the launch of the Boson 320 and Boson 640 thermal cores, marking a significant technological advancement in rugged thermal cameras (FLIR Systems Press Release). These new cores offer improved resolution, higher frame rates, and enhanced image quality, making them suitable for various applications, including border security, military, and industrial inspection.
  • In April 2024, Hikvision, a global leader in security solutions, entered into a strategic partnership with Seebo, an Israeli-based thermal imaging technology company (Hikvision Press Release). This collaboration aims to integrate Seebo's advanced thermal imaging algorithms into Hikvision's cameras, enhancing their performance and expanding their product offerings in the market.
  • In July 2024, Teledyne FLIR announced the acquisition of Maritime Research and Technology (MARTEL), a Canadian company specializing in maritime thermal imaging systems (Teledyne FLIR Press Release). This acquisition strengthens Teledyne FLIR's position in the maritime market and provides them with MARTEL's advanced technology and expertise in thermal imaging for maritime applications.

Research Analyst Overview

In the market, operational efficiency and data visualization are key drivers for growth. Cooled thermal cameras with high thermal resolution and user-friendly software enable real-time corrosion detection and pattern recognition, enhancing operational readiness and safety. Hyperspectral imaging and machine learning algorithms offer advanced capabilities for condition assessment, target tracking, and heat loss analysis. Uncooled thermal cameras with multispectral capabilities and temperature mapping provide cost savings through risk reduction and improved situational awareness. Infrastructure inspection, border security, fire prevention, and pipeline inspection are primary applications, while spectral range and wavelength sensitivity cater to diverse industries.

Thermal signature libraries and image fusion facilitate data interpretation, enabling accurate object classification and intrusion detection. Thermal contrast and operator interface enhance the effectiveness of visible light cameras, making thermal imaging training essential for optimal performance.

Dive into Technavio's robust research methodology, blending expert interviews, extensive data synthesis, and validated models for unparalleled Rugged Thermal Cameras Market insights. See full methodology.

Market Scope

Report Coverage

Details

Page number

162

Base year

2023

Historic period

2018-2022

Forecast period

2024-2028

Growth momentum & CAGR

Accelerate at a CAGR of 8.51%

Market growth 2024-2028

USD 2677.3 million

Market structure

Fragmented

YoY growth 2023-2024(%)

7.67

Key countries

US, China, Germany, Japan, UK, Australia, India, France, Brazil, UAE, Rest of World (ROW), Saudi Arabia, France, South Korea, Mexico, Italy, and Spain

Competitive landscape

Leading Companies, Market Positioning of Companies, Competitive Strategies, and Industry Risks

Request Free Sample

What are the Key Data Covered in this Rugged Thermal Cameras Market Research and Growth Report?

  • CAGR of the Rugged Thermal Cameras industry during the forecast period
  • Detailed information on factors that will drive the growth and forecasting between 2024 and 2028
  • Precise estimation of the size of the market and its contribution of the industry in focus to the parent market
  • Accurate predictions about upcoming growth and trends and changes in consumer behaviour
  • Growth of the market across North America, APAC, Europe, Middle East and Africa, and South America
  • Thorough analysis of the market's competitive landscape and detailed information about companies
  • Comprehensive analysis of factors that will challenge the rugged thermal cameras market growth of industry companies

We can help! Our analysts can customize this rugged thermal cameras market research report to meet your requirements.

Get in touch

1 Executive Summary

  • 1.1 Market overview
    • Executive Summary - Chart on Market Overview
    • Executive Summary - Data Table on Market Overview
    • Executive Summary - Chart on Global Market Characteristics
    • Executive Summary - Chart on Market by Geography
    • Executive Summary - Chart on Market Segmentation by Application
    • Executive Summary - Chart on Market Segmentation by End-user
    • Executive Summary - Chart on Incremental Growth
    • Executive Summary - Data Table on Incremental Growth
    • Executive Summary - Chart on Company Market Positioning

2 Market Landscape

  • 2.1 Market ecosystem
    • Parent Market
    • Data Table on - Parent Market
  • 2.2 Market characteristics
    • Market characteristics analysis
  • 2.3 Value chain analysis
    • Value Chain Analysis

3 Market Sizing

  • 3.1 Market definition
    • Offerings of companies included in the market definition
  • 3.2 Market segment analysis
    • Market segments
  • 3.3 Market size 2023
    • 3.4 Market outlook: Forecast for 2023-2028
      • Chart on Global - Market size and forecast 2023-2028 ($ million)
      • Data Table on Global - Market size and forecast 2023-2028 ($ million)
      • Chart on Global Market: Year-over-year growth 2023-2028 (%)
      • Data Table on Global Market: Year-over-year growth 2023-2028 (%)

    4 Historic Market Size

    • 4.1 Global Rugged Thermal Cameras Market 2018 - 2022
      • Historic Market Size - Data Table on Global Rugged Thermal Cameras Market 2018 - 2022 ($ million)
    • 4.2 Application segment analysis 2018 - 2022
      • Historic Market Size - Application Segment 2018 - 2022 ($ million)
    • 4.3 End-user segment analysis 2018 - 2022
      • Historic Market Size - End-user Segment 2018 - 2022 ($ million)
    • 4.4 Geography segment analysis 2018 - 2022
      • Historic Market Size - Geography Segment 2018 - 2022 ($ million)
    • 4.5 Country segment analysis 2018 - 2022
      • Historic Market Size - Country Segment 2018 - 2022 ($ million)

    5 Five Forces Analysis

    • 5.1 Five forces summary
      • Five forces analysis - Comparison between 2023 and 2028
    • 5.2 Bargaining power of buyers
      • Bargaining power of buyers - Impact of key factors 2023 and 2028
    • 5.3 Bargaining power of suppliers
      • Bargaining power of suppliers - Impact of key factors in 2023 and 2028
    • 5.4 Threat of new entrants
      • Threat of new entrants - Impact of key factors in 2023 and 2028
    • 5.5 Threat of substitutes
      • Threat of substitutes - Impact of key factors in 2023 and 2028
    • 5.6 Threat of rivalry
      • Threat of rivalry - Impact of key factors in 2023 and 2028
    • 5.7 Market condition
      • Chart on Market condition - Five forces 2023 and 2028

    6 Market Segmentation by Application

    • 6.1 Market segments
      • Chart on Application - Market share (2023-2028) (%)
      • Data Table on Application - Market share (2023-2028) (%)
    • 6.2 Comparison by Application
      • Chart on Comparison by Application
      • Data Table on Comparison by Application
    • 6.3 Security and surveillance - Market size and forecast (2023-2028)
      • Chart on Security and surveillance - Market size and forecast (2023-2028) ($ million)
      • Data Table on Security and surveillance - Market size and forecast (2023-2028) ($ million)
      • Chart on Security and surveillance - Year-over-year growth (2023-2028) (%)
      • Data Table on Security and surveillance - Year-over-year growth (2023-2028) (%)
    • 6.4 Monitoring and inspection - Market size and forecast (2023-2028)
      • Chart on Monitoring and inspection - Market size and forecast (2023-2028) ($ million)
      • Data Table on Monitoring and inspection - Market size and forecast (2023-2028) ($ million)
      • Chart on Monitoring and inspection - Year-over-year growth (2023-2028) (%)
      • Data Table on Monitoring and inspection - Year-over-year growth (2023-2028) (%)
    • 6.5 Detection and measurement - Market size and forecast (2023-2028)
      • Chart on Detection and measurement - Market size and forecast (2023-2028) ($ million)
      • Data Table on Detection and measurement - Market size and forecast (2023-2028) ($ million)
      • Chart on Detection and measurement - Year-over-year growth (2023-2028) (%)
      • Data Table on Detection and measurement - Year-over-year growth (2023-2028) (%)
    • 6.6 Others - Market size and forecast (2023-2028)
      • Chart on Others - Market size and forecast (2023-2028) ($ million)
      • Data Table on Others - Market size and forecast (2023-2028) ($ million)
      • Chart on Others - Year-over-year growth (2023-2028) (%)
      • Data Table on Others - Year-over-year growth (2023-2028) (%)
    • 6.7 Market opportunity by Application
      • Market opportunity by Application ($ million)
      • Data Table on Market opportunity by Application ($ million)

    7 Market Segmentation by End-user

    • 7.1 Market segments
      • Chart on End-user - Market share (2023-2028) (%)
      • Data Table on End-user - Market share (2023-2028) (%)
    • 7.2 Comparison by End-user
      • Chart on Comparison by End-user
      • Data Table on Comparison by End-user
    • 7.3 Military and defense - Market size and forecast (2023-2028)
      • Chart on Military and defense - Market size and forecast (2023-2028) ($ million)
      • Data Table on Military and defense - Market size and forecast (2023-2028) ($ million)
      • Chart on Military and defense - Year-over-year growth (2023-2028) (%)
      • Data Table on Military and defense - Year-over-year growth (2023-2028) (%)
    • 7.4 Commercial - Market size and forecast (2023-2028)
      • Chart on Commercial - Market size and forecast (2023-2028) ($ million)
      • Data Table on Commercial - Market size and forecast (2023-2028) ($ million)
      • Chart on Commercial - Year-over-year growth (2023-2028) (%)
      • Data Table on Commercial - Year-over-year growth (2023-2028) (%)
    • 7.5 Industrial - Market size and forecast (2023-2028)
      • Chart on Industrial - Market size and forecast (2023-2028) ($ million)
      • Data Table on Industrial - Market size and forecast (2023-2028) ($ million)
      • Chart on Industrial - Year-over-year growth (2023-2028) (%)
      • Data Table on Industrial - Year-over-year growth (2023-2028) (%)
    • 7.6 Residential - Market size and forecast (2023-2028)
      • Chart on Residential - Market size and forecast (2023-2028) ($ million)
      • Data Table on Residential - Market size and forecast (2023-2028) ($ million)
      • Chart on Residential - Year-over-year growth (2023-2028) (%)
      • Data Table on Residential - Year-over-year growth (2023-2028) (%)
    • 7.7 Market opportunity by End-user
      • Market opportunity by End-user ($ million)
      • Data Table on Market opportunity by End-user ($ million)

    8 Market Segmentation by Type

    • 8.1 Market segments
      • Chart on Type - Market share (2023-2028) (%)
      • Data Table on Type - Market share (2023-2028) (%)
    • 8.2 Comparison by Type
      • Chart on Comparison by Type
      • Data Table on Comparison by Type
    • 8.3 Handheld - Market size and forecast (2023-2028)
      • Chart on Handheld - Market size and forecast (2023-2028) ($ million)
      • Data Table on Handheld - Market size and forecast (2023-2028) ($ million)
      • Chart on Handheld - Year-over-year growth (2023-2028) (%)
      • Data Table on Handheld - Year-over-year growth (2023-2028) (%)
    • 8.4 Fixed - Market size and forecast (2023-2028)
      • Chart on Fixed - Market size and forecast (2023-2028) ($ million)
      • Data Table on Fixed - Market size and forecast (2023-2028) ($ million)
      • Chart on Fixed - Year-over-year growth (2023-2028) (%)
      • Data Table on Fixed - Year-over-year growth (2023-2028) (%)
    • 8.5 Market opportunity by Type
      • Market opportunity by Type ($ million)
      • Data Table on Market opportunity by Type ($ million)

    9 Market Segmentation by Technology Specificity

    • 9.1 Market segments
      • Chart on Technology Specificity - Market share (2023-2028) (%)
      • Data Table on Technology Specificity - Market share (2023-2028) (%)
    • 9.2 Comparison by Technology Specificity
      • Chart on Comparison by Technology Specificity
      • Data Table on Comparison by Technology Specificity
    • 9.3 Cooled - Market size and forecast (2023-2028)
      • Chart on Cooled - Market size and forecast (2023-2028) ($ million)
      • Data Table on Cooled - Market size and forecast (2023-2028) ($ million)
      • Chart on Cooled - Year-over-year growth (2023-2028) (%)
      • Data Table on Cooled - Year-over-year growth (2023-2028) (%)
    • 9.4 Uncooled - Market size and forecast (2023-2028)
      • Chart on Uncooled - Market size and forecast (2023-2028) ($ million)
      • Data Table on Uncooled - Market size and forecast (2023-2028) ($ million)
      • Chart on Uncooled - Year-over-year growth (2023-2028) (%)
      • Data Table on Uncooled - Year-over-year growth (2023-2028) (%)
    • 9.5 Market opportunity by Technology Specificity
      • Market opportunity by Technology Specificity ($ million)
      • Data Table on Market opportunity by Technology Specificity ($ million)

    10 Customer Landscape

    • 10.1 Customer landscape overview
      • Analysis of price sensitivity, lifecycle, customer purchase basket, adoption rates, and purchase criteria

    11 Geographic Landscape

    • 11.1 Geographic segmentation
      • Chart on Market share by geography 2023-2028 (%)
      • Data Table on Market share by geography 2023-2028 (%)
    • 11.2 Geographic comparison
      • Chart on Geographic comparison
      • Data Table on Geographic comparison
    • 11.3 North America - Market size and forecast 2023-2028
      • Chart on North America - Market size and forecast 2023-2028 ($ million)
      • Data Table on North America - Market size and forecast 2023-2028 ($ million)
      • Chart on North America - Year-over-year growth 2023-2028 (%)
      • Data Table on North America - Year-over-year growth 2023-2028 (%)
    • 11.4 APAC - Market size and forecast 2023-2028
      • Chart on APAC - Market size and forecast 2023-2028 ($ million)
      • Data Table on APAC - Market size and forecast 2023-2028 ($ million)
      • Chart on APAC - Year-over-year growth 2023-2028 (%)
      • Data Table on APAC - Year-over-year growth 2023-2028 (%)
    • 11.5 Europe - Market size and forecast 2023-2028
      • Chart on Europe - Market size and forecast 2023-2028 ($ million)
      • Data Table on Europe - Market size and forecast 2023-2028 ($ million)
      • Chart on Europe - Year-over-year growth 2023-2028 (%)
      • Data Table on Europe - Year-over-year growth 2023-2028 (%)
    • 11.6 Middle East and Africa - Market size and forecast 2023-2028
      • Chart on Middle East and Africa - Market size and forecast 2023-2028 ($ million)
      • Data Table on Middle East and Africa - Market size and forecast 2023-2028 ($ million)
      • Chart on Middle East and Africa - Year-over-year growth 2023-2028 (%)
      • Data Table on Middle East and Africa - Year-over-year growth 2023-2028 (%)
    • 11.7 South America - Market size and forecast 2023-2028
      • Chart on South America - Market size and forecast 2023-2028 ($ million)
      • Data Table on South America - Market size and forecast 2023-2028 ($ million)
      • Chart on South America - Year-over-year growth 2023-2028 (%)
      • Data Table on South America - Year-over-year growth 2023-2028 (%)
    • 11.8 US - Market size and forecast 2023-2028
      • Chart on US - Market size and forecast 2023-2028 ($ million)
      • Data Table on US - Market size and forecast 2023-2028 ($ million)
      • Chart on US - Year-over-year growth 2023-2028 (%)
      • Data Table on US - Year-over-year growth 2023-2028 (%)
    • 11.9 China - Market size and forecast 2023-2028
      • Chart on China - Market size and forecast 2023-2028 ($ million)
      • Data Table on China - Market size and forecast 2023-2028 ($ million)
      • Chart on China - Year-over-year growth 2023-2028 (%)
      • Data Table on China - Year-over-year growth 2023-2028 (%)
    • 11.10 Israel - Market size and forecast 2023-2028
      • Chart on Israel - Market size and forecast 2023-2028 ($ million)
      • Data Table on Israel - Market size and forecast 2023-2028 ($ million)
      • Chart on Israel - Year-over-year growth 2023-2028 (%)
      • Data Table on Israel - Year-over-year growth 2023-2028 (%)
    • 11.11 Germany - Market size and forecast 2023-2028
      • Chart on Germany - Market size and forecast 2023-2028 ($ million)
      • Data Table on Germany - Market size and forecast 2023-2028 ($ million)
      • Chart on Germany - Year-over-year growth 2023-2028 (%)
      • Data Table on Germany - Year-over-year growth 2023-2028 (%)
    • 11.12 Japan - Market size and forecast 2023-2028
      • Chart on Japan - Market size and forecast 2023-2028 ($ million)
      • Data Table on Japan - Market size and forecast 2023-2028 ($ million)
      • Chart on Japan - Year-over-year growth 2023-2028 (%)
      • Data Table on Japan - Year-over-year growth 2023-2028 (%)
    • 11.13 Market opportunity by geography
      • Market opportunity by geography ($ million)
      • Data Tables on Market opportunity by geography ($ million)
    • 11.14 US - Market size and forecast (2023-2028)
      • Chart on US - Market size and forecast (2023-2028) ($ million)
      • Data Table on US - Market size and forecast (2023-2028) ($ million)
      • Chart on US - Year-over-year growth (2023-2028) (%)
      • Data Table on US - Year-over-year growth (2023-2028) (%)
    • 11.15 UK - Market size and forecast (2023-2028)
      • Chart on UK - Market size and forecast (2023-2028) ($ million)
      • Data Table on UK - Market size and forecast (2023-2028) ($ million)
      • Chart on UK - Year-over-year growth (2023-2028) (%)
      • Data Table on UK - Year-over-year growth (2023-2028) (%)
    • 11.16 Australia - Market size and forecast (2023-2028)
      • Chart on Australia - Market size and forecast (2023-2028) ($ million)
      • Data Table on Australia - Market size and forecast (2023-2028) ($ million)
      • Chart on Australia - Year-over-year growth (2023-2028) (%)
      • Data Table on Australia - Year-over-year growth (2023-2028) (%)
    • 11.17 India - Market size and forecast (2023-2028)
      • Chart on India - Market size and forecast (2023-2028) ($ million)
      • Data Table on India - Market size and forecast (2023-2028) ($ million)
      • Chart on India - Year-over-year growth (2023-2028) (%)
      • Data Table on India - Year-over-year growth (2023-2028) (%)
    • 11.18 France - Market size and forecast (2023-2028)
      • Chart on France - Market size and forecast (2023-2028) ($ million)
      • Data Table on France - Market size and forecast (2023-2028) ($ million)
      • Chart on France - Year-over-year growth (2023-2028) (%)
      • Data Table on France - Year-over-year growth (2023-2028) (%)
    • 11.19 Brazil - Market size and forecast (2023-2028)
      • Chart on Brazil - Market size and forecast (2023-2028) ($ million)
      • Data Table on Brazil - Market size and forecast (2023-2028) ($ million)
      • Chart on Brazil - Year-over-year growth (2023-2028) (%)
      • Data Table on Brazil - Year-over-year growth (2023-2028) (%)
    • 11.20 UAE - Market size and forecast (2023-2028)
      • Chart on UAE - Market size and forecast (2023-2028) ($ million)
      • Data Table on UAE - Market size and forecast (2023-2028) ($ million)
      • Chart on UAE - Year-over-year growth (2023-2028) (%)
      • Data Table on UAE - Year-over-year growth (2023-2028) (%)
    • 11.21 Rest of World (ROW) - Market size and forecast (2023-2028)
      • Chart on Rest of World (ROW) - Market size and forecast (2023-2028) ($ million)
      • Data Table on Rest of World (ROW) - Market size and forecast (2023-2028) ($ million)
      • Chart on Rest of World (ROW) - Year-over-year growth (2023-2028) (%)
      • Data Table on Rest of World (ROW) - Year-over-year growth (2023-2028) (%)
    • 11.22 Saudi Arabia - Market size and forecast (2023-2028)
      • Chart on Saudi Arabia - Market size and forecast (2023-2028) ($ million)
      • Data Table on Saudi Arabia - Market size and forecast (2023-2028) ($ million)
      • Chart on Saudi Arabia - Year-over-year growth (2023-2028) (%)
      • Data Table on Saudi Arabia - Year-over-year growth (2023-2028) (%)
    • 11.23 South Korea - Market size and forecast (2023-2028)
      • Chart on South Korea - Market size and forecast (2023-2028) ($ million)
      • Data Table on South Korea - Market size and forecast (2023-2028) ($ million)
      • Chart on South Korea - Year-over-year growth (2023-2028) (%)
      • Data Table on South Korea - Year-over-year growth (2023-2028) (%)
    • 11.24 Mexico - Market size and forecast (2023-2028)
      • Chart on Mexico - Market size and forecast (2023-2028) ($ million)
      • Data Table on Mexico - Market size and forecast (2023-2028) ($ million)
      • Chart on Mexico - Year-over-year growth (2023-2028) (%)
      • Data Table on Mexico - Year-over-year growth (2023-2028) (%)
    • 11.25 Italy - Market size and forecast (2023-2028)
      • Chart on Italy - Market size and forecast (2023-2028) ($ million)
      • Data Table on Italy - Market size and forecast (2023-2028) ($ million)
      • Chart on Italy - Year-over-year growth (2023-2028) (%)
      • Data Table on Italy - Year-over-year growth (2023-2028) (%)
    • 11.26 Spain - Market size and forecast (2023-2028)
      • Chart on Spain - Market size and forecast (2023-2028) ($ million)
      • Data Table on Spain - Market size and forecast (2023-2028) ($ million)
      • Chart on Spain - Year-over-year growth (2023-2028) (%)
      • Data Table on Spain - Year-over-year growth (2023-2028) (%)

    12 Drivers, Challenges, and Opportunity/Restraints

    • 12.1 Market drivers
      • 12.2 Market challenges
        • 12.3 Impact of drivers and challenges
          • Impact of drivers and challenges in 2023 and 2028
        • 12.4 Market opportunities/restraints

          13 Competitive Landscape

          • 13.1 Overview
            • 13.2 Competitive Landscape
              • Overview on criticality of inputs and factors of differentiation
            • 13.3 Landscape disruption
              • Overview on factors of disruption
            • 13.4 Industry risks
              • Impact of key risks on business

            14 Competitive Analysis

            • 14.1 Companies profiled
              • Companies covered
            • 14.2 Market positioning of companies
              • Matrix on companies position and classification
            • 14.3 FLIR Systems
              • FLIR Systems - Overview
              • FLIR Systems - Product / Service
              • FLIR Systems - Key offerings
            • 14.4 Teledyne Technologies
              • Teledyne Technologies - Overview
              • Teledyne Technologies - Product / Service
              • Teledyne Technologies - Key offerings
            • 14.5 Axis Communications
              • Axis Communications - Overview
              • Axis Communications - Product / Service
              • Axis Communications - Key offerings
            • 14.6 Hikvision
              • Hikvision - Overview
              • Hikvision - Product / Service
              • Hikvision - Key offerings
            • 14.7 Bosch Security
              • Bosch Security - Overview
              • Bosch Security - Product / Service
              • Bosch Security - Key offerings
            • 14.8 Leonardo DRS
              • Leonardo DRS - Overview
              • Leonardo DRS - Product / Service
              • Leonardo DRS - Key offerings
            • 14.9 Opgal
              • Opgal - Overview
              • Opgal - Product / Service
              • Opgal - Key offerings
            • 14.10 Xenics
              • Xenics - Overview
              • Xenics - Product / Service
              • Xenics - Key offerings
            • 14.11 Thermoteknix
              • Thermoteknix - Overview
              • Thermoteknix - Product / Service
              • Thermoteknix - Key offerings
            • 14.12 Seek Thermal
              • Seek Thermal - Overview
              • Seek Thermal - Product / Service
              • Seek Thermal - Key offerings
            • 14.13 InfiRay
              • InfiRay - Overview
              • InfiRay - Product / Service
              • InfiRay - Key offerings
            • 14.14 Guide Infrared
              • Guide Infrared - Overview
              • Guide Infrared - Product / Service
              • Guide Infrared - Key offerings
            • 14.15 Testo
              • Testo - Overview
              • Testo - Product / Service
              • Testo - Key offerings
            • 14.16 Fluke
              • Fluke - Overview
              • Fluke - Product / Service
              • Fluke - Key offerings
            • 14.17 Keysight Technologies
              • Keysight Technologies - Overview
              • Keysight Technologies - Product / Service
              • Keysight Technologies - Key offerings
            • 14.18 AMETEK Land
              • AMETEK Land - Overview
              • AMETEK Land - Product / Service
              • AMETEK Land - Key offerings
            • 14.19 Jenoptik
              • Jenoptik - Overview
              • Jenoptik - Product / Service
              • Jenoptik - Key offerings
            • 14.20 ULIS
              • ULIS - Overview
              • ULIS - Product / Service
              • ULIS - Key offerings
            • 14.21 DIAS Infrared
              • DIAS Infrared - Overview
              • DIAS Infrared - Product / Service
              • DIAS Infrared - Key offerings
            • 14.22 Sierra-Olympic
              • Sierra-Olympic - Overview
              • Sierra-Olympic - Product / Service
              • Sierra-Olympic - Key offerings
            • 14.23 AB SKF
              • AB SKF - Overview
              • AB SKF - Product / Service
              • AB SKF - Key offerings
            • 14.24 Ascendent Technology Group Inc.
              • Ascendent Technology Group Inc. - Overview
              • Ascendent Technology Group Inc. - Product / Service
              • Ascendent Technology Group Inc. - Key offerings
            • 14.25 Astronics Corp.
              • Astronics Corp. - Overview
              • Astronics Corp. - Product / Service
              • Astronics Corp. - Key offerings
            • 14.26 Axis Communications AB
              • Axis Communications AB - Overview
              • Axis Communications AB - Product / Service
              • Axis Communications AB - Key offerings
            • 14.27 BAE Systems Plc
              • BAE Systems Plc - Overview
              • BAE Systems Plc - Product / Service
              • BAE Systems Plc - Key offerings
            • 14.28 Bullard
              • Bullard - Overview
              • Bullard - Product / Service
              • Bullard - Key offerings
            • 14.29 Fluke Corp.
              • Fluke Corp. - Overview
              • Fluke Corp. - Product / Service
              • Fluke Corp. - Key offerings
            • 14.30 Honeywell International Inc.
              • Honeywell International Inc. - Overview
              • Honeywell International Inc. - Product / Service
              • Honeywell International Inc. - Key offerings
            • 14.31 L3Harris Technologies Inc.
              • L3Harris Technologies Inc. - Overview
              • L3Harris Technologies Inc. - Product / Service
              • L3Harris Technologies Inc. - Key offerings
            • 14.32 Leonardo DRS Inc.
              • Leonardo DRS Inc. - Overview
              • Leonardo DRS Inc. - Product / Service
              • Leonardo DRS Inc. - Key offerings
            • 14.33 Liteye Systems Inc.
              • Liteye Systems Inc. - Overview
              • Liteye Systems Inc. - Product / Service
              • Liteye Systems Inc. - Key offerings
            • 14.34 Opgal Optronic Industries Ltd.
              • Opgal Optronic Industries Ltd. - Overview
              • Opgal Optronic Industries Ltd. - Product / Service
              • Opgal Optronic Industries Ltd. - Key offerings
            • 14.35 Robert Bosch GmbH
              • Robert Bosch GmbH - Overview
              • Robert Bosch GmbH - Product / Service
              • Robert Bosch GmbH - Key offerings
            • 14.36 SparkFun Electronics
              • SparkFun Electronics - Overview
              • SparkFun Electronics - Product / Service
              • SparkFun Electronics - Key offerings
            • 14.37 Teledyne Technologies Inc.
              • Teledyne Technologies Inc. - Overview
              • Teledyne Technologies Inc. - Product / Service
              • Teledyne Technologies Inc. - Key offerings
            • 14.38 Terabee SAS
              • Terabee SAS - Overview
              • Terabee SAS - Product / Service
              • Terabee SAS - Key offerings
            • 14.39 Thermoteknix Systems Ltd.
              • Thermoteknix Systems Ltd. - Overview
              • Thermoteknix Systems Ltd. - Product / Service
              • Thermoteknix Systems Ltd. - Key offerings
            • 14.40 Xenics nv
              • Xenics nv - Overview
              • Xenics nv - Product / Service
              • Xenics nv - Key offerings

            15 Appendix

            • 15.1 Scope of the report
              • 15.2 Inclusions and exclusions checklist
                • Inclusions checklist
                • Exclusions checklist
              • 15.3 Currency conversion rates for US$
                • Currency conversion rates for US$
              • 15.4 Research methodology
                • Research methodology
              • 15.5 Data procurement
                • Information sources
              • 15.6 Data validation
                • Data validation
              • 15.7 Validation techniques employed for market sizing
                • Validation techniques employed for market sizing
              • 15.8 Data synthesis
                • Data synthesis
              • 15.9 360 degree market analysis
                • 360 degree market analysis
              • 15.10 List of abbreviations
                • List of abbreviations

              Research Methodology

              Technavio presents a detailed picture of the market by way of study, synthesis, and summation of data from multiple sources. The analysts have presented the various facets of the market with a particular focus on identifying the key industry influencers. The data thus presented is comprehensive, reliable, and the result of extensive research, both primary and secondary.

              INFORMATION SOURCES

              Primary sources

              • Manufacturers and suppliers
              • Channel partners
              • Industry experts
              • Strategic decision makers

              Secondary sources

              • Industry journals and periodicals
              • Government data
              • Financial reports of key industry players
              • Historical data
              • Press releases

              DATA ANALYSIS

              Data Synthesis

              • Collation of data
              • Estimation of key figures
              • Analysis of derived insights

              Data Validation

              • Triangulation with data models
              • Reference against proprietary databases
              • Corroboration with industry experts

              REPORT WRITING

              Qualitative

              • Market drivers
              • Market challenges
              • Market trends
              • Five forces analysis

              Quantitative

              • Market size and forecast
              • Market segmentation
              • Geographical insights
              • Competitive landscape

              Interested in this report?

              Get your sample now to see our research methodology and insights!

              Download Now

              Frequently Asked Questions

              Rugged Thermal Cameras market growth will increase by $ 2677.3 mn during 2024-2028.

              The Rugged Thermal Cameras market is expected to grow at a CAGR of 8.51% during 2024-2028.

              Rugged Thermal Cameras market is segmented by Application( Security and surveillance, Monitoring and inspection, Detection and measurement, Others) End-user( Military and defense, Commercial, Industrial, Residential)

              FLIR Systems, Teledyne Technologies, Axis Communications, Hikvision, Bosch Security, Leonardo DRS, Opgal, Xenics, Thermoteknix, Seek Thermal, InfiRay, Guide Infrared, Testo, Fluke, Keysight Technologies, AMETEK Land, Jenoptik, ULIS, DIAS Infrared, Sierra-Olympic are a few of the key vendors in the Rugged Thermal Cameras market.

              North America will register the highest growth rate of 41% among the other regions. Therefore, the Rugged Thermal Cameras market in North America is expected to garner significant business opportunities for the vendors during the forecast period.

              US, China, Germany, Japan, UK, Australia, India, France, Brazil, UAE, Rest of World (ROW), Saudi Arabia, France, South Korea, Mexico, Italy, Spain

              • Increasing military expenditureGlobal military spending grew by 6.1% in 2021 and accounted for $2.1 trillion. Amid the economic fallout triggered by the outbreak of COVID-19 is the driving factor this market.
              • global military spending grew significantly from April 2020-April 2022. This is primarily attributed to increasing R and D spending is the driving factor this market.
              • which is focused on the development of next-generation technologies is the driving factor this market.
              • such as rugged thermal cameras. Thus is the driving factor this market.
              • the global rugged thermal cameras market is expected to grow exponentially during the forecast period. For instance is the driving factor this market.
              • the high revenue generated from its oil and gas industry helped Russia increase its military spending in 2021. Furthermore is the driving factor this market.
              • China was the second-largest spender in the military sector and allocated about $293 billion to its military in 2021 is the driving factor this market.
              • an increase of 4.7% compared with the spending in 2020. Therefore is the driving factor this market.
              • the global rugged thermal cameras market is expected to witness growth during the forecast period. is the driving factor this market.

              The Rugged Thermal Cameras market vendors should focus on grabbing business opportunities from the Security and surveillance segment as it accounted for the largest market share in the base year.