Sensor Patch Market Analysis, Size, and Forecast 2026-2030: North America (US, Canada, and Mexico), APAC (China, India, and Japan), Europe (Germany, UK, and France), South America (Brazil and Argentina), Middle East and Africa (Saudi Arabia, UAE, and South Africa), and Rest of World (ROW)

Sensor Patch Market Analysis, Size, and Forecast 2026-2030:
North America (US, Canada, and Mexico), APAC (China, India, and Japan), Europe (Germany, UK, and France), South America (Brazil and Argentina), Middle East and Africa (Saudi Arabia, UAE, and South Africa), and Rest of World (ROW)

Published: Jan 2026 285 Pages SKU: IRTNTR72121

Market Overview at a Glance

$8.43 B
Market Opportunity
30%
CAGR 2025 - 2030
37.2%
North America Growth
$922.2 Mn
Diagnostics segment 2024

Sensor Patch Market Size 2026-2030

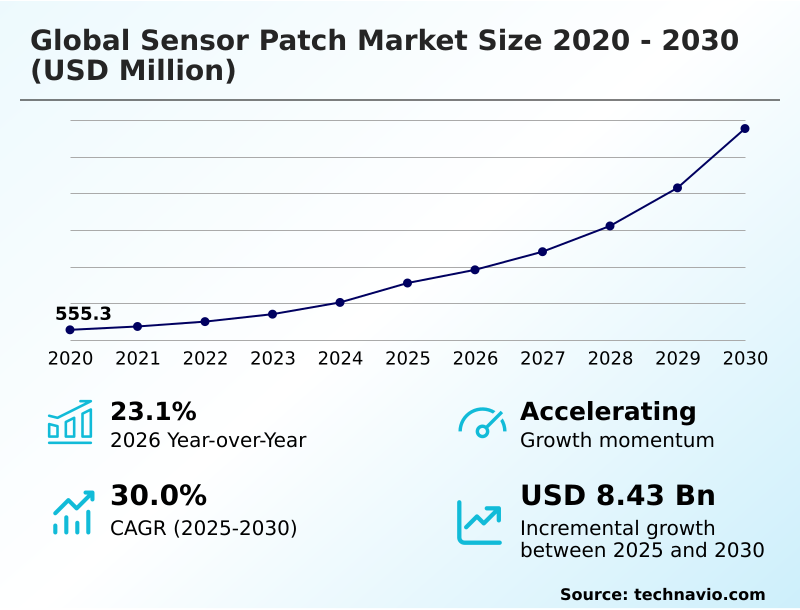
The sensor patch market size is valued to increase by USD 8.43 billion, at a CAGR of 30% from 2025 to 2030. Rise of smart sensor patches in modern medicine will drive the sensor patch market.

Major Market Trends & Insights

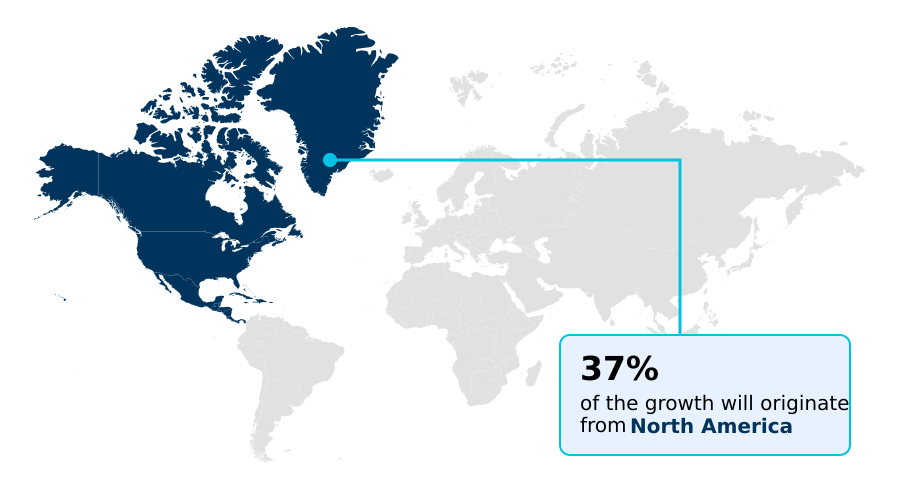
  • North America dominated the market and accounted for a 37.2% growth during the forecast period.
  • By Application - Diagnostics segment was valued at USD 922.2 million in 2024
  • By End-user - Healthcare segment accounted for the largest market revenue share in 2024

Market Size & Forecast

  • Market Opportunities: USD 10.98 billion
  • Market Future Opportunities: USD 8.43 billion
  • CAGR from 2025 to 2030 : 30%

Market Summary

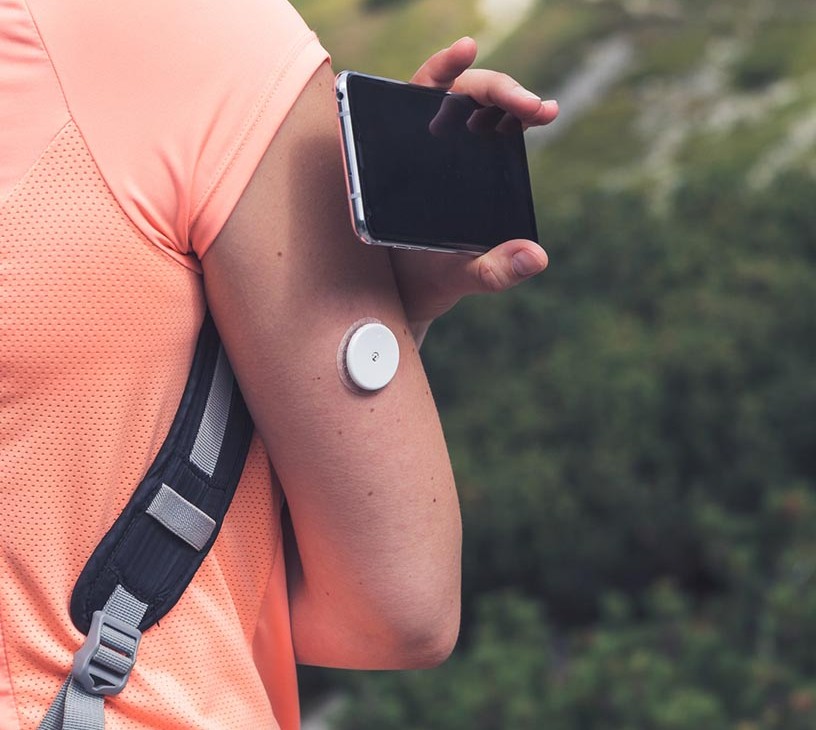
  • The sensor patch market is undergoing a significant transformation, driven by a paradigm shift in healthcare from reactive treatment to proactive wellness management. This evolution is underpinned by advancements in wearable biosensor technology, which enables the continuous collection of physiological data outside of clinical settings.
  • Innovations in biocompatible adhesives and sensor miniaturization have improved user comfort and adherence, making long-term remote patient monitoring a viable reality. For instance, in post-operative care, hospitals are deploying patches for vital signs monitoring to facilitate earlier discharge, which optimizes bed utilization and reduces healthcare costs without compromising patient safety. This application of biometric data analysis supports better clinical decision-making.
  • However, the industry faces challenges related to interoperable health systems and ensuring robust data privacy and security for the vast amounts of sensitive information collected.
  • The integration of AI-powered diagnostics is further enhancing the capabilities of these devices, enabling predictive insights for conditions requiring cardiac arrhythmia detection and metabolic health tracking, thereby solidifying their role in the future of personalized medicine and preventive healthcare technology.

What will be the Size of the Sensor Patch Market during the forecast period?

Get Key Insights on Market Forecast (PDF) Request Free Sample

How is the Sensor Patch Market Segmented?

The sensor patch industry research report provides comprehensive data (region-wise segment analysis), with forecasts and estimates in "USD million" for the period 2026-2030, as well as historical data from 2020-2024 for the following segments.

  • Application
    • Diagnostics
    • Monitoring
    • Medical therapeutics
  • End-user
    • Healthcare
    • Sports and fitness
  • Product
    • Wristwear
    • Bodywear
    • Neckwear
    • Footwear
  • Geography
    • North America
      • US
      • Canada
      • Mexico
    • APAC
      • China
      • India
      • Japan
    • Europe
      • Germany
      • UK
      • France
    • South America
      • Brazil
      • Argentina
    • Middle East and Africa
      • Saudi Arabia
      • UAE
      • South Africa
    • Rest of World (ROW)

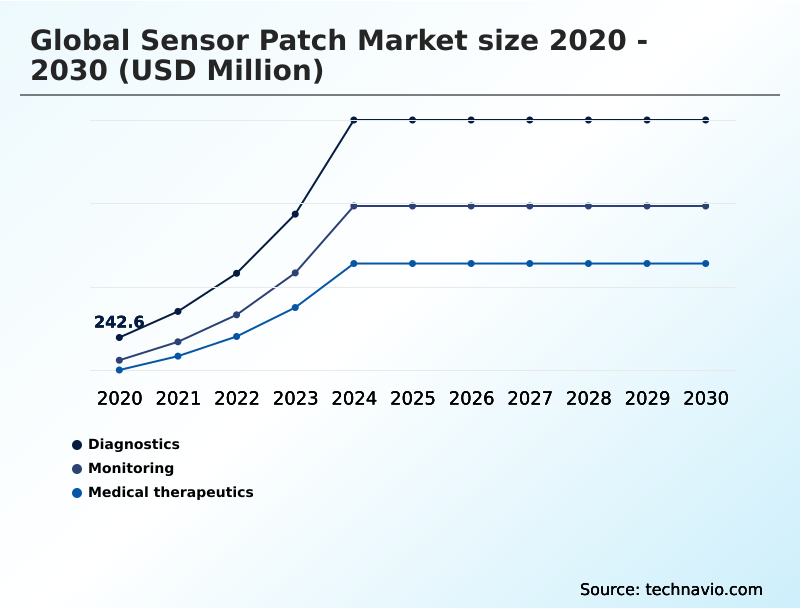
By Application Insights

The diagnostics segment is estimated to witness significant growth during the forecast period.

The diagnostic segment is shifting toward non-invasive diagnostics for real-time biomarker detection. These systems rely on electrochemical sensing and MEMS-based sensors to analyze physiological data without invasive procedures.

Key applications include point-of-care diagnostics and the early detection of cardiovascular or metabolic issues. The integration of AI-powered diagnostics enables complex data analysis, providing actionable insights that improve detection accuracy by over 15%.

This focus on preventive healthcare technology is driving adoption, as these patches offer continuous visibility into patient health.

Innovations in sensor miniaturization and user-centric design in medtech are making these devices more comfortable for extended wear, which is crucial for capturing intermittent symptoms and ensuring patient adherence solutions are effective.

Request Free Sample

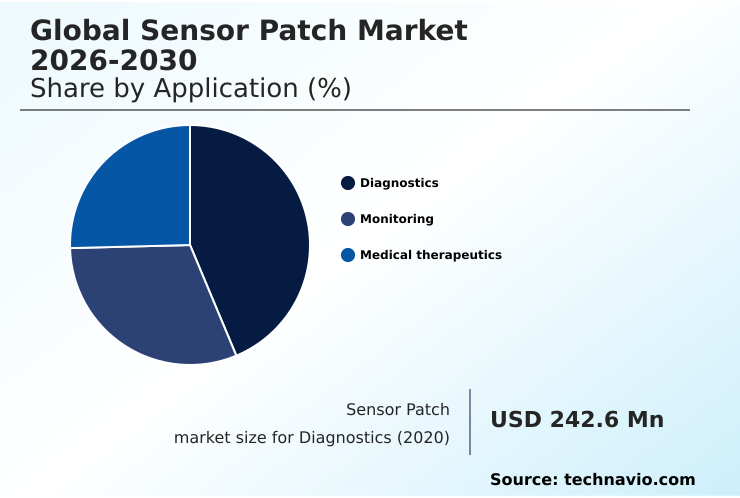
The Diagnostics segment was valued at USD 922.2 million in 2024 and showed a gradual increase during the forecast period.

Request Free Sample

Regional Analysis

North America is estimated to contribute 37.2% to the growth of the global market during the forecast period.Technavio’s analysts have elaborately explained the regional trends and drivers that shape the market during the forecast period.

See How Sensor Patch Market Demand is Rising in North America Request Free Sample

North America leads the market, accounting for over 37% of incremental growth, driven by advanced infrastructure and favorable reimbursement for ambulatory cardiac monitoring and other forms of remote patient monitoring.

The region’s focus on value-based care technology incentivizes using ECG monitoring patch solutions. In contrast, the APAC region is the fastest-growing, contributing nearly 29% to expansion, fueled by rising health awareness and adoption of direct-to-consumer health devices.

Europe's market, characterized by a stringent regulatory approval process for wearables, shows steady growth in hospital-at-home models.

Across all regions, the deployment of NFC-enabled patches and clinical-grade wearables is simplifying data transfer and improving wound healing monitoring, reflecting a global shift toward more accessible healthcare.

Market Dynamics

Our researchers analyzed the data with 2025 as the base year, along with the key drivers, trends, and challenges. A holistic analysis of drivers will help companies refine their marketing strategies to gain a competitive advantage.

  • The expanding applications for sensor patches are creating new opportunities for specialized health management. The use of a sensor patch for diabetes management is becoming the standard of care, offering superior glycemic control compared to intermittent testing.
  • A key talking point is the continuous glucose monitoring vs fingerstick debate, where patches provide a comprehensive view of glucose trends, significantly improving patient outcomes with wearables. The wearable ecg monitoring patch benefits are transforming cardiology, enabling long-term, comfortable monitoring for arrhythmia detection.
  • This smart patch for remote patient care is crucial for managing chronic diseases, with advancements in biosensor technology making devices smaller and more accurate. Hospitals implementing remote monitoring for chronic diseases using smart patches have reported a reduction in readmission rates that is nearly twice as effective as traditional telephonic follow-up protocols.
  • The future of remote patient monitoring lies in integrating these devices with electronic health records. However, ensuring data security in wearable health remains a priority, alongside improving the user experience in wearable patches. This technology is also finding a place in athletics, with smart patch technology in sports used for performance tracking.
  • As the market matures, the cost-effectiveness of sensor patches and their role in wearable sensors for cardiac care will drive broader adoption.

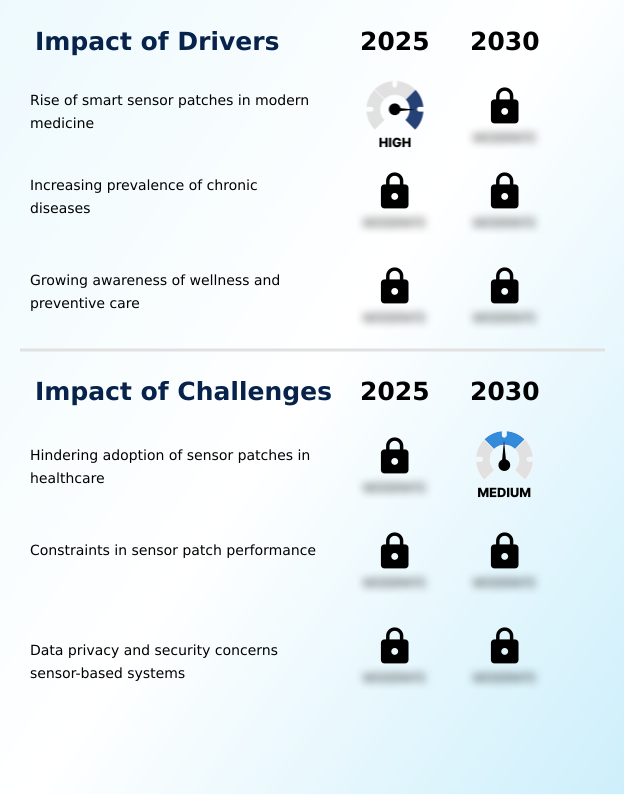
What are the key market drivers leading to the rise in the adoption of Sensor Patch Industry?

  • The increasing adoption of smart sensor patches in modern medicine is a key market driver, facilitated by the demand for continuous and remote patient monitoring solutions.

  • Market expansion is significantly driven by the need for effective remote patient monitoring to manage chronic diseases.
  • The adoption of continuous glucose monitoring systems has demonstrated a 30% improvement in glycemic control for certain patient groups, highlighting the clinical value of these devices.
  • This shift toward hospital-at-home models is accelerating, as wearable biosensors enable clinical-grade vital signs monitoring outside of traditional care settings, reducing readmission rates by up to 20%.
  • The growth of digital health platforms and interoperable health systems allows for seamless data flow, supporting predictive analytics in healthcare.
  • This technological framework, including biometric data analysis, is essential for value-based care technology, where improved patient outcomes are directly tied to reimbursement.

What are the market trends shaping the Sensor Patch Industry?

  • The integration of advanced sensors with transdermal platforms is an emerging trend, combining continuous health monitoring with automated drug delivery for personalized therapeutic applications.

  • A primary trend is the fusion of smart patch technology with transdermal drug delivery, creating closed-loop therapeutic systems. The development of the microneedle sensor patch is a key advancement, enabling minimally invasive access to interstitial fluid for more accurate readings.
  • Extended-wear sensors are becoming standard, with some devices now functional for over 14 days, reducing patient burden by 50% compared to earlier models. This progress is coupled with enhanced telehealth integration, allowing real-time physiological data to flow directly into clinical workflows.
  • Furthermore, the push for over-the-counter biosensors is democratizing access to clinical-grade wearables, expanding the market beyond prescription-based use cases and empowering consumers to manage their health proactively. This trend has led to a 40% increase in user engagement for some wellness platforms.

What challenges does the Sensor Patch Industry face during its growth?

  • Key challenges hindering market growth include factors that impede the widespread adoption of sensor patches in healthcare, such as high costs and data security vulnerabilities.

  • Market expansion is constrained by significant challenges, notably concerning data privacy and security, which deters nearly 30% of potential users. The reliability of wireless health monitoring systems is paramount, yet the risk of data breaches remains a major hurdle.
  • Another critical issue is the need for universal sensor calibration standards to ensure data from different devices is comparable and clinically valid. The physical properties of the patches, including the long-term performance of biocompatible adhesives, also present difficulties, affecting user comfort and patient adherence solutions.
  • Furthermore, the complex regulatory approval process for wearables, coupled with a volatile supply chain for medical components like low-power ICs, creates barriers for new entrants and can delay innovation, with development timelines extending by up to 18 months.

Exclusive Technavio Analysis on Customer Landscape

The sensor patch market forecasting report includes the adoption lifecycle of the market, covering from the innovator’s stage to the laggard’s stage. It focuses on adoption rates in different regions based on penetration. Furthermore, the sensor patch market report also includes key purchase criteria and drivers of price sensitivity to help companies evaluate and develop their market growth analysis strategies.

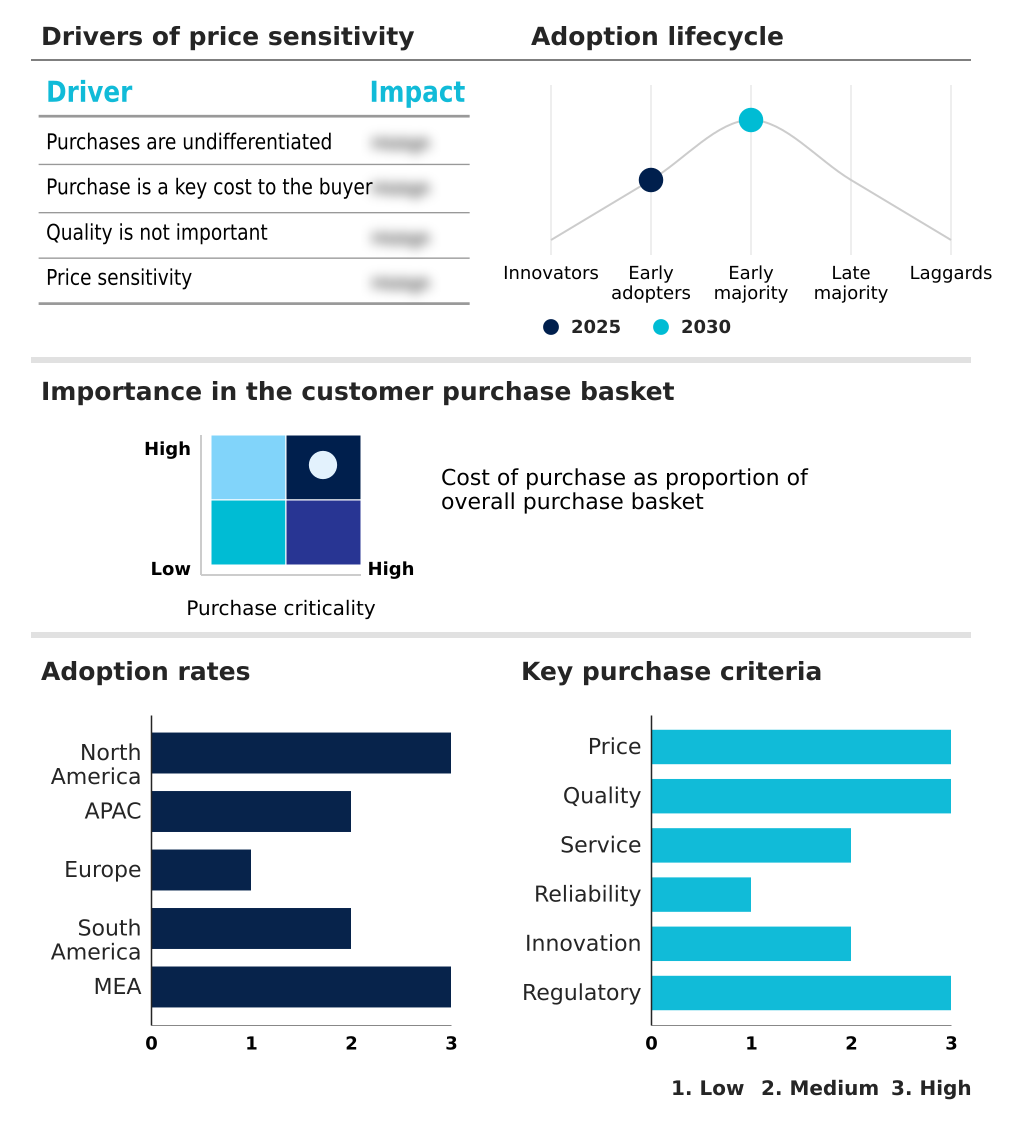
Customer Landscape of Sensor Patch Industry

Competitive Landscape

Companies are implementing various strategies, such as strategic alliances, sensor patch market forecast, partnerships, mergers and acquisitions, geographical expansion, and product/service launches, to enhance their presence in the industry.

Abbott Laboratories - Delivers continuous glucose monitoring patches featuring real-time data transmission, enhancing remote patient management and personalized health insights.

The industry research and growth report includes detailed analyses of the competitive landscape of the market and information about key companies, including:

  • Abbott Laboratories
  • Analog Devices Inc.
  • Avery Dennison Corp.
  • Dexcom Inc.
  • GENTAG Inc.
  • HIVOX BIOTEK Inc.
  • iRhythm Technologies Inc.
  • Isansys Ltd.
  • Masimo Corp.
  • Medtronic Plc
  • NanoSonic Inc.
  • NXP Semiconductors NV
  • OMRON Corp.
  • Smith and Nephew plc
  • STMicroelectronics NV
  • Texas Instruments Inc.
  • VitalConnect Inc.
  • Vpatch Cardio Pty Ltd.

Qualitative and quantitative analysis of companies has been conducted to help clients understand the wider business environment as well as the strengths and weaknesses of key industry players. Data is qualitatively analyzed to categorize companies as pure play, category-focused, industry-focused, and diversified; it is quantitatively analyzed to categorize companies as dominant, leading, strong, tentative, and weak.

Recent Development and News in Sensor patch market

  • In May 2025, iRhythm Technologies Inc. announced the commercial launch of its Zio long-term continuous monitoring system in Japan, marking a significant geographic expansion for its AI-powered arrhythmia detection technology.
  • In April 2025, Medtronic Plc received United States Food and Drug Administration approval for its Simplera Sync sensor, a disposable, all-in-one continuous glucose monitoring device designed for integration with its MiniMed 780G automated insulin delivery system.
  • In March 2025, Abbott Laboratories revealed the expansion of its bio-wearable line with a new sensor patch capable of concurrently monitoring lactate and ketone levels, targeting the athletic performance and metabolic health markets.
  • In March 2025, Dexcom Inc. presented inaugural accuracy and performance data for its G7 15-Day sensor system at the International Conference on Advanced Technologies and Treatments for Diabetes, signaling a strategic move toward longer-wear devices.

Dive into Technavio’s robust research methodology, blending expert interviews, extensive data synthesis, and validated models for unparalleled Sensor Patch Market insights. See full methodology.

Market Scope
Page number 285
Base year 2025
Historic period 2020-2024
Forecast period 2026-2030
Growth momentum & CAGR Accelerate at a CAGR of 30%
Market growth 2026-2030 USD 8426.0 million
Market structure Fragmented
YoY growth 2025-2026(%) 23.1%
Key countries US, Canada, Mexico, China, India, Japan, South Korea, Australia, Indonesia, Germany, UK, France, Italy, Spain, The Netherlands, Brazil, Argentina, Chile, Saudi Arabia, UAE, South Africa, Israel and Turkey
Competitive landscape Leading Companies, Market Positioning of Companies, Competitive Strategies, and Industry Risks

Request Free Sample

Research Analyst Overview

  • The sensor patch market is defined by rapid technological iteration, where sensor miniaturization and the development of biocompatible adhesives are enabling longer, more comfortable wear times. The core technology, including wearable biosensors and low-power ICs, facilitates continuous vital signs monitoring for applications ranging from ambulatory cardiac monitoring to non-invasive diagnostics.
  • The integration of predictive analytics in healthcare is a important trend, with AI-powered diagnostics improving arrhythmia detection accuracy by over 25% compared to conventional methods. A key strategic consideration for market participants is the convergence with therapeutics, such as combining an electrochemical sensing patch with transdermal drug delivery.
  • This requires forming partnerships with pharmaceutical firms, a boardroom-level decision that could unlock significant value. As the market evolves, the focus is on creating interoperable health systems that can seamlessly utilize data from various sources, including ECG monitoring patches and NFC-enabled patches, to provide a holistic view of patient health and support point-of-care diagnostics.

What are the Key Data Covered in this Sensor Patch Market Research and Growth Report?

  • What is the expected growth of the Sensor Patch Market between 2026 and 2030?

    • USD 8.43 billion, at a CAGR of 30%

  • What segmentation does the market report cover?

    • The report is segmented by Application (Diagnostics, Monitoring, and Medical therapeutics), End-user (Healthcare, and Sports and fitness), Product (Wristwear, Bodywear, Neckwear, and Footwear) and Geography (North America, APAC, Europe, South America, Middle East and Africa)

  • Which regions are analyzed in the report?

    • North America, APAC, Europe, South America and Middle East and Africa

  • What are the key growth drivers and market challenges?

    • Rise of smart sensor patches in modern medicine, Hindering adoption of sensor patches in healthcare

  • Who are the major players in the Sensor Patch Market?

    • Abbott Laboratories, Analog Devices Inc., Avery Dennison Corp., Dexcom Inc., GENTAG Inc., HIVOX BIOTEK Inc., iRhythm Technologies Inc., Isansys Ltd., Masimo Corp., Medtronic Plc, NanoSonic Inc., NXP Semiconductors NV, OMRON Corp., Smith and Nephew plc, STMicroelectronics NV, Texas Instruments Inc., VitalConnect Inc. and Vpatch Cardio Pty Ltd.

Market Research Insights

  • The sensor patch market is characterized by dynamic growth and rapid innovation, with year-over-year growth accelerating at a rate of 23.1%. This momentum is driven by the rising adoption of digital health platforms and the demand for real-time physiological data.
  • North America continues to be a pivotal region, contributing over 37% of the market's incremental growth, largely due to its advanced healthcare ecosystem and favorable reimbursement policies. The integration of AI-powered diagnostics into these devices is enabling more sophisticated applications, such as predictive alerts for metabolic health tracking and precise cardiac arrhythmia detection.
  • As the technology matures, the focus is shifting toward creating fully interoperable health systems that provide a holistic view of patient health, reinforcing the move toward proactive and personalized care.

We can help! Our analysts can customize this sensor patch market research report to meet your requirements.

Get in touch

1. Executive Summary

1.1 Market overview

Executive Summary - Chart on Market Overview
Executive Summary - Data Table on Market Overview
Executive Summary - Chart on Global Market Characteristics
Executive Summary - Chart on Market by Geography
Executive Summary - Chart on Market Segmentation by Application
Executive Summary - Chart on Market Segmentation by End-user
Executive Summary - Chart on Market Segmentation by Product
Executive Summary - Chart on Incremental Growth
Executive Summary - Data Table on Incremental Growth
Executive Summary - Chart on Company Market Positioning

2. Technavio Analysis

2.1 Analysis of price sensitivity, lifecycle, customer purchase basket, adoption rates, and purchase criteria

2.2 Criticality of inputs and Factors of differentiation

Chart on Overview on criticality of inputs and factors of differentiation

2.3 Factors of disruption

Chart on Overview on factors of disruption

2.4 Impact of drivers and challenges

Chart on Impact of drivers and challenges in 2025 and 2030

3. Market Landscape

3.1 Market ecosystem

Chart on Parent Market
Data Table on - Parent Market

3.2 Market characteristics

Chart on Market characteristics analysis

3.3 Value chain analysis

Chart on Value chain analysis

4. Market Sizing

4.1 Market definition

Data Table on Offerings of companies included in the market definition

4.2 Market segment analysis

Market segments

4.3 Market size 2025

4.4 Market outlook: Forecast for 2025-2030

Chart on Global - Market size and forecast 2025-2030 ($ million)
Data Table on Global - Market size and forecast 2025-2030 ($ million)
Chart on Global Market: Year-over-year growth 2025-2030 (%)
Data Table on Global Market: Year-over-year growth 2025-2030 (%)

5. Historic Market Size

5.1 Global Sensor Patch Market 2020 - 2024

Historic Market Size - Data Table on Global Sensor Patch Market 2020 - 2024 ($ million)

5.2 Application segment analysis 2020 - 2024

Historic Market Size - Application Segment 2020 - 2024 ($ million)

5.3 End-user segment analysis 2020 - 2024

Historic Market Size - End-user Segment 2020 - 2024 ($ million)

5.4 Product segment analysis 2020 - 2024

Historic Market Size - Product Segment 2020 - 2024 ($ million)

5.5 Geography segment analysis 2020 - 2024

Historic Market Size - Geography Segment 2020 - 2024 ($ million)

5.6 Country segment analysis 2020 - 2024

Historic Market Size - Country Segment 2020 - 2024 ($ million)

6. Qualitative Analysis

6.1 Impact of AI in global sensor patch market

7. Five Forces Analysis

7.1 Five forces summary

Five forces analysis - Comparison between 2025 and 2030

7.2 Bargaining power of buyers

Bargaining power of buyers - Impact of key factors 2025 and 2030

7.3 Bargaining power of suppliers

Bargaining power of suppliers - Impact of key factors in 2025 and 2030

7.4 Threat of new entrants

Threat of new entrants - Impact of key factors in 2025 and 2030

7.5 Threat of substitutes

Threat of substitutes - Impact of key factors in 2025 and 2030

7.6 Threat of rivalry

Threat of rivalry - Impact of key factors in 2025 and 2030

7.7 Market condition

Chart on Market condition - Five forces 2025 and 2030

8. Market Segmentation by Application

8.1 Market segments

Chart on Application - Market share 2025-2030 (%)
Data Table on Application - Market share 2025-2030 (%)

8.2 Comparison by Application

Chart on Comparison by Application
Data Table on Comparison by Application

8.3 Diagnostics - Market size and forecast 2025-2030

Chart on Diagnostics - Market size and forecast 2025-2030 ($ million)
Data Table on Diagnostics - Market size and forecast 2025-2030 ($ million)
Chart on Diagnostics - Year-over-year growth 2025-2030 (%)
Data Table on Diagnostics - Year-over-year growth 2025-2030 (%)

8.4 Monitoring - Market size and forecast 2025-2030

Chart on Monitoring - Market size and forecast 2025-2030 ($ million)
Data Table on Monitoring - Market size and forecast 2025-2030 ($ million)
Chart on Monitoring - Year-over-year growth 2025-2030 (%)
Data Table on Monitoring - Year-over-year growth 2025-2030 (%)

8.5 Medical therapeutics - Market size and forecast 2025-2030

Chart on Medical therapeutics - Market size and forecast 2025-2030 ($ million)
Data Table on Medical therapeutics - Market size and forecast 2025-2030 ($ million)
Chart on Medical therapeutics - Year-over-year growth 2025-2030 (%)
Data Table on Medical therapeutics - Year-over-year growth 2025-2030 (%)

8.6 Market opportunity by Application

Market opportunity by Application ($ million)
Data Table on Market opportunity by Application ($ million)

9. Market Segmentation by End-user

9.1 Market segments

Chart on End-user - Market share 2025-2030 (%)
Data Table on End-user - Market share 2025-2030 (%)

9.2 Comparison by End-user

Chart on Comparison by End-user
Data Table on Comparison by End-user

9.3 Healthcare - Market size and forecast 2025-2030

Chart on Healthcare - Market size and forecast 2025-2030 ($ million)
Data Table on Healthcare - Market size and forecast 2025-2030 ($ million)
Chart on Healthcare - Year-over-year growth 2025-2030 (%)
Data Table on Healthcare - Year-over-year growth 2025-2030 (%)

9.4 Sports and fitness - Market size and forecast 2025-2030

Chart on Sports and fitness - Market size and forecast 2025-2030 ($ million)
Data Table on Sports and fitness - Market size and forecast 2025-2030 ($ million)
Chart on Sports and fitness - Year-over-year growth 2025-2030 (%)
Data Table on Sports and fitness - Year-over-year growth 2025-2030 (%)

9.5 Market opportunity by End-user

Market opportunity by End-user ($ million)
Data Table on Market opportunity by End-user ($ million)

10. Market Segmentation by Product

10.1 Market segments

Chart on Product - Market share 2025-2030 (%)
Data Table on Product - Market share 2025-2030 (%)

10.2 Comparison by Product

Chart on Comparison by Product
Data Table on Comparison by Product

10.3 Wristwear - Market size and forecast 2025-2030

Chart on Wristwear - Market size and forecast 2025-2030 ($ million)
Data Table on Wristwear - Market size and forecast 2025-2030 ($ million)
Chart on Wristwear - Year-over-year growth 2025-2030 (%)
Data Table on Wristwear - Year-over-year growth 2025-2030 (%)

10.4 Bodywear - Market size and forecast 2025-2030

Chart on Bodywear - Market size and forecast 2025-2030 ($ million)
Data Table on Bodywear - Market size and forecast 2025-2030 ($ million)
Chart on Bodywear - Year-over-year growth 2025-2030 (%)
Data Table on Bodywear - Year-over-year growth 2025-2030 (%)

10.5 Neckwear - Market size and forecast 2025-2030

Chart on Neckwear - Market size and forecast 2025-2030 ($ million)
Data Table on Neckwear - Market size and forecast 2025-2030 ($ million)
Chart on Neckwear - Year-over-year growth 2025-2030 (%)
Data Table on Neckwear - Year-over-year growth 2025-2030 (%)

10.6 Footwear - Market size and forecast 2025-2030

Chart on Footwear - Market size and forecast 2025-2030 ($ million)
Data Table on Footwear - Market size and forecast 2025-2030 ($ million)
Chart on Footwear - Year-over-year growth 2025-2030 (%)
Data Table on Footwear - Year-over-year growth 2025-2030 (%)

10.7 Market opportunity by Product

Market opportunity by Product ($ million)
Data Table on Market opportunity by Product ($ million)

11. Customer Landscape

11.1 Customer landscape overview

Analysis of price sensitivity, lifecycle, customer purchase basket, adoption rates, and purchase criteria

12. Geographic Landscape

12.1 Geographic segmentation

Chart on Market share by geography 2025-2030 (%)
Data Table on Market share by geography 2025-2030 (%)

12.2 Geographic comparison

Chart on Geographic comparison
Data Table on Geographic comparison

12.3 North America - Market size and forecast 2025-2030

Chart on North America - Market size and forecast 2025-2030 ($ million)
Data Table on North America - Market size and forecast 2025-2030 ($ million)
Chart on North America - Year-over-year growth 2025-2030 (%)
Data Table on North America - Year-over-year growth 2025-2030 (%)
Chart on Regional Comparison - North America
Data Table on Regional Comparison - North America

12.3.1 US - Market size and forecast 2025-2030

Chart on US - Market size and forecast 2025-2030 ($ million)
Data Table on US - Market size and forecast 2025-2030 ($ million)
Chart on US - Year-over-year growth 2025-2030 (%)
Data Table on US - Year-over-year growth 2025-2030 (%)

12.3.2 Canada - Market size and forecast 2025-2030

Chart on Canada - Market size and forecast 2025-2030 ($ million)
Data Table on Canada - Market size and forecast 2025-2030 ($ million)
Chart on Canada - Year-over-year growth 2025-2030 (%)
Data Table on Canada - Year-over-year growth 2025-2030 (%)

12.3.3 Mexico - Market size and forecast 2025-2030

Chart on Mexico - Market size and forecast 2025-2030 ($ million)
Data Table on Mexico - Market size and forecast 2025-2030 ($ million)
Chart on Mexico - Year-over-year growth 2025-2030 (%)
Data Table on Mexico - Year-over-year growth 2025-2030 (%)

12.4 APAC - Market size and forecast 2025-2030

Chart on APAC - Market size and forecast 2025-2030 ($ million)
Data Table on APAC - Market size and forecast 2025-2030 ($ million)
Chart on APAC - Year-over-year growth 2025-2030 (%)
Data Table on APAC - Year-over-year growth 2025-2030 (%)
Chart on Regional Comparison - APAC
Data Table on Regional Comparison - APAC

12.4.1 China - Market size and forecast 2025-2030

Chart on China - Market size and forecast 2025-2030 ($ million)
Data Table on China - Market size and forecast 2025-2030 ($ million)
Chart on China - Year-over-year growth 2025-2030 (%)
Data Table on China - Year-over-year growth 2025-2030 (%)

12.4.2 India - Market size and forecast 2025-2030

Chart on India - Market size and forecast 2025-2030 ($ million)
Data Table on India - Market size and forecast 2025-2030 ($ million)
Chart on India - Year-over-year growth 2025-2030 (%)
Data Table on India - Year-over-year growth 2025-2030 (%)

12.4.3 Japan - Market size and forecast 2025-2030

Chart on Japan - Market size and forecast 2025-2030 ($ million)
Data Table on Japan - Market size and forecast 2025-2030 ($ million)
Chart on Japan - Year-over-year growth 2025-2030 (%)
Data Table on Japan - Year-over-year growth 2025-2030 (%)

12.4.4 South Korea - Market size and forecast 2025-2030

Chart on South Korea - Market size and forecast 2025-2030 ($ million)
Data Table on South Korea - Market size and forecast 2025-2030 ($ million)
Chart on South Korea - Year-over-year growth 2025-2030 (%)
Data Table on South Korea - Year-over-year growth 2025-2030 (%)

12.4.5 Australia - Market size and forecast 2025-2030

Chart on Australia - Market size and forecast 2025-2030 ($ million)
Data Table on Australia - Market size and forecast 2025-2030 ($ million)
Chart on Australia - Year-over-year growth 2025-2030 (%)
Data Table on Australia - Year-over-year growth 2025-2030 (%)

12.4.6 Indonesia - Market size and forecast 2025-2030

Chart on Indonesia - Market size and forecast 2025-2030 ($ million)
Data Table on Indonesia - Market size and forecast 2025-2030 ($ million)
Chart on Indonesia - Year-over-year growth 2025-2030 (%)
Data Table on Indonesia - Year-over-year growth 2025-2030 (%)

12.5 Europe - Market size and forecast 2025-2030

Chart on Europe - Market size and forecast 2025-2030 ($ million)
Data Table on Europe - Market size and forecast 2025-2030 ($ million)
Chart on Europe - Year-over-year growth 2025-2030 (%)
Data Table on Europe - Year-over-year growth 2025-2030 (%)
Chart on Regional Comparison - Europe
Data Table on Regional Comparison - Europe

12.5.1 Germany - Market size and forecast 2025-2030

Chart on Germany - Market size and forecast 2025-2030 ($ million)
Data Table on Germany - Market size and forecast 2025-2030 ($ million)
Chart on Germany - Year-over-year growth 2025-2030 (%)
Data Table on Germany - Year-over-year growth 2025-2030 (%)

12.5.2 UK - Market size and forecast 2025-2030

Chart on UK - Market size and forecast 2025-2030 ($ million)
Data Table on UK - Market size and forecast 2025-2030 ($ million)
Chart on UK - Year-over-year growth 2025-2030 (%)
Data Table on UK - Year-over-year growth 2025-2030 (%)

12.5.3 France - Market size and forecast 2025-2030

Chart on France - Market size and forecast 2025-2030 ($ million)
Data Table on France - Market size and forecast 2025-2030 ($ million)
Chart on France - Year-over-year growth 2025-2030 (%)
Data Table on France - Year-over-year growth 2025-2030 (%)

12.5.4 Italy - Market size and forecast 2025-2030

Chart on Italy - Market size and forecast 2025-2030 ($ million)
Data Table on Italy - Market size and forecast 2025-2030 ($ million)
Chart on Italy - Year-over-year growth 2025-2030 (%)
Data Table on Italy - Year-over-year growth 2025-2030 (%)

12.5.5 Spain - Market size and forecast 2025-2030

Chart on Spain - Market size and forecast 2025-2030 ($ million)
Data Table on Spain - Market size and forecast 2025-2030 ($ million)
Chart on Spain - Year-over-year growth 2025-2030 (%)
Data Table on Spain - Year-over-year growth 2025-2030 (%)

12.5.6 The Netherlands - Market size and forecast 2025-2030

Chart on The Netherlands - Market size and forecast 2025-2030 ($ million)
Data Table on The Netherlands - Market size and forecast 2025-2030 ($ million)
Chart on The Netherlands - Year-over-year growth 2025-2030 (%)
Data Table on The Netherlands - Year-over-year growth 2025-2030 (%)

12.6 South America - Market size and forecast 2025-2030

Chart on South America - Market size and forecast 2025-2030 ($ million)
Data Table on South America - Market size and forecast 2025-2030 ($ million)
Chart on South America - Year-over-year growth 2025-2030 (%)
Data Table on South America - Year-over-year growth 2025-2030 (%)
Chart on Regional Comparison - South America
Data Table on Regional Comparison - South America

12.6.1 Brazil - Market size and forecast 2025-2030

Chart on Brazil - Market size and forecast 2025-2030 ($ million)
Data Table on Brazil - Market size and forecast 2025-2030 ($ million)
Chart on Brazil - Year-over-year growth 2025-2030 (%)
Data Table on Brazil - Year-over-year growth 2025-2030 (%)

12.6.2 Argentina - Market size and forecast 2025-2030

Chart on Argentina - Market size and forecast 2025-2030 ($ million)
Data Table on Argentina - Market size and forecast 2025-2030 ($ million)
Chart on Argentina - Year-over-year growth 2025-2030 (%)
Data Table on Argentina - Year-over-year growth 2025-2030 (%)

12.6.3 Chile - Market size and forecast 2025-2030

Chart on Chile - Market size and forecast 2025-2030 ($ million)
Data Table on Chile - Market size and forecast 2025-2030 ($ million)
Chart on Chile - Year-over-year growth 2025-2030 (%)
Data Table on Chile - Year-over-year growth 2025-2030 (%)

12.7 Middle East and Africa - Market size and forecast 2025-2030

Chart on Middle East and Africa - Market size and forecast 2025-2030 ($ million)
Data Table on Middle East and Africa - Market size and forecast 2025-2030 ($ million)
Chart on Middle East and Africa - Year-over-year growth 2025-2030 (%)
Data Table on Middle East and Africa - Year-over-year growth 2025-2030 (%)
Chart on Regional Comparison - Middle East and Africa
Data Table on Regional Comparison - Middle East and Africa

12.7.1 Saudi Arabia - Market size and forecast 2025-2030

Chart on Saudi Arabia - Market size and forecast 2025-2030 ($ million)
Data Table on Saudi Arabia - Market size and forecast 2025-2030 ($ million)
Chart on Saudi Arabia - Year-over-year growth 2025-2030 (%)
Data Table on Saudi Arabia - Year-over-year growth 2025-2030 (%)

12.7.2 UAE - Market size and forecast 2025-2030

Chart on UAE - Market size and forecast 2025-2030 ($ million)
Data Table on UAE - Market size and forecast 2025-2030 ($ million)
Chart on UAE - Year-over-year growth 2025-2030 (%)
Data Table on UAE - Year-over-year growth 2025-2030 (%)

12.7.3 South Africa - Market size and forecast 2025-2030

Chart on South Africa - Market size and forecast 2025-2030 ($ million)
Data Table on South Africa - Market size and forecast 2025-2030 ($ million)
Chart on South Africa - Year-over-year growth 2025-2030 (%)
Data Table on South Africa - Year-over-year growth 2025-2030 (%)

12.7.4 Israel - Market size and forecast 2025-2030

Chart on Israel - Market size and forecast 2025-2030 ($ million)
Data Table on Israel - Market size and forecast 2025-2030 ($ million)
Chart on Israel - Year-over-year growth 2025-2030 (%)
Data Table on Israel - Year-over-year growth 2025-2030 (%)

12.7.5 Turkey - Market size and forecast 2025-2030

Chart on Turkey - Market size and forecast 2025-2030 ($ million)
Data Table on Turkey - Market size and forecast 2025-2030 ($ million)
Chart on Turkey - Year-over-year growth 2025-2030 (%)
Data Table on Turkey - Year-over-year growth 2025-2030 (%)

12.8 Market opportunity by geography

Market opportunity by geography ($ million)
Data Tables on Market opportunity by geography ($ million)

13. Drivers, Challenges, and Opportunity

13.1 Market drivers

Rise of smart sensor patches in modern medicine
Increasing prevalence of chronic diseases
Growing awareness of wellness and preventive care

13.2 Market challenges

Hindering adoption of sensor patches in healthcare
Constraints in sensor patch performance
Data privacy and security concerns sensor-based systems

13.3 Impact of drivers and challenges

Impact of drivers and challenges in 2025 and 2030

13.4 Market opportunities

Integration of sensors with transdermal platforms
Advancements in technology enhancing sensor patch
Increasing adoption of connected devices in sensor patch

14. Competitive Landscape

14.1 Overview

14.2

Overview on criticality of inputs and factors of differentiation

14.3 Landscape disruption

Overview on factors of disruption

14.4 Industry risks

Impact of key risks on business

15. Competitive Analysis

15.1 Companies profiled

Companies covered

15.2 Company ranking index

15.3 Market positioning of companies

Matrix on companies position and classification

15.4 Abbott Laboratories

Abbott Laboratories - Overview
Abbott Laboratories - Business segments
Abbott Laboratories - Key news
Abbott Laboratories - Key offerings
Abbott Laboratories - Segment focus
SWOT

15.5 Analog Devices Inc.

Analog Devices Inc. - Overview
Analog Devices Inc. - Business segments
Analog Devices Inc. - Key news
Analog Devices Inc. - Key offerings
Analog Devices Inc. - Segment focus
SWOT

15.6 Avery Dennison Corp.

Avery Dennison Corp. - Overview
Avery Dennison Corp. - Business segments
Avery Dennison Corp. - Key news
Avery Dennison Corp. - Key offerings
Avery Dennison Corp. - Segment focus
SWOT

15.7 Dexcom Inc.

Dexcom Inc. - Overview
Dexcom Inc. - Product / Service
Dexcom Inc. - Key offerings
SWOT

15.8 GENTAG Inc.

GENTAG Inc. - Overview
GENTAG Inc. - Product / Service
GENTAG Inc. - Key offerings
SWOT

15.9 HIVOX BIOTEK Inc.

HIVOX BIOTEK Inc. - Overview
HIVOX BIOTEK Inc. - Product / Service
HIVOX BIOTEK Inc. - Key offerings
SWOT

15.10 iRhythm Technologies Inc.

iRhythm Technologies Inc. - Overview
iRhythm Technologies Inc. - Product / Service
iRhythm Technologies Inc. - Key offerings
SWOT

15.11 Isansys Ltd.

Isansys Ltd. - Overview
Isansys Ltd. - Product / Service
Isansys Ltd. - Key offerings
SWOT

15.12 Medtronic Plc

Medtronic Plc - Overview
Medtronic Plc - Business segments
Medtronic Plc - Key news
Medtronic Plc - Key offerings
Medtronic Plc - Segment focus
SWOT

15.13 NXP Semiconductors NV

NXP Semiconductors NV - Overview
NXP Semiconductors NV - Product / Service
NXP Semiconductors NV - Key offerings
SWOT

15.14 OMRON Corp.

OMRON Corp. - Overview
OMRON Corp. - Business segments
OMRON Corp. - Key news
OMRON Corp. - Key offerings
OMRON Corp. - Segment focus
SWOT

15.15 Smith and Nephew plc

Smith and Nephew plc - Overview
Smith and Nephew plc - Business segments
Smith and Nephew plc - Key news
Smith and Nephew plc - Key offerings
Smith and Nephew plc - Segment focus
SWOT

15.16 STMicroelectronics NV

STMicroelectronics NV - Overview
STMicroelectronics NV - Business segments
STMicroelectronics NV - Key news
STMicroelectronics NV - Key offerings
STMicroelectronics NV - Segment focus
SWOT

15.17 Texas Instruments Inc.

Texas Instruments Inc. - Overview
Texas Instruments Inc. - Business segments
Texas Instruments Inc. - Key offerings
Texas Instruments Inc. - Segment focus
SWOT

15.18 VitalConnect Inc.

VitalConnect Inc. - Overview
VitalConnect Inc. - Product / Service
VitalConnect Inc. - Key offerings
SWOT

16. Appendix

16.1 Scope of the report

Market definition
Objectives
Notes and caveats

16.2 Inclusions and exclusions checklist

Inclusions checklist
Exclusions checklist

16.3 Currency conversion rates for US$

16.4 Research methodology

16.5 Data procurement

Information sources

16.6 Data validation

16.7 Validation techniques employed for market sizing

16.8 Data synthesis

16.9 360 degree market analysis

16.10 List of abbreviations

Research Methodology

Technavio presents a detailed picture of the market by way of study, synthesis, and summation of data from multiple sources. The analysts have presented the various facets of the market with a particular focus on identifying the key industry influencers. The data thus presented is comprehensive, reliable, and the result of extensive research, both primary and secondary.

INFORMATION SOURCES

Primary sources

  • Manufacturers and suppliers
  • Channel partners
  • Industry experts
  • Strategic decision makers

Secondary sources

  • Industry journals and periodicals
  • Government data
  • Financial reports of key industry players
  • Historical data
  • Press releases

DATA ANALYSIS

Data Synthesis

  • Collation of data
  • Estimation of key figures
  • Analysis of derived insights

Data Validation

  • Triangulation with data models
  • Reference against proprietary databases
  • Corroboration with industry experts

REPORT WRITING

Qualitative

  • Market drivers
  • Market challenges
  • Market trends
  • Five forces analysis

Quantitative

  • Market size and forecast
  • Market segmentation
  • Geographical insights
  • Competitive landscape

Interested in this report?

Get your sample now to see our research methodology and insights!

Download Now

Frequently Asked Questions

Sensor Patch market growth will increase by USD 8426.0 million during 2026-2030.

The Sensor Patch market is expected to grow at a CAGR of 30% during 2026-2030.

Sensor Patch market is segmented by Application (Diagnostics, Monitoring, Medical therapeutics) End-user (Healthcare, Sports and fitness) Product (Wristwear, Bodywear, Neckwear, Footwear)

Abbott Laboratories, Analog Devices Inc., Avery Dennison Corp., Dexcom Inc., GENTAG Inc., HIVOX BIOTEK Inc., iRhythm Technologies Inc., Isansys Ltd., Masimo Corp., Medtronic Plc, NanoSonic Inc., NXP Semiconductors NV, OMRON Corp., Smith and Nephew plc, STMicroelectronics NV, Texas Instruments Inc., VitalConnect Inc., Vpatch Cardio Pty Ltd. are a few of the key vendors in the Sensor Patch market.

North America will register the highest growth rate of 37.2% among the other regions. Therefore, the Sensor Patch market in North America is expected to garner significant business opportunities for the vendors during the forecast period.

US, Canada, Mexico, China, India, Japan, South Korea, Australia, Indonesia, Germany, UK, France, Italy, Spain, The Netherlands, Brazil, Argentina, Chile, Saudi Arabia, UAE, South Africa, Israel, Turkey

  • Rise of smart sensor patches in modern medicine is the driving factor this market.

The Sensor Patch market vendors should focus on grabbing business opportunities from the Application segment as it accounted for the largest market share in the base year.