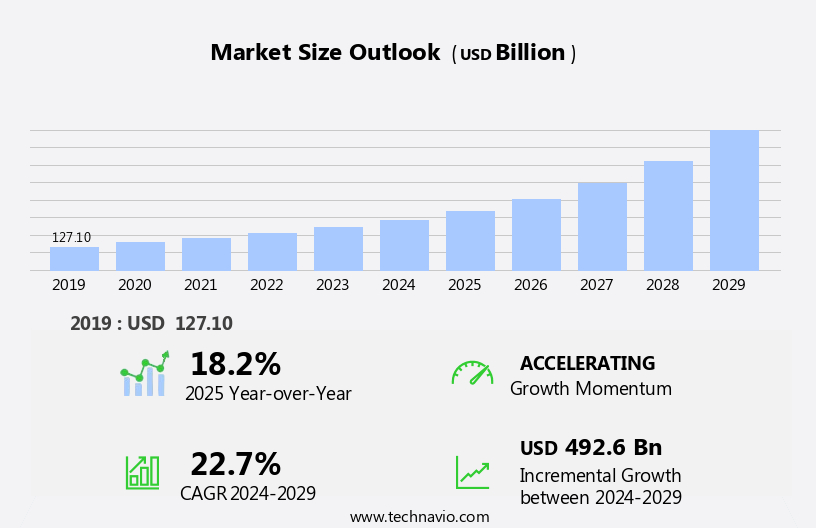
Shared Services Market Size 2025-2029
The shared services market size is forecast to increase by USD 492.6 billion at a CAGR of 22.7% between 2024 and 2029.
- The market is experiencing significant growth, driven by the increasing need for business process automation and the emergence of robotics process automation (RPA) technologies. Companies are recognizing the benefits of implementing Shared Service Centers (SSCs) to streamline operations, reduce costs, and improve efficiency. RPA is becoming a key enabler for SSCs, allowing for the automation of repetitive tasks and freeing up human resources for more complex and strategic work. Effective design and implementation of SSCs remain critical challenges for organizations. Data highlights the importance of having a well-defined strategy, clear communication channels, and a strong focus on process standardization and continuous improvement.
- Additionally, integrating RPA with SSCs can pose challenges related to data security and the need for robust IT infrastructure. Organizations must address these challenges to fully capitalize on the potential benefits of SSCs and RPA. Companies seeking to navigate these challenges effectively and capitalize on market opportunities should focus on developing a robust implementation plan, investing in the right technology, and ensuring strong collaboration between IT and business teams.
What will be the Size of the Shared Services Market during the forecast period?

Request Free Sample
- The market continues to evolve, driven by the ongoing pursuit of efficiency improvements and cost reduction across various sectors. Outsourcing providers employ global delivery models and centers of excellence to optimize business processes, integrating lean management, six sigma, and agile methodologies. Risk management is a critical component, ensuring service level agreements are met while mitigating potential threats. Robotic process automation and artificial intelligence are transformative technologies, enhancing business process management and customer service. Key performance indicators, company management, and technology enablement are essential elements, monitored closely to maintain service quality and drive continuous improvement. Cost reduction remains a key objective, with knowledge management, Digital Workplace, and digital transformation initiatives playing increasingly important roles.
- Real Estate optimization, Data Analytics, and Cloud computing are essential components of the shared services strategy, enabling agile and efficient service delivery models. Transformation initiatives in finance and accounting, human resources, and supply chain management are reshaping the market landscape, with talent management and change management becoming crucial competencies for service providers. Information technology continues to be a significant driver, with process optimization and service delivery model innovation at the forefront.
How is this Shared Services Industry segmented?
The shared services industry research report provides comprehensive data (region-wise segment analysis), with forecasts and estimates in "USD billion" for the period 2025-2029, as well as historical data from 2019-2023 for the following segments.
- Deployment
- Application
- Finance and Accounting
- Human Resources
- Information Technology
- Supply Chain Management
- End-User
- BFSI
- Healthcare
- Manufacturing
- Retail
- Geography
- North America
- Europe
- Middle East and Africa
- APAC
- South America
- Rest of World (ROW)
By Deployment Insights
The on premises segment is estimated to witness significant growth during the forecast period.
Shared services centers have gained significant traction among businesses, with on-premises solutions being particularly popular among large organizations. This model allows for customization to meet specific needs, ensuring greater control and flexibility. The trend is driven by factors such as data privacy and security concerns, as companies prioritize safeguarding their sensitive information following high-profile data breaches. On-premises shared services can be seamlessly integrated with existing systems and infrastructure, facilitating a smooth transition. Process automation and lean management are integral to shared services, driving efficiency improvements and cost reduction. Outsourcing providers play a crucial role in implementing these strategies, while employee engagement remains a key focus to maintain service quality.
Artificial intelligence, business process management, and robotic process automation are transforming shared services, enabling real-time data analytics and enhanced customer service. Human resources and talent management are essential components, with agile methodologies and change management ensuring a harmonious transition. Risk management is another critical aspect, with companies and service level agreements ensuring accountability and performance. Technology enablement, including cloud computing and digital transformation, is driving innovation in shared services. Six sigma and key performance indicators help measure success, while business intelligence and data analytics provide valuable insights. Finance and accounting, information technology, and supply chain management are common functions benefiting from shared services.
The global delivery model and center of excellence ensure consistent service delivery and continuous improvement. Transformation initiatives, including digital workplace and shared services strategy, are shaping the future of shared services. Real estate considerations and knowledge management are also essential factors in optimizing shared services operations. Ultimately, shared services represent a strategic investment in business process optimization and cost savings.

Request Free Sample
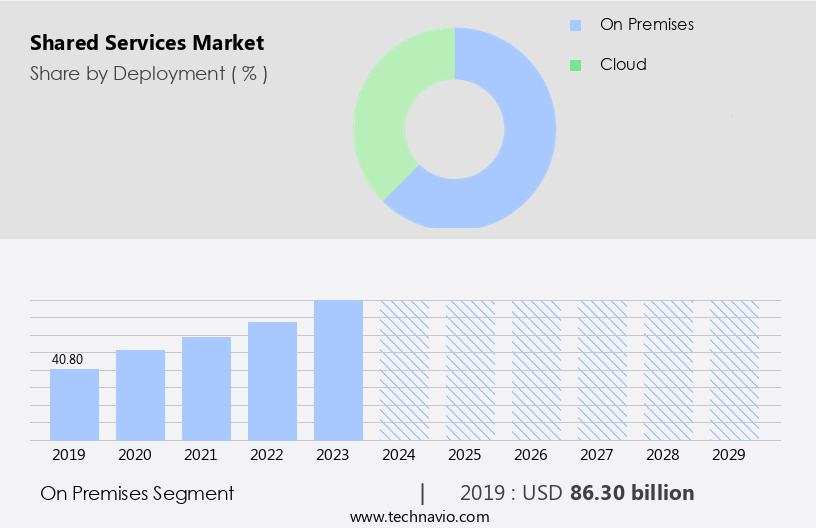
The On premises segment was valued at USD 86.30 billion in 2019 and showed a gradual increase during the forecast period.
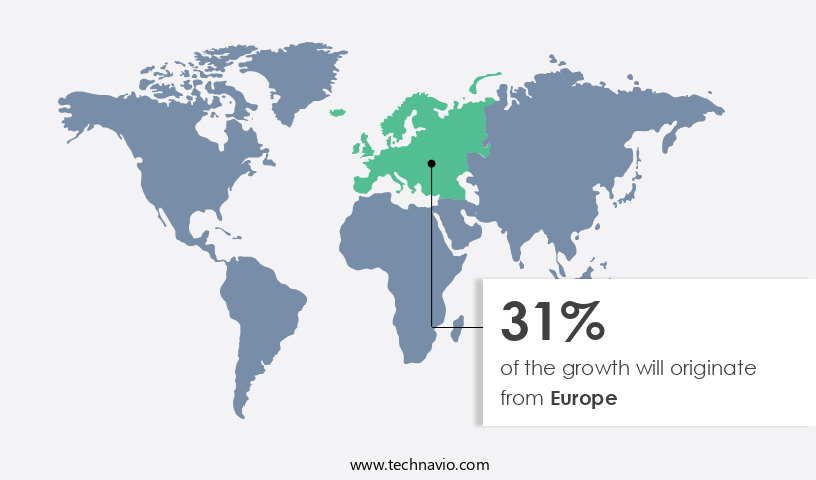
Regional Analysis
Europe is estimated to contribute 31% to the growth of the global market during the forecast period.Technavio's analysts have elaborately explained the regional trends and drivers that shape the market during the forecast period.

Request Free Sample
The market is experiencing significant growth, particularly in North America where it is becoming a strategic tool for industries such as manufacturing, healthcare, and oil and gas, to improve delivery systems and maintain competitiveness. Shared services centers (SSCs) are increasingly being established in South America due to its attractive business environment and abundance of skilled labor. However, managing the vast amounts of data generated in developed regions like North America poses a major challenge for financial institutions. Business process management, lean management, and agile methodologies are essential components of shared services, driving efficiency improvements and cost reduction.
Human resources, talent management, and change management are crucial for employee engagement and ensuring a smooth transition to the new service delivery model. Artificial intelligence, machine learning, and robotic process automation are transforming shared services by streamlining processes and enhancing customer service. Six sigma and risk management ensure service level agreements are met and company management is effective. Technology enablement, including cloud computing and digital transformation, is essential for the success of shared services centers. Key performance indicators and data analytics provide valuable insights for continuous process optimization and improvement. The global business services sector is embracing these trends, with finance and accounting, information technology, and supply chain management leading the way.
Shared services strategy and center of excellence ensure best practices are adopted and knowledge is shared across the organization. Risk management and change management are critical for successful implementation and ongoing service delivery. In conclusion, the market is evolving rapidly, with a focus on process optimization, technology enablement, and customer service. The global delivery model and real estate considerations are essential factors in the location decision-making process. Shared services are becoming increasingly important for organizations seeking to remain competitive in today's business landscape.
Market Dynamics
Our researchers analyzed the data with 2024 as the base year, along with the key drivers, trends, and challenges. A holistic analysis of drivers will help companies refine their marketing strategies to gain a competitive advantage.
What are the key market drivers leading to the rise in the adoption of Shared Services Industry?
- The imperative need for business process automation serves as the primary market driver.
- Shared services have emerged as a strategic initiative for businesses seeking to optimize processes and enhance operational efficiencies. By automating various functions such as finance and accounting, talent management, and supply chain management, organizations can reduce manual work and minimize redundancy and errors. Machine learning and business intelligence technologies play a crucial role in this automation, ensuring data accuracy and consistency. Change management is essential during the implementation of shared services to mitigate resistance and ensure a smooth transition. The integration of IT services into shared services strategies further streamlines processes and improves service delivery.
- Process optimization is a key benefit of shared services, enabling quick and high-quality service delivery systems for customers. Shared services have been shown to significantly impact operational efficiencies, with automation across finance and HR functions standardizing processes and maintaining cost controls for a sustainable competitive advantage in the marketplace.
What are the market trends shaping the Shared Services Industry?
- Robotics Process Automation (RPA) is gaining significant traction in the business world as an emerging trend. This automation technology streamlines business processes by mimicking human actions, thereby enhancing efficiency and reducing errors.
- Robotics process automation (RPA), driven by artificial intelligence (AI) and intelligent systems, is transforming business processes in various functions such as finance and accounting, human resources, and supply chain management. RPA automates repetitive tasks, reducing manual errors and enhancing operational efficiencies in shared services centers (SSCs). CIOs of SSCs are embracing this technology to digitally transform workflows, enabling seamless data sharing and resource utilization across business units.
- Lean management practices, agile methodologies, and business process management are being integrated with RPA to optimize processes further. AI-powered RPA solutions can handle customer service queries, freeing up human resources for more complex tasks. The implementation of RPA is a significant part of SSCs' ongoing transformation initiatives.
What challenges does the Shared Services Industry face during its growth?
- The effective design and implementation of Supply Chain Security Councils (SSCs) pose a significant challenge in ensuring industry growth, requiring the utmost professionalism and expertise.
- Shared Services Centers (SSCs) have become an essential component of business operations, offering cost reduction and improved efficiency through global delivery models. These centers require a combination of technical expertise and domain knowledge to meet client-specific business requirements. The implementation of SSCs necessitates significant capital expenditure (CAPEX) and advanced IT systems to design the infrastructure. SSCs manage intricate transactional processes, which can be simplified through IT systems, reducing error rates and enhancing backup and recovery solutions. However, the quality of IT services provided by SSCs is crucial, as subpar IT infrastructure may lead to contract termination.
- To mitigate risks, SSCs employ various strategies, such as six sigma methodologies, key performance indicators (KPIs), and company management with service level agreements (SLAs). Additionally, technology enablement, including Robotic Process Automation (Rpa), plays a significant role in enhancing the efficiency and effectiveness of SSCs. By implementing these strategies, businesses can optimize their shared services operations and achieve long-term success.
Exclusive Customer Landscape
The shared services market forecasting report includes the adoption lifecycle of the market, covering from the innovator's stage to the laggard's stage. It focuses on adoption rates in different regions based on penetration. Furthermore, the shared services market report also includes key purchase criteria and drivers of price sensitivity to help companies evaluate and develop their market growth analysis strategies.

Customer Landscape
Key Companies & Market Insights
Companies are implementing various strategies, such as strategic alliances, shared services market forecast, partnerships, mergers and acquisitions, geographical expansion, and product/service launches, to enhance their presence in the industry.
Accenture PLC - The company specializes in providing shared business solutions, including Mobility-as-a-Service, Process Optimization & Automation, and Intelligent Enterprise Services.
The industry research and growth report includes detailed analyses of the competitive landscape of the market and information about key companies, including:
- Accenture PLC
- Capgemini SE
- Cognizant Technology Solutions Corp.
- Deloitte Touche Tohmatsu Ltd.
- DXC Technology Co.
- Ernst & Young Global Ltd.
- Genpact Ltd.
- HCL Technologies Ltd.
- IBM Corp.
- Infosys Ltd.
- KPMG International Cooperative
- NTT Data Corp.
- PricewaterhouseCoopers International Ltd.
- SAP SE
- Tata Consultancy Services Ltd.
- Tech Mahindra Ltd.
- The Hackett Group Inc.
- Wipro Ltd.
- WNS Global Services Pvt. Ltd.
- Xerox Corp.
Qualitative and quantitative analysis of companies has been conducted to help clients understand the wider business environment as well as the strengths and weaknesses of key industry players. Data is qualitatively analyzed to categorize companies as pure play, category-focused, industry-focused, and diversified; it is quantitatively analyzed to categorize companies as dominant, leading, strong, tentative, and weak.
Recent Development and News in Shared Services Market
- In February 2024, IBM announced the launch of its new AI-powered accounting shared service center in Poland, aiming to serve over 100 clients worldwide. This expansion underscores IBM's commitment to leveraging advanced technologies to enhance efficiency and accuracy in financial operations (IBM Press Release, 2024).
- In June 2025, Accenture and Genpact joined forces to form a strategic partnership, combining their respective capabilities in business process services and digital transformation. This collaboration is expected to create a global powerhouse in the market, offering clients an extensive range of services and innovative solutions (Accenture Press Release, 2025).
- In October 2024, Tata Consultancy Services (TCS) secured a significant deal with a leading European retailer, expanding its footprint in the European the market. The contract includes the management of the retailer's finance, HR, and procurement functions, marking a substantial win for TCS in the competitive European market (TCS Press Release, 2024).
- In January 2025, Infosys unveiled its innovative Robotic Process Automation (RPA) platform, Infosys Automation Hub. This technological advancement is designed to streamline and automate repetitive tasks in shared services, enabling clients to reduce operational costs and improve productivity (Infosys Press Release, 2025).
Research Analyst Overview
In today's business landscape, the market is witnessing significant evolution, driven by the increasing adoption of Lean Six Sigma methodologies and data-driven decision-making. Best practices in shared services are shifting towards the implementation of a knowledge base and analytics dashboards on a shared services platform. Predictive Analytics and AI-powered solutions are becoming essential tools for identifying trends and optimizing IT infrastructure, disaster recovery, and service integration. A community of practice fosters continuous improvement through the exchange of ideas and the adoption of compliance frameworks, automation journeys, and problem management strategies. Shared services providers are embracing ISO certifications, business continuity planning, data privacy, and network management to ensure service level management and business process reengineering.
Value stream mapping and process redesign are essential components of end-to-end solutions, which include a service catalog, Data Center management, capacity management, and knowledge sharing. Service desks and incident management systems are crucial for effective change management and process standardization. The digital transformation roadmap for shared services involves cloud migration, process mapping, and the adoption of ISO certifications and AI-powered solutions to enhance service level management and ensure business continuity. Shared services providers are focusing on continuous improvement, service integration, and compliance with various regulations to meet the evolving needs of their clients.
Dive into Technavio's robust research methodology, blending expert interviews, extensive data synthesis, and validated models for unparalleled Shared Services Market insights. See full methodology.
|
Market Scope
|
|
Report Coverage
|
Details
|
|
Page number
|
216
|
|
Base year
|
2024
|
|
Historic period
|
2019-2023 |
|
Forecast period
|
2025-2029
|
|
Growth momentum & CAGR
|
Accelerate at a CAGR of 22.7%
|
|
Market growth 2025-2029
|
USD 492.6 billion
|
|
Market structure
|
Fragmented
|
|
YoY growth 2024-2025(%)
|
18.2
|
|
Key countries
|
US, China, India, Germany, Canada, UK, France, Brazil, Japan, and UAE
|
|
Competitive landscape
|
Leading Companies, Market Positioning of Companies, Competitive Strategies, and Industry Risks
|
Request Free Sample
What are the Key Data Covered in this Shared Services Market Research and Growth Report?
- CAGR of the Shared Services industry during the forecast period
- Detailed information on factors that will drive the growth and forecasting between 2025 and 2029
- Precise estimation of the size of the market and its contribution of the industry in focus to the parent market
- Accurate predictions about upcoming growth and trends and changes in consumer behaviour
- Growth of the market across North America, Europe, APAC, South America, and Middle East and Africa
- Thorough analysis of the market's competitive landscape and detailed information about companies
- Comprehensive analysis of factors that will challenge the shared services market growth of industry companies
Talk to our Author!
Have questions about our Market Research Report? Connect with our Principal Consultant for exclusive insights.
1 Executive Summary
- 1.1 Market overview
- Executive Summary - Chart on Market Overview
- Executive Summary - Data Table on Market Overview
- Executive Summary - Chart on Global Market Characteristics
- Executive Summary - Chart on Market by Geography
- Executive Summary - Chart on Market Segmentation by Deployment
- Executive Summary - Chart on Market Segmentation by Application
- Executive Summary - Chart on Incremental Growth
- Executive Summary - Data Table on Incremental Growth
- Executive Summary - Chart on Company Market Positioning
2 Technavio Analysis
- 2.1 Analysis of price sensitivity, lifecycle, customer purchase basket, adoption rates, and purchase criteria
- Analysis of price sensitivity, lifecycle, customer purchase basket, adoption rates, and purchase criteria
- 2.2 Criticality of inputs and Factors of differentiation
- Overview on criticality of inputs and factors of differentiation
- 2.3 Factors of disruption
- Overview on factors of disruption
- 2.4 Impact of drivers and challenges
- Impact of drivers and challenges in 2024 and 2029
3 Market Landscape
- 3.1 Market ecosystem
- Parent Market
- Data Table on - Parent Market
- 3.2 Market characteristics
- Market characteristics analysis
4 Market Sizing
- 4.1 Market definition
- Offerings of companies included in the market definition
- 4.2 Market segment analysis
- 4.4 Market outlook: Forecast for 2024-2029
- Chart on Global - Market size and forecast 2024-2029 ($ billion)
- Data Table on Global - Market size and forecast 2024-2029 ($ billion)
- Chart on Global Market: Year-over-year growth 2024-2029 (%)
- Data Table on Global Market: Year-over-year growth 2024-2029 (%)
5 Historic Market Size
- 5.1 Global Shared Services Market 2019 - 2023
- Historic Market Size - Data Table on Global Shared Services Market 2019 - 2023 ($ billion)
- 5.2 Deployment segment analysis 2019 - 2023
- Historic Market Size - Deployment Segment 2019 - 2023 ($ billion)
- 5.3 Application segment analysis 2019 - 2023
- Historic Market Size - Application Segment 2019 - 2023 ($ billion)
- 5.4 Geography segment analysis 2019 - 2023
- Historic Market Size - Geography Segment 2019 - 2023 ($ billion)
- 5.5 Country segment analysis 2019 - 2023
- Historic Market Size - Country Segment 2019 - 2023 ($ billion)
6 Qualitative Analysis
- 6.1 The AI impact on Global Shared Services Market
7 Five Forces Analysis
- 7.1 Five forces summary
- Five forces analysis - Comparison between 2024 and 2029
- 7.2 Bargaining power of buyers
- Bargaining power of buyers - Impact of key factors 2024 and 2029
- 7.3 Bargaining power of suppliers
- Bargaining power of suppliers - Impact of key factors in 2024 and 2029
- 7.4 Threat of new entrants
- Threat of new entrants - Impact of key factors in 2024 and 2029
- 7.5 Threat of substitutes
- Threat of substitutes - Impact of key factors in 2024 and 2029
- 7.6 Threat of rivalry
- Threat of rivalry - Impact of key factors in 2024 and 2029
- 7.7 Market condition
- Chart on Market condition - Five forces 2024 and 2029
8 Market Segmentation by Deployment
- 8.1 Market segments
- Chart on Deployment - Market share (2024-2029) (%)
- Data Table on Deployment - Market share (2024-2029) (%)
- 8.2 Comparison by Deployment
- Chart on Comparison by Deployment
- Data Table on Comparison by Deployment
- 8.3 On premises - Market size and forecast (2024-2029)
- Chart on On premises - Market size and forecast (2024-2029) ($ billion)
- Data Table on On premises - Market size and forecast (2024-2029) ($ billion)
- Chart on On premises - Year-over-year growth (2024-2029) (%)
- Data Table on On premises - Year-over-year growth (2024-2029) (%)
- 8.4 Cloud - Market size and forecast (2024-2029)
- Chart on Cloud - Market size and forecast (2024-2029) ($ billion)
- Data Table on Cloud - Market size and forecast (2024-2029) ($ billion)
- Chart on Cloud - Year-over-year growth (2024-2029) (%)
- Data Table on Cloud - Year-over-year growth (2024-2029) (%)
- 8.5 Market opportunity by Deployment
- Market opportunity by Deployment ($ billion)
- Data Table on Market opportunity by Deployment ($ billion)
9 Market Segmentation by Application
- 9.1 Market segments
- Chart on Application - Market share (2024-2029) (%)
- Data Table on Application - Market share (2024-2029) (%)
- 9.2 Comparison by Application
- Chart on Comparison by Application
- Data Table on Comparison by Application
- 9.3 Finance and Accounting - Market size and forecast (2024-2029)
- Chart on Finance and Accounting - Market size and forecast (2024-2029) ($ billion)
- Data Table on Finance and Accounting - Market size and forecast (2024-2029) ($ billion)
- Chart on Finance and Accounting - Year-over-year growth (2024-2029) (%)
- Data Table on Finance and Accounting - Year-over-year growth (2024-2029) (%)
- 9.4 Human Resources - Market size and forecast (2024-2029)
- Chart on Human Resources - Market size and forecast (2024-2029) ($ billion)
- Data Table on Human Resources - Market size and forecast (2024-2029) ($ billion)
- Chart on Human Resources - Year-over-year growth (2024-2029) (%)
- Data Table on Human Resources - Year-over-year growth (2024-2029) (%)
- 9.5 Information Technology - Market size and forecast (2024-2029)
- Chart on Information Technology - Market size and forecast (2024-2029) ($ billion)
- Data Table on Information Technology - Market size and forecast (2024-2029) ($ billion)
- Chart on Information Technology - Year-over-year growth (2024-2029) (%)
- Data Table on Information Technology - Year-over-year growth (2024-2029) (%)
- 9.6 Supply Chain Management - Market size and forecast (2024-2029)
- Chart on Supply Chain Management - Market size and forecast (2024-2029) ($ billion)
- Data Table on Supply Chain Management - Market size and forecast (2024-2029) ($ billion)
- Chart on Supply Chain Management - Year-over-year growth (2024-2029) (%)
- Data Table on Supply Chain Management - Year-over-year growth (2024-2029) (%)
- 9.7 Market opportunity by Application
- Market opportunity by Application ($ billion)
- Data Table on Market opportunity by Application ($ billion)
10 Market Segmentation by End-User
- 10.1 Market segments
- Chart on End-User - Market share (2024-2029) (%)
- Data Table on End-User - Market share (2024-2029) (%)
- 10.2 Comparison by End-User
- Chart on Comparison by End-User
- Data Table on Comparison by End-User
- 10.3 BFSI - Market size and forecast (2024-2029)
- Chart on BFSI - Market size and forecast (2024-2029) ($ billion)
- Data Table on BFSI - Market size and forecast (2024-2029) ($ billion)
- Chart on BFSI - Year-over-year growth (2024-2029) (%)
- Data Table on BFSI - Year-over-year growth (2024-2029) (%)
- 10.4 Healthcare - Market size and forecast (2024-2029)
- Chart on Healthcare - Market size and forecast (2024-2029) ($ billion)
- Data Table on Healthcare - Market size and forecast (2024-2029) ($ billion)
- Chart on Healthcare - Year-over-year growth (2024-2029) (%)
- Data Table on Healthcare - Year-over-year growth (2024-2029) (%)
- 10.5 Manufacturing - Market size and forecast (2024-2029)
- Chart on Manufacturing - Market size and forecast (2024-2029) ($ billion)
- Data Table on Manufacturing - Market size and forecast (2024-2029) ($ billion)
- Chart on Manufacturing - Year-over-year growth (2024-2029) (%)
- Data Table on Manufacturing - Year-over-year growth (2024-2029) (%)
- 10.6 Retail - Market size and forecast (2024-2029)
- Chart on Retail - Market size and forecast (2024-2029) ($ billion)
- Data Table on Retail - Market size and forecast (2024-2029) ($ billion)
- Chart on Retail - Year-over-year growth (2024-2029) (%)
- Data Table on Retail - Year-over-year growth (2024-2029) (%)
- 10.7 Market opportunity by End-User
- Market opportunity by End-User ($ billion)
- Data Table on Market opportunity by End-User ($ billion)
11 Customer Landscape
- 11.1 Customer landscape overview
- Analysis of price sensitivity, lifecycle, customer purchase basket, adoption rates, and purchase criteria
12 Geographic Landscape
- 12.1 Geographic segmentation
- Chart on Market share by geography 2024-2029 (%)
- Data Table on Market share by geography 2024-2029 (%)
- 12.2 Geographic comparison
- Chart on Geographic comparison
- Data Table on Geographic comparison
- 12.3 North America - Market size and forecast 2024-2029
- Chart on North America - Market size and forecast 2024-2029 ($ billion)
- Data Table on North America - Market size and forecast 2024-2029 ($ billion)
- Chart on North America - Year-over-year growth 2024-2029 (%)
- Data Table on North America - Year-over-year growth 2024-2029 (%)
- 12.4 Europe - Market size and forecast 2024-2029
- Chart on Europe - Market size and forecast 2024-2029 ($ billion)
- Data Table on Europe - Market size and forecast 2024-2029 ($ billion)
- Chart on Europe - Year-over-year growth 2024-2029 (%)
- Data Table on Europe - Year-over-year growth 2024-2029 (%)
- 12.5 APAC - Market size and forecast 2024-2029
- Chart on APAC - Market size and forecast 2024-2029 ($ billion)
- Data Table on APAC - Market size and forecast 2024-2029 ($ billion)
- Chart on APAC - Year-over-year growth 2024-2029 (%)
- Data Table on APAC - Year-over-year growth 2024-2029 (%)
- 12.6 South America - Market size and forecast 2024-2029
- Chart on South America - Market size and forecast 2024-2029 ($ billion)
- Data Table on South America - Market size and forecast 2024-2029 ($ billion)
- Chart on South America - Year-over-year growth 2024-2029 (%)
- Data Table on South America - Year-over-year growth 2024-2029 (%)
- 12.7 Middle East and Africa - Market size and forecast 2024-2029
- Chart on Middle East and Africa - Market size and forecast 2024-2029 ($ billion)
- Data Table on Middle East and Africa - Market size and forecast 2024-2029 ($ billion)
- Chart on Middle East and Africa - Year-over-year growth 2024-2029 (%)
- Data Table on Middle East and Africa - Year-over-year growth 2024-2029 (%)
- 12.8 US - Market size and forecast 2024-2029
- Chart on US - Market size and forecast 2024-2029 ($ billion)
- Data Table on US - Market size and forecast 2024-2029 ($ billion)
- Chart on US - Year-over-year growth 2024-2029 (%)
- Data Table on US - Year-over-year growth 2024-2029 (%)
- 12.9 China - Market size and forecast 2024-2029
- Chart on China - Market size and forecast 2024-2029 ($ billion)
- Data Table on China - Market size and forecast 2024-2029 ($ billion)
- Chart on China - Year-over-year growth 2024-2029 (%)
- Data Table on China - Year-over-year growth 2024-2029 (%)
- 12.10 India - Market size and forecast 2024-2029
- Chart on India - Market size and forecast 2024-2029 ($ billion)
- Data Table on India - Market size and forecast 2024-2029 ($ billion)
- Chart on India - Year-over-year growth 2024-2029 (%)
- Data Table on India - Year-over-year growth 2024-2029 (%)
- 12.11 Germany - Market size and forecast 2024-2029
- Chart on Germany - Market size and forecast 2024-2029 ($ billion)
- Data Table on Germany - Market size and forecast 2024-2029 ($ billion)
- Chart on Germany - Year-over-year growth 2024-2029 (%)
- Data Table on Germany - Year-over-year growth 2024-2029 (%)
- 12.12 Canada - Market size and forecast 2024-2029
- Chart on Canada - Market size and forecast 2024-2029 ($ billion)
- Data Table on Canada - Market size and forecast 2024-2029 ($ billion)
- Chart on Canada - Year-over-year growth 2024-2029 (%)
- Data Table on Canada - Year-over-year growth 2024-2029 (%)
- 12.13 UK - Market size and forecast 2024-2029
- Chart on UK - Market size and forecast 2024-2029 ($ billion)
- Data Table on UK - Market size and forecast 2024-2029 ($ billion)
- Chart on UK - Year-over-year growth 2024-2029 (%)
- Data Table on UK - Year-over-year growth 2024-2029 (%)
- 12.14 France - Market size and forecast 2024-2029
- Chart on France - Market size and forecast 2024-2029 ($ billion)
- Data Table on France - Market size and forecast 2024-2029 ($ billion)
- Chart on France - Year-over-year growth 2024-2029 (%)
- Data Table on France - Year-over-year growth 2024-2029 (%)
- 12.15 Brazil - Market size and forecast 2024-2029
- Chart on Brazil - Market size and forecast 2024-2029 ($ billion)
- Data Table on Brazil - Market size and forecast 2024-2029 ($ billion)
- Chart on Brazil - Year-over-year growth 2024-2029 (%)
- Data Table on Brazil - Year-over-year growth 2024-2029 (%)
- 12.16 Japan - Market size and forecast 2024-2029
- Chart on Japan - Market size and forecast 2024-2029 ($ billion)
- Data Table on Japan - Market size and forecast 2024-2029 ($ billion)
- Chart on Japan - Year-over-year growth 2024-2029 (%)
- Data Table on Japan - Year-over-year growth 2024-2029 (%)
- 12.17 UAE - Market size and forecast 2024-2029
- Chart on UAE - Market size and forecast 2024-2029 ($ billion)
- Data Table on UAE - Market size and forecast 2024-2029 ($ billion)
- Chart on UAE - Year-over-year growth 2024-2029 (%)
- Data Table on UAE - Year-over-year growth 2024-2029 (%)
- 12.18 Market opportunity by geography
- Market opportunity by geography ($ billion)
- Data Tables on Market opportunity by geography ($ billion)
- 12.19 Rest of World (ROW) - Market size and forecast (2024-2029)
- Chart on Rest of World (ROW) - Market size and forecast (2024-2029) ($ billion)
- Data Table on Rest of World (ROW) - Market size and forecast (2024-2029) ($ billion)
- Chart on Rest of World (ROW) - Year-over-year growth (2024-2029) (%)
- Data Table on Rest of World (ROW) - Year-over-year growth (2024-2029) (%)
13 Drivers, Challenges, and Opportunity/Restraints
- 13.3 Impact of drivers and challenges
- Impact of drivers and challenges in 2024 and 2029
- 13.4 Market opportunities/restraints
14 Competitive Landscape
- 14.2 Competitive Landscape
- Overview on criticality of inputs and factors of differentiation
- 14.3 Landscape disruption
- Overview on factors of disruption
- 14.4 Industry risks
- Impact of key risks on business
15 Competitive Analysis
- 15.2 Market positioning of companies
- Matrix on companies position and classification
- 15.3 Accenture PLC
- Accenture PLC - Overview
- Accenture PLC - Product / Service
- Accenture PLC - Key offerings
- 15.4 Capgemini SE
- Capgemini SE - Overview
- Capgemini SE - Product / Service
- Capgemini SE - Key offerings
- 15.5 Cognizant Technology Solutions Corp.
- Cognizant Technology Solutions Corp. - Overview
- Cognizant Technology Solutions Corp. - Product / Service
- Cognizant Technology Solutions Corp. - Key offerings
- 15.6 Deloitte Touche Tohmatsu Ltd.
- Deloitte Touche Tohmatsu Ltd. - Overview
- Deloitte Touche Tohmatsu Ltd. - Product / Service
- Deloitte Touche Tohmatsu Ltd. - Key offerings
- 15.7 DXC Technology Co.
- DXC Technology Co. - Overview
- DXC Technology Co. - Product / Service
- DXC Technology Co. - Key offerings
- 15.8 Ernst & Young Global Ltd.
- Ernst & Young Global Ltd. - Overview
- Ernst & Young Global Ltd. - Product / Service
- Ernst & Young Global Ltd. - Key offerings
- 15.9 Genpact Ltd.
- Genpact Ltd. - Overview
- Genpact Ltd. - Product / Service
- Genpact Ltd. - Key offerings
- 15.10 HCL Technologies Ltd.
- HCL Technologies Ltd. - Overview
- HCL Technologies Ltd. - Product / Service
- HCL Technologies Ltd. - Key offerings
- 15.11 IBM Corp.
- IBM Corp. - Overview
- IBM Corp. - Product / Service
- IBM Corp. - Key offerings
- 15.12 Infosys Ltd.
- Infosys Ltd. - Overview
- Infosys Ltd. - Product / Service
- Infosys Ltd. - Key offerings
- 15.13 KPMG International Cooperative
- KPMG International Cooperative - Overview
- KPMG International Cooperative - Product / Service
- KPMG International Cooperative - Key offerings
- 15.14 NTT Data Corp.
- NTT Data Corp. - Overview
- NTT Data Corp. - Product / Service
- NTT Data Corp. - Key offerings
- 15.15 PricewaterhouseCoopers International Ltd.
- PricewaterhouseCoopers International Ltd. - Overview
- PricewaterhouseCoopers International Ltd. - Product / Service
- PricewaterhouseCoopers International Ltd. - Key offerings
- 15.16 SAP SE
- SAP SE - Overview
- SAP SE - Product / Service
- SAP SE - Key offerings
- 15.17 Tata Consultancy Services Ltd.
- Tata Consultancy Services Ltd. - Overview
- Tata Consultancy Services Ltd. - Product / Service
- Tata Consultancy Services Ltd. - Key offerings
- 15.18 Tech Mahindra Ltd.
- Tech Mahindra Ltd. - Overview
- Tech Mahindra Ltd. - Product / Service
- Tech Mahindra Ltd. - Key offerings
- 15.19 The Hackett Group Inc.
- The Hackett Group Inc. - Overview
- The Hackett Group Inc. - Product / Service
- The Hackett Group Inc. - Key offerings
- 15.20 Wipro Ltd.
- Wipro Ltd. - Overview
- Wipro Ltd. - Product / Service
- Wipro Ltd. - Key offerings
- 15.21 WNS Global Services Pvt. Ltd.
- WNS Global Services Pvt. Ltd. - Overview
- WNS Global Services Pvt. Ltd. - Product / Service
- WNS Global Services Pvt. Ltd. - Key offerings
- 15.22 Xerox Corp.
- Xerox Corp. - Overview
- Xerox Corp. - Product / Service
- Xerox Corp. - Key offerings
- 15.23 Accenture PLC
- Accenture PLC - Overview
- Accenture PLC - Product / Service
- Accenture PLC - Key offerings
- 15.24 Atos SE
- Atos SE - Overview
- Atos SE - Product / Service
- Atos SE - Key offerings
- 15.25 Capgemini Services SAS
- Capgemini Services SAS - Overview
- Capgemini Services SAS - Product / Service
- Capgemini Services SAS - Key offerings
- 15.26 CGI Inc.
- CGI Inc. - Overview
- CGI Inc. - Product / Service
- CGI Inc. - Key offerings
- 15.27 Cognizant Technology Solutions Corp.
- Cognizant Technology Solutions Corp. - Overview
- Cognizant Technology Solutions Corp. - Product / Service
- Cognizant Technology Solutions Corp. - Key offerings
- 15.28 Deloitte Touche Tohmatsu Ltd.
- Deloitte Touche Tohmatsu Ltd. - Overview
- Deloitte Touche Tohmatsu Ltd. - Product / Service
- Deloitte Touche Tohmatsu Ltd. - Key offerings
- 15.29 ExlService Holdings Inc.
- ExlService Holdings Inc. - Overview
- ExlService Holdings Inc. - Product / Service
- ExlService Holdings Inc. - Key offerings
- 15.30 Gartner Inc.
- Gartner Inc. - Overview
- Gartner Inc. - Product / Service
- Gartner Inc. - Key offerings
- 15.31 Genpact Ltd.
- Genpact Ltd. - Overview
- Genpact Ltd. - Product / Service
- Genpact Ltd. - Key offerings
- 15.32 HCL Technologies Ltd.
- HCL Technologies Ltd. - Overview
- HCL Technologies Ltd. - Product / Service
- HCL Technologies Ltd. - Key offerings
- 15.33 Infosys Ltd.
- Infosys Ltd. - Overview
- Infosys Ltd. - Product / Service
- Infosys Ltd. - Key offerings
- 15.34 International Business Machines Corp.
- International Business Machines Corp. - Overview
- International Business Machines Corp. - Product / Service
- International Business Machines Corp. - Key offerings
- 15.35 KPMG International Ltd.
- KPMG International Ltd. - Overview
- KPMG International Ltd. - Product / Service
- KPMG International Ltd. - Key offerings
- 15.36 Oracle Corp
- Oracle Corp - Overview
- Oracle Corp - Product / Service
- Oracle Corp - Key offerings
- 15.37 PricewaterhouseCoopers LLP
- PricewaterhouseCoopers LLP - Overview
- PricewaterhouseCoopers LLP - Product / Service
- PricewaterhouseCoopers LLP - Key offerings
- 15.38 SAP SE
- SAP SE - Overview
- SAP SE - Product / Service
- SAP SE - Key offerings
- 15.39 ServiceNow Inc.
- ServiceNow Inc. - Overview
- ServiceNow Inc. - Product / Service
- ServiceNow Inc. - Key offerings
- 15.40 Tata Consultancy Services Ltd.
- Tata Consultancy Services Ltd. - Overview
- Tata Consultancy Services Ltd. - Product / Service
- Tata Consultancy Services Ltd. - Key offerings
- 15.41 The Hackett Group Inc.
- The Hackett Group Inc. - Overview
- The Hackett Group Inc. - Product / Service
- The Hackett Group Inc. - Key offerings
- 15.42 Wipro Ltd.
- Wipro Ltd. - Overview
- Wipro Ltd. - Product / Service
- Wipro Ltd. - Key offerings
16 Appendix
- 16.2 Inclusions and exclusions checklist
- Inclusions checklist
- Exclusions checklist
- 16.3 Currency conversion rates for US$
- Currency conversion rates for US$
- 16.4 Research methodology
- 16.7 Validation techniques employed for market sizing
- Validation techniques employed for market sizing
- 16.9 360 degree market analysis
- 360 degree market analysis
- 16.10 List of abbreviations