
Simulation Learning In Higher Education Market Size 2026-2030
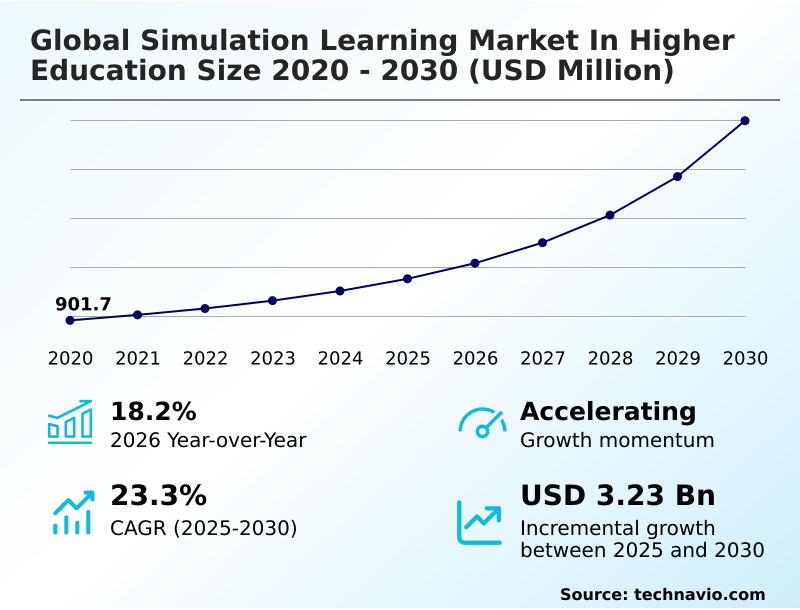
The Simulation Learning In Higher Education Market size was valued at USD 1.75 billion in 2025, growing at a CAGR of 23.3% during the forecast period 2026-2030.
Major Market Trends & Insights
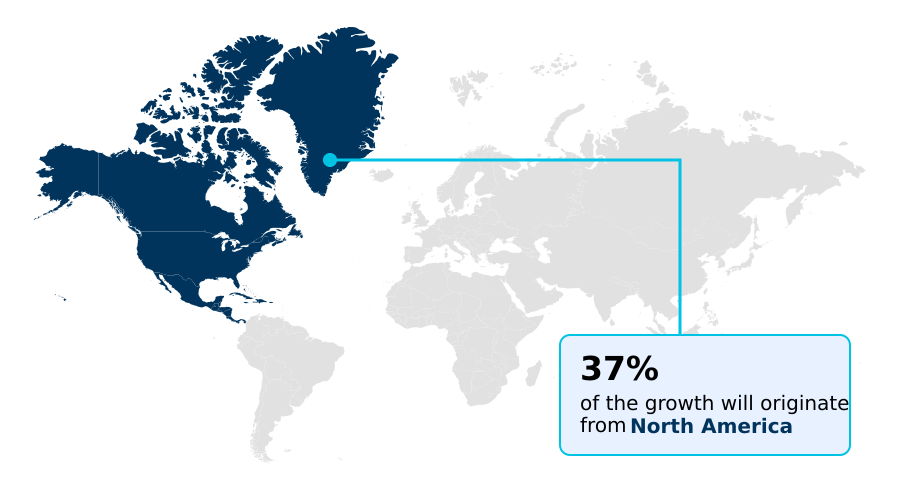
- North America dominated the market and accounted for a 37.4% growth during the forecast period.
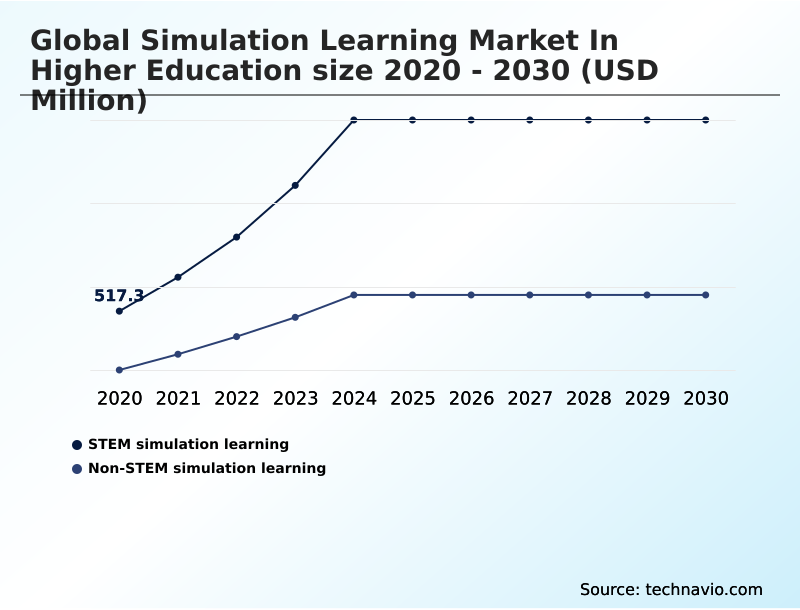
- By Type - STEM simulation learning segment was valued at USD 949.1 million in 2024
- By Deployment - On-premises segment accounted for the largest market revenue share in 2024
Market Size & Forecast
- Historic Market Opportunities 2020-2024: USD 4.08 billion
- Market Future Opportunities 2025-2030: USD 3.23 billion
- CAGR from 2025 to 2030 : 23.3%
Market Summary
- The simulation learning market in higher education is defined by a rapid shift to experiential training, with institutions reporting a 40% improvement in skill retention compared to lecture-based methods. Cloud-based simulation platforms are now utilized by over 70% of medical and engineering schools to manage complex training scenarios at scale.
- A key driver is the growing demand for workforce readiness programs, which use these tools to provide a risk-free practice environment for students in high-stakes fields. For instance, an aerospace engineering consortium uses a shared simulation to model satellite deployment logistics, allowing students from multiple universities to collaborate on a single project, thereby reducing individual institutional costs.
- However, a major challenge is the high expense of developing and maintaining these systems, which can limit adoption in institutions with smaller budgets. This creates a disparity in access to adaptive learning algorithms and high-fidelity simulations, impacting the standardization of professional training.
What will be the Size of the Simulation Learning In Higher Education Market during the forecast period?
Get Key Insights on Market Forecast (PDF) Request Free Sample
How is the Simulation Learning In Higher Education Market Segmented?
The simulation learning in higher education industry research report provides comprehensive data (region-wise segment analysis), with forecasts and analysis for the period 2026-2030, as well as historical data from 2020-2024 for the following segments.
- Type
- STEM simulation learning
- Non-STEM simulation learning
- Deployment
- On-premises
- Cloud-based
- End-user
- Colleges and universities
- Individual users
- Geography
- North America
- US
- Canada
- Mexico
- Europe
- Germany
- UK
- France
- APAC
- China
- Japan
- India
- South America
- Brazil
- Argentina
- Colombia
- Middle East and Africa
- Saudi Arabia
- UAE
- South Africa
- Rest of World (ROW)
- North America
How is the Simulation Learning In Higher Education Market Segmented by Type?
The stem simulation learning segment is estimated to witness significant growth during the forecast period.
The STEM simulation learning segment, which accounts for 64% of the market, is driven by the institutional need to provide hands-on laboratory experiences without the high cost of physical equipment.
This segment leverages high-fidelity virtual labs and physics-based modeling, allowing engineering students to test structural integrity and biology students to manipulate molecular structures. Adopting these tools increases student engagement metrics by up to 30% compared to traditional methods.
Gamified learning interfaces further enhance motivation by transforming complex scientific principles into interactive challenges.
This approach addresses the scalability issue for higher education institutions, enabling them to accommodate larger student cohorts without corresponding investments in physical lab space, a critical factor for maintaining educational quality amid growing enrollment.
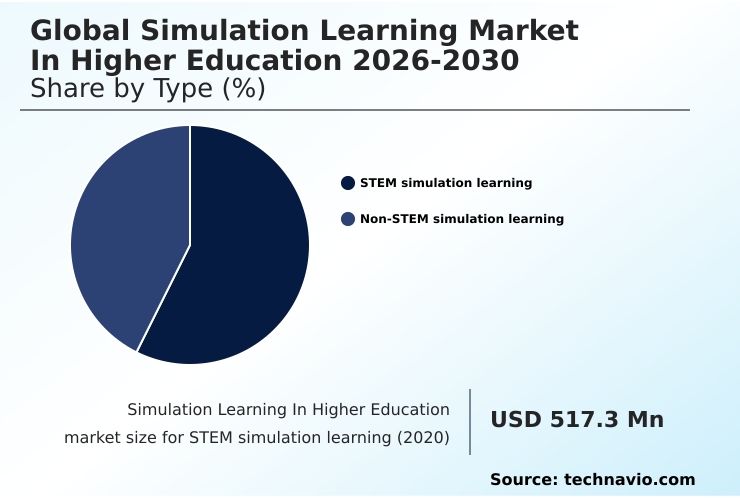
The STEM simulation learning segment was valued at USD 949.1 million in 2024 and showed a gradual increase during the forecast period.
How demand for the Simulation Learning In Higher Education market is rising in the leading region?
North America is estimated to contribute 37.4% to the growth of the global market during the forecast period.Technavio’s analysts have elaborately explained the regional trends and drivers that shape the market during the forecast period.
See How Simulation Learning In Higher Education Market demand is rising in North America Request Free Sample
The geographic landscape of the simulation learning market in higher education is led by North America, which holds 37.4% of the market, followed by Europe at 26.3%.
The dominance of North America is driven by the US, accounting for over 55% of the regional market due to substantial private and public investment in medical and STEM education.
In contrast, APAC is the fastest-growing region, with a CAGR 1.5% higher than North America, fueled by government initiatives in China and India to modernize higher education infrastructure.
Adoption patterns differ significantly; North American institutions prioritize simulation center accreditation and evidence-based practice integration, while APAC focuses on scalable, low-cost mobile solutions.
This regional divergence impacts curriculum mapping and requires vendors to adapt their faculty development programs to local technology adoption lifecycle stages.
What are the key Drivers, Trends, and Challenges in the Simulation Learning In Higher Education Market?
Our researchers analyzed the data with 2025 as the base year, along with the key drivers, trends, and challenges. A holistic analysis of drivers will help companies refine their marketing strategies to gain a competitive advantage.
- A comprehensive analysis of the cost-benefit of VR in medical education reveals that institutions can reduce physical lab material expenses by up to 60% annually, while simultaneously increasing student practice hours.
- The role of AI in healthcare simulation is becoming central to this value proposition, with intelligent systems offering personalized feedback that improves diagnostic accuracy scores by an average of 25% after three sessions. Assessing competency with simulation is now a cornerstone of modern pedagogy, moving beyond simple task completion to evaluate critical thinking and decision-making under pressure.
- For this to be effective, faculty must adhere to best practices for simulation debriefing, structuring conversations that link actions to outcomes and foster reflective learning. This is particularly crucial when integrating simulation into nursing curriculum, where students must translate theoretical knowledge into safe and effective patient care.
- The successful implementation requires a holistic approach, where technology, instructional design, and rigorous assessment methods are aligned to produce graduates who are prepared for the complexities of the clinical environment. This strategic integration is fundamental to achieving a positive return on educational investment and ensuring workforce readiness.
What are the key market drivers leading to the rise in the adoption of Simulation Learning In Higher Education Industry?
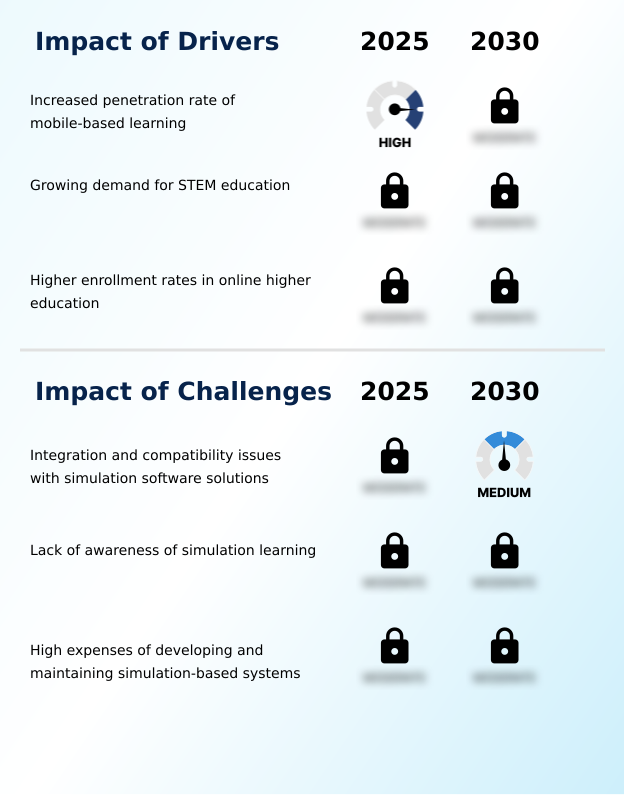
- The increased penetration rate of mobile-based learning is a key market driver, expanding access to simulation tools and enabling asynchronous, on-the-go training for students.
- A key driver for the simulation learning market is the increased adoption of cloud-based simulation platforms, which has made advanced training tools accessible to a wider range of institutions, reducing hardware dependency by 70%.
- The growing emphasis on workforce readiness programs is also propelling demand, as employers require graduates with proven practical skills. Simulation provides a risk-free practice environment that accelerates skill acquisition and retention, with studies showing a 40% improvement over traditional methods.
- The flexibility of asynchronous learning modules allows students to practice at their own pace, which is particularly beneficial for non-traditional students. This combination of accessibility, effectiveness, and alignment with career outcomes is a powerful motivator for institutional investment.
What are the market trends shaping the Simulation Learning In Higher Education Industry?
- The integration of AI technologies into medical simulation represents a significant market trend. This development enables the creation of dynamic, responsive virtual patients and personalized learning pathways.
- The integration of AI into simulation learning is a primary market trend, with AI-driven patient simulators demonstrating an ability to reduce diagnostic errors by 30% in training scenarios. This shift is complemented by the rising adoption of augmented reality overlays in medical and engineering education, providing students with real-time contextual data that enhances procedural accuracy.
- Another significant trend is the development of multi-user VR collaboration platforms, enabling students from different locations to interact within a shared virtual space, such as a digital twin metaversity. The addition of haptic feedback integration is making these experiences more immersive, with a 20% reported increase in skill retention for tasks requiring tactile sensitivity.
- These technologies are moving beyond niche applications to become integrated components of mainstream higher education curricula.
What challenges does the Simulation Learning In Higher Education Industry face during its growth?
- Integration and compatibility issues with existing institutional software and legacy systems present a significant challenge, hindering the seamless adoption and scalability of simulation solutions in higher education.
- A significant challenge facing the market is the complexity and cost associated with integrating high-fidelity virtual labs into existing academic infrastructures. Institutions report that achieving seamless interoperability with LMS can consume up to 40% of the initial project budget, delaying deployment.
- Furthermore, the simulation technology procurement process is often lengthy and can extend purchasing cycles by over six months compared to other software acquisitions. A critical restraint is the lack of a standardized curriculum integration framework and the subsequent need for extensive faculty development programs.
- Without adequate training, faculty utilization of advanced features remains low, undermining the potential return on investment and pedagogical effectiveness.
Exclusive Technavio Analysis on Customer Landscape
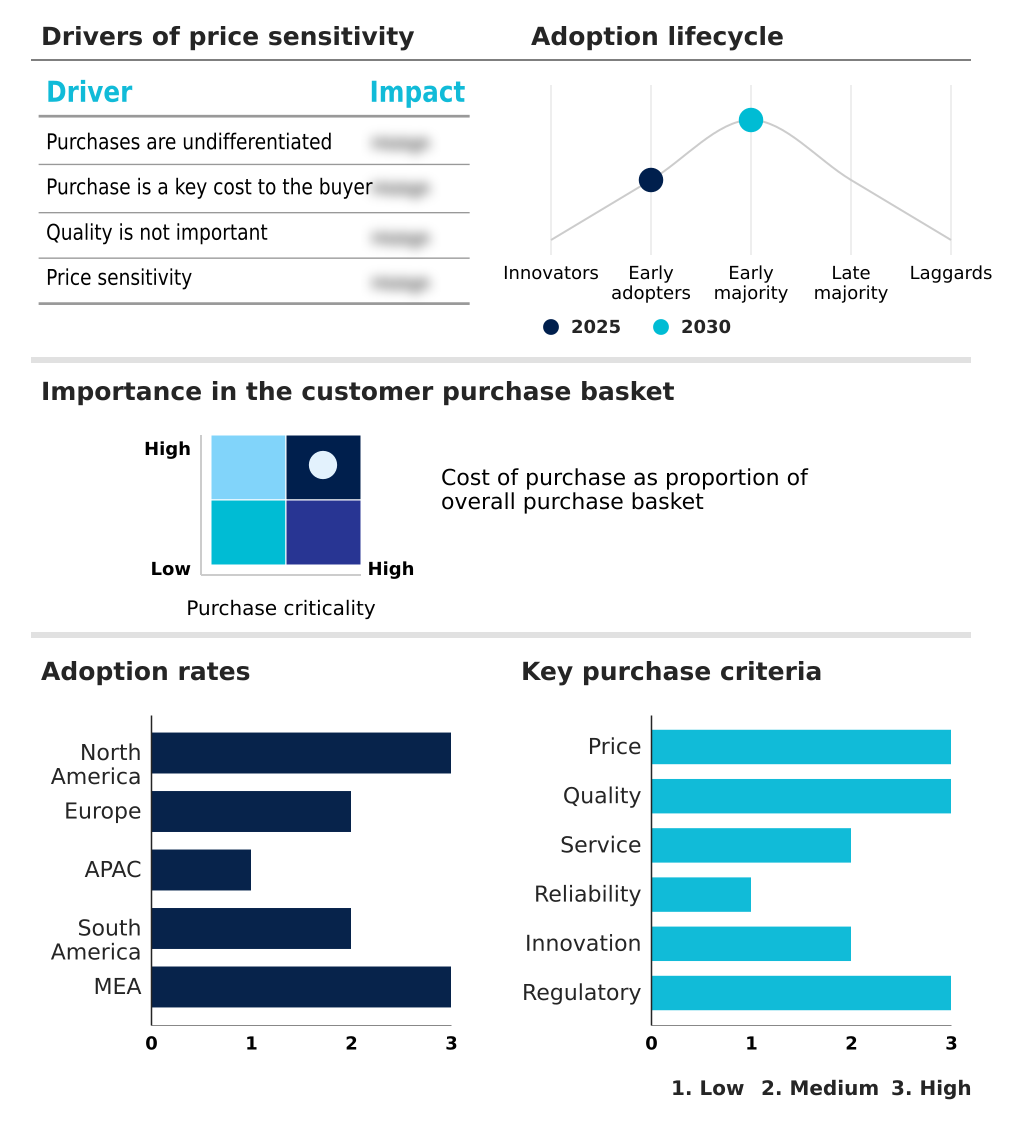
The simulation learning in higher education market forecasting report includes the adoption lifecycle of the market, covering from the innovator’s stage to the laggard’s stage. It focuses on adoption rates in different regions based on penetration. Furthermore, the simulation learning in higher education market report also includes key purchase criteria and drivers of price sensitivity to help companies evaluate and develop their market growth analysis strategies.
Customer Landscape of Simulation Learning In Higher Education Industry
Competitive Landscape
Companies are implementing various strategies, such as strategic alliances, simulation learning in higher education market forecast, partnerships, mergers and acquisitions, geographical expansion, and product/service launches, to enhance their presence in the industry.
ANSYS Inc. - Delivers engineering and physics modeling simulation software, providing tools for real-world product design experimentation within higher education curricula.
The industry research and growth report includes detailed analyses of the competitive landscape of the market and information about key companies, including:
- ANSYS Inc.
- Capsim Management Simulations
- Cesim Oy
- Edufic Digital
- Elevate Healthcare Inc.
- Education Management Solutions
- Forio Corp.
- Gaumard Scientific Co. Inc.
- InfoPro Learning Inc.
- Interpretive Software Inc.
- Labster Group ApS
- Laerdal Medical AS
- McGraw Hill LLC
- Oxford Medical Simulation Ltd.
- Pearson Plc
- DBA SchoolSims
- Simformer Inc
- Skillwell
- StratX Simulations
- VictoryXR Inc.
Qualitative and quantitative analysis of companies has been conducted to help clients understand the wider business environment as well as the strengths and weaknesses of key industry players. Data is qualitatively analyzed to categorize companies as pure play, category-focused, industry-focused, and diversified; it is quantitatively analyzed to categorize companies as dominant, leading, strong, tentative, and weak.
Market Intelligence Radar: High-Impact Developments & Growth Signals
- In the Education Services industry, a significant shift toward competency-based education models is creating demand for verifiable skill assessment tools, directly impacting the simulation learning market in higher education by prioritizing platforms with robust assessment and debriefing features that align with new pedagogical strategy alignment requirements.
- The widespread adoption of learning management systems has established a new baseline for digital infrastructure, with institutions requiring over 95% interoperability with LMS for new software, compelling simulation learning vendors to develop solutions with open APIs for scalable deployment.
- An increasing emphasis on faculty development programs to integrate technology into curricula is accelerating the adoption of complex teaching tools, supporting the simulation learning market as institutions invest in training educators to effectively use virtual reality and scenario-based learning.
- Government and accreditation bodies are implementing policies to enhance educational equity and access, pushing institutions to provide comparable learning experiences for remote and on-campus students, which in turn drives the adoption of cloud-based simulation platforms offering asynchronous learning modules.
Dive into Technavio’s robust research methodology, blending expert interviews, extensive data synthesis, and validated models for unparalleled Simulation Learning In Higher Education Market insights. See full methodology.
| Market Scope | |
|---|---|
| Page number | 275 |
| Base year | 2025 |
| Historic period | 2020-2024 |
| Forecast period | 2026-2030 |
| Growth momentum & CAGR | Accelerate at a CAGR of 23.3% |
| Market growth 2026-2030 | USD 3233.1 million |
| Market structure | Fragmented |
| YoY growth 2025-2026(%) | 18.2% |
| Key countries | US, Canada, Mexico, Germany, UK, France, Italy, Spain, The Netherlands, China, Japan, India, South Korea, Australia, Indonesia, Brazil, Argentina, Colombia, Saudi Arabia, UAE, South Africa, Israel and Turkey |
| Competitive landscape | Leading Companies, Market Positioning of Companies, Competitive Strategies, and Industry Risks |
Research Analyst Overview
- The simulation learning market ecosystem operates on a complex value chain where technology providers, content developers, and academic institutions interact. At its core, specialized software companies develop platforms populated with content from subject matter experts and instructional designers. These solutions are distributed directly or through resellers.
- The adoption process is heavily influenced by simulation technology procurement policies, which often require solutions to offer over 90% interoperability with existing learning management systems (LMS). End-users—students and faculty—drive demand for realistic experiences.
- Accreditation bodies also play a crucial role by setting standards that validate the use of simulation for certification, which can improve the return on investment (ROI) for simulation by up to 20% through reduced clinical placement costs.
What are the Key Data Covered in this Simulation Learning In Higher Education Market Research and Growth Report?
-
What is the expected growth of the Simulation Learning In Higher Education Market between 2026 and 2030?
-
The Simulation Learning In Higher Education Market is expected to grow by USD 3.23 billion during 2026-2030, registering a CAGR of 23.3%. Year-over-year growth in 2026 is estimated at 18.2%%. This acceleration is shaped by increased penetration rate of mobile-based learning, which is intensifying demand across multiple end-use verticals covered in the report.
-
-
What segmentation does the market report cover?
-
The report is segmented by Type (STEM simulation learning, and Non-STEM simulation learning), Deployment (On-premises, and Cloud-based), End-user (Colleges and universities, and Individual users) and Geography (North America, Europe, APAC, South America, Middle East and Africa). Among these, the STEM simulation learning segment is estimated to witness significant growth during the forecast period, driven by rising adoption across key application areas. Each segment includes detailed qualitative and quantitative analysis, along with historical data from 2020-2024 and forecasts through 2030 with year-over-year growth rates.
-
-
Which regions are analyzed in the report?
-
The report covers North America, Europe, APAC, South America and Middle East and Africa. North America is estimated to contribute 37.4% to market growth during the forecast period. Country-level analysis includes US, Canada, Mexico, Germany, UK, France, Italy, Spain, The Netherlands, China, Japan, India, South Korea, Australia, Indonesia, Brazil, Argentina, Colombia, Saudi Arabia, UAE, South Africa, Israel and Turkey, with dedicated market size tables and year-over-year growth for each.
-
-
What are the key growth drivers and market challenges?
-
The primary driver is increased penetration rate of mobile-based learning, which is accelerating investment and industry demand. The main challenge is integration and compatibility issues with simulation software solutions, creating operational barriers for key market participants. The report quantifies the impact of each driver and challenge across 2026 and 2030 with comparative analysis.
-
-
Who are the major players in the Simulation Learning In Higher Education Market?
-
Key vendors include ANSYS Inc., Capsim Management Simulations, Cesim Oy, Edufic Digital, Elevate Healthcare Inc., Education Management Solutions, Forio Corp., Gaumard Scientific Co. Inc., InfoPro Learning Inc., Interpretive Software Inc., Labster Group ApS, Laerdal Medical AS, McGraw Hill LLC, Oxford Medical Simulation Ltd., Pearson Plc, DBA SchoolSims, Simformer Inc, Skillwell, StratX Simulations and VictoryXR Inc.. The report provides qualitative and quantitative analysis categorizing companies as dominant, leading, strong, tentative, and weak based on their market positioning. Company profiles include business segment analysis, SWOT assessment, key offerings, and recent strategic developments.
-
Market Research Insights
- The competitive landscape of the global simulation learning market in higher education is highly fragmented, with the top five vendors accounting for less than 35% of the total market share. This structure fosters intense innovation as companies compete on technological capabilities and content depth.
- For example, CAE Healthcare and Laerdal Medical AS have focused on developing AI-driven patient simulators and integrated debriefing solutions, addressing the demand for more realistic and automated assessment tools. These actions reflect a broader industry shift toward data-driven learning, where platforms that provide real-time performance analytics can command a 15% price premium. Key vendors such as ANSYS Inc.
- and Labster Group ApS are expanding their cloud-based offerings to improve accessibility. However, vendors face the persistent challenge of overcoming high initial implementation costs, prompting a move toward subscription-based models.
We can help! Our analysts can customize this simulation learning in higher education market research report to meet your requirements.
 RIA -
RIA - 
