Smart Doorbell Market Analysis, Size, and Forecast 2026-2030: North America (US, Canada, and Mexico), Europe (Germany, France, and UK), APAC (China, Japan, and India), South America (Brazil, Argentina, and Colombia), Middle East and Africa (Saudi Arabia, UAE, and South Africa), and Rest of World (ROW)

Smart Doorbell Market Analysis, Size, and Forecast 2026-2030:
North America (US, Canada, and Mexico), Europe (Germany, France, and UK), APAC (China, Japan, and India), South America (Brazil, Argentina, and Colombia), Middle East and Africa (Saudi Arabia, UAE, and South Africa), and Rest of World (ROW)

Published: Mar 2026 309 Pages SKU: IRTNTR40574

Market Overview at a Glance

$9.15 B
Market Opportunity
22.1%
CAGR 2025 - 2030
35.7%
North America Growth
$3.92 B
Wired segment 2024

Smart Doorbell Market Size 2026-2030
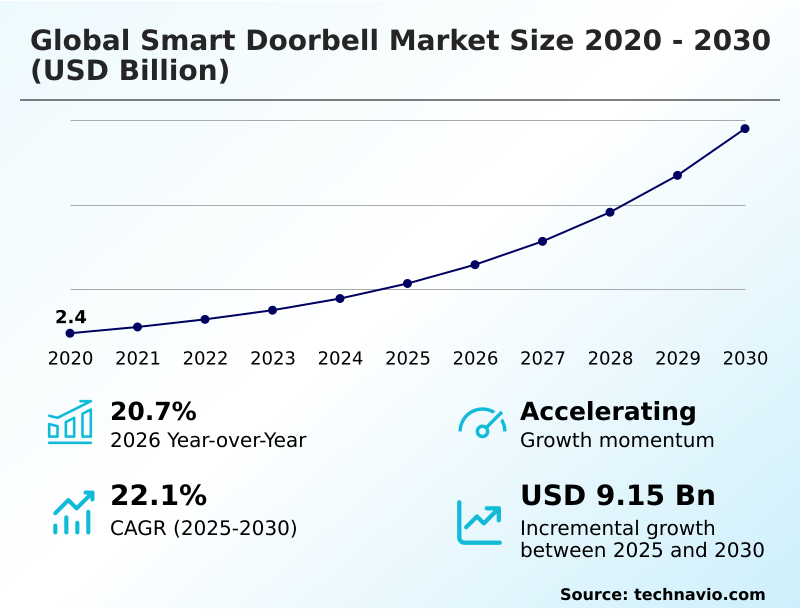
The smart doorbell market size is valued to increase by USD 9.15 billion, at a CAGR of 22.1% from 2025 to 2030. Technological innovation and artificial intelligence integration will drive the smart doorbell market.

Major Market Trends & Insights

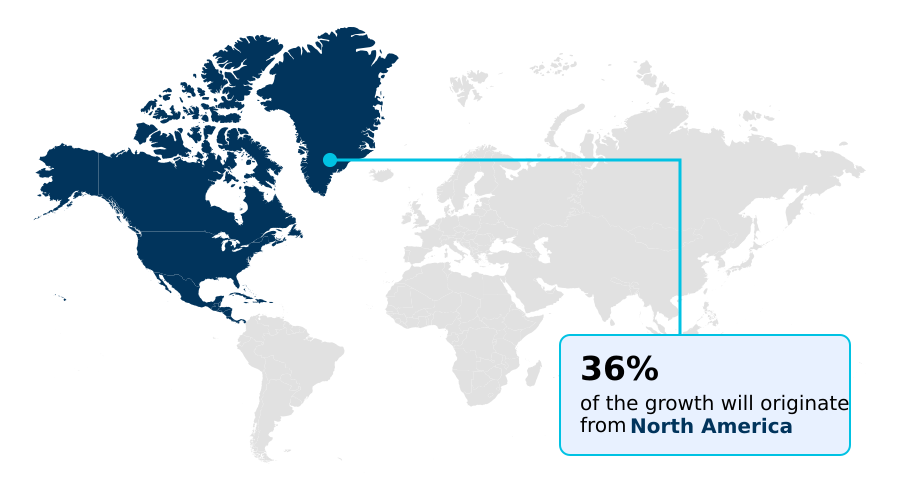
  • North America dominated the market and accounted for a 35.7% growth during the forecast period.
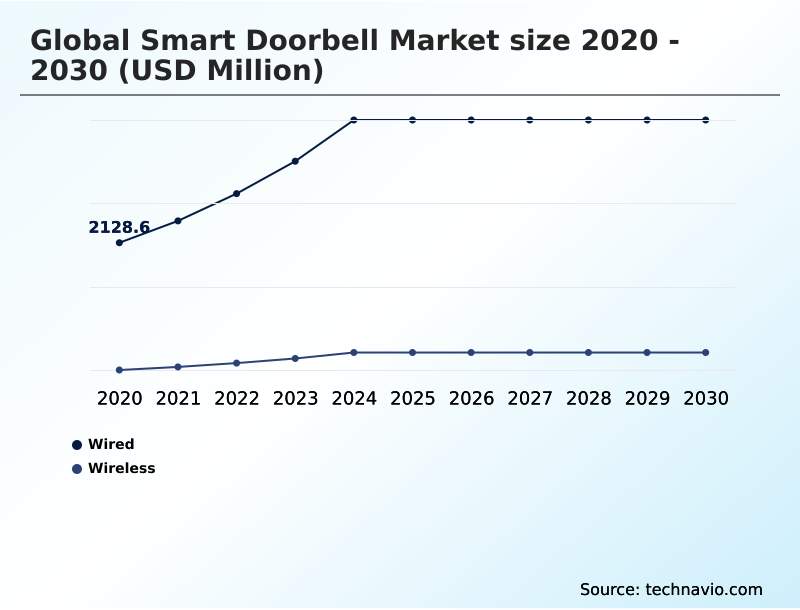
  • By Type - Wired segment was valued at USD 3.92 billion in 2024
  • By Distribution Channel - Offline segment accounted for the largest market revenue share in 2024

Market Size & Forecast

  • Market Opportunities: USD 12.09 billion
  • Market Future Opportunities: USD 9.15 billion
  • CAGR from 2025 to 2030 : 22.1%

Market Summary

  • The smart doorbell market is undergoing significant evolution, driven by consumer demand for integrated and intelligent home security solutions. Central to this growth is the increasing sophistication of AI, which enables features beyond simple motion alerts, such as familiar face detection and package delivery notifications. This shift transforms the doorbell from a passive device into an active entry management tool.
  • A key trend is the move toward greater interoperability within the broader home security ecosystem integration, allowing seamless communication with smart locks, lights, and alarms. For instance, property management firms are now deploying these systems across entire residential complexes to streamline visitor access, monitor common areas, and provide tenants with a unified security experience, all managed through a central platform.
  • However, this increased connectivity also raises challenges related to data privacy and the need for robust cybersecurity measures. As the technology matures, the market is characterized by a focus on enhancing user experience through high-definition video streaming, reducing false alerts, and offering flexible data storage options.

What will be the Size of the Smart Doorbell Market during the forecast period?

Get Key Insights on Market Forecast (PDF) Request Free Sample

How is the Smart Doorbell Market Segmented?

The smart doorbell industry research report provides comprehensive data (region-wise segment analysis), with forecasts and estimates in "USD million" for the period 2026-2030, as well as historical data from 2020-2024 for the following segments.

  • Type
    • Wired
    • Wireless
  • Distribution channel
    • Offline
    • Online
  • Component
    • Camera
    • Motion sensor
    • Microphone and speaker
    • Connectivity module
    • Storage
  • End-user
    • Residential
    • Commercial
  • Geography
    • North America
      • US
      • Canada
      • Mexico
    • Europe
      • Germany
      • France
      • UK
    • APAC
      • China
      • Japan
      • India
    • South America
      • Brazil
      • Argentina
      • Colombia
    • Middle East and Africa
      • Saudi Arabia
      • UAE
      • South Africa
    • Rest of World (ROW)

By Type Insights

The wired segment is estimated to witness significant growth during the forecast period.

The wired segment forms a foundational component of the market, prized for its reliability in delivering consistent power and data for a unified security system.

These devices are integral to intelligent entry management, particularly in multi-dwelling security applications where integration with building management systems is critical.

Users prioritize this technology for its ability to support high-bandwidth features like high-resolution 4k sensors and high dynamic range imaging without interruption, ensuring clear head-to-toe video coverage.

Security is paramount, with end-to-end video encryption and multi-factor authentication access becoming standard for robust residential access control.

Advanced passive infrared (pir) sensors contribute to a 70% reduction in false motion alerts, enhancing the reliability of real-time video alerts and overall system performance.

Request Free Sample

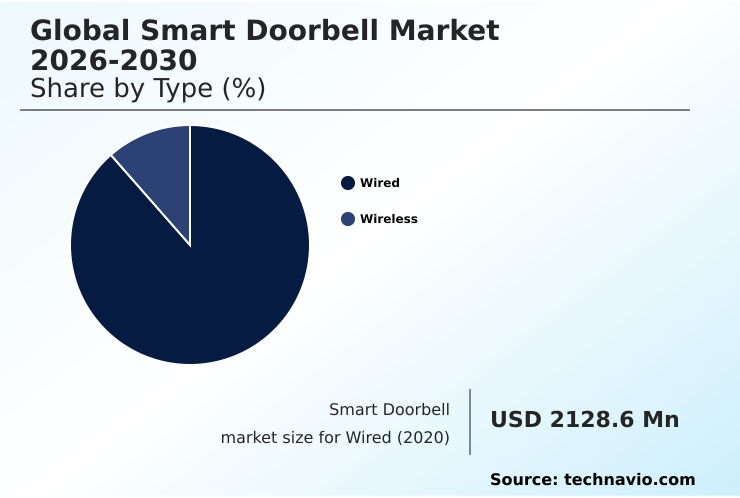
The Wired segment was valued at USD 3.92 billion in 2024 and showed a gradual increase during the forecast period.

Request Free Sample

Regional Analysis

North America is estimated to contribute 35.7% to the growth of the global market during the forecast period.Technavio’s analysts have elaborately explained the regional trends and drivers that shape the market during the forecast period.

See How Smart Doorbell Market Demand is Rising in North America Request Free Sample

The geographic landscape is led by North America, which accounts for over 35% of incremental market growth, driven by strong home security ecosystem integration and adoption within smart community developments.

In this region, advanced features such as dual-camera doorbell systems and radar-based motion detection are standard. APAC is the fastest-growing region, with a focus on connected entry monitoring for high-density multi-dwelling security applications and smart building ecosystems.

Innovations like infrared night vision technology and clear two-way audio communication are critical in all regions, while emerging markets are adopting connected home safety platforms.

In some technologically advanced areas, 3d motion detection mapping and voice print identification security are being integrated with professional monitoring service offerings, improving verified response accuracy by 25%.

Market Dynamics

Our researchers analyzed the data with 2025 as the base year, along with the key drivers, trends, and challenges. A holistic analysis of drivers will help companies refine their marketing strategies to gain a competitive advantage.

  • Navigating the smart doorbell market requires careful consideration of core functionalities and long-term value. A primary decision for property managers and homeowners is the wired vs wireless smart doorbell debate, where installation simplicity is weighed against uninterrupted power.
  • For those prioritizing data control, a smart doorbell with local storage is preferable to subscription models, making a smart doorbell with no subscription a key search criterion. Advanced capabilities are increasingly standard, with the best smart doorbell for package detection often utilizing AI and a head-to-toe view.
  • The demand for a high-resolution 4k smart doorbell is rising for superior clarity, while a video doorbell with facial recognition adds a layer of personalized security. For specialized needs, an AI-powered doorbell for elderly care offers peace of mind, and a dual-camera smart doorbell review can highlight its effectiveness in eliminating blind spots.
  • Ecosystem compatibility is crucial, leading buyers to seek a matter-enabled video doorbell camera for future-proofing or a device with seamless smart doorbell integration with alexa. Hardware choices like a solar-powered wireless video doorbell or a smart doorbell for cold weather climates address specific environmental and installation challenges.
  • For businesses, deploying a solar-powered wireless video doorbell can reduce installation time by over 60% compared to wired counterparts, significantly lowering labor costs across multiple sites. Decisions extend to using a smart doorbell for remote deliveries and choosing privacy-focused smart doorbell options with smart doorbell with end-to-end encryption.
  • Whether for a single residence or for smart doorbell for apartment buildings, the process of installing a smart doorbell system now involves a complex matrix of features, from a smart doorbell with thermal imaging sensor to a smart doorbell with customizable faceplates.

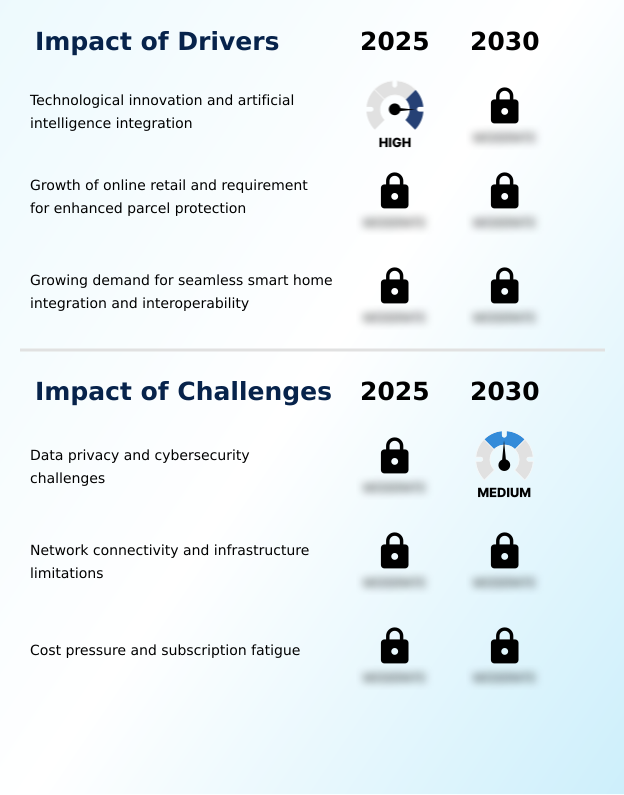
What are the key market drivers leading to the rise in the adoption of Smart Doorbell Industry?

  • Technological innovation, particularly the integration of artificial intelligence, serves as a key driver for market growth.

  • Market expansion is heavily influenced by seamless smart home integration, facilitated by emerging smart home automation protocols. The adoption of matter protocol interoperability is critical, simplifying connectivity and creating a more cohesive automated home security system.
  • Demand for enhanced parcel protection and porch piracy prevention is a primary driver, addressed by features like intelligent motion detection and specific package detection alerts.
  • Advancements in edge computing for AI enable sophisticated on-device processing for AI-driven motion recognition and facial recognition technology, reducing latency for remote visitor monitoring by up to 60%.
  • This shift ensures faster, more accurate visitor and delivery alerts, directly improving user experience and security effectiveness.

What are the market trends shaping the Smart Doorbell Industry?

  • A significant trend shaping the market is the transition toward renewable energy solutions. This includes the growing adoption of solar charging hardware for enhanced sustainability and convenience.

  • The market is evolving with a focus on sustainable home technology, driven by solar charging hardware integration and low-power chipset design to reduce energy consumption. Architectural integration solutions are gaining prominence, with modular doorbell design and interchangeable faceplate options allowing devices to blend into home aesthetics. Concurrently, doorbells are becoming proactive monitoring tools for personal well-being.
  • The integration of advanced biometric recognition and gait analysis for recognition supports assisted living monitoring, improving safety for vulnerable residents. New capabilities like thermal imaging for detection and pet-friendly security features further expand use cases, while a focus on user-controlled data access addresses privacy demands, with some systems processing biometric data locally to reduce external exposure by 90%.

What challenges does the Smart Doorbell Industry face during its growth?

  • Concerns regarding data privacy and cybersecurity present a significant challenge to the industry's growth trajectory.

  • Significant challenges stem from network infrastructure limitations, as high-definition video streaming demands robust wireless network connectivity. Even with dual-band wi-fi support, poor home networks account for over 40% of performance issues in consumer-focused home security systems. The reliance on battery-powered doorbell operation creates concerns over longevity, although new energy-efficient components are extending life cycles.
  • Furthermore, consumer pushback against subscription-based cloud services is driving demand for local data storage solutions. Achieving data privacy compliance and meeting cybersecurity certification standards adds complexity and cost, while poorly configured customizable motion zones can lead to alert fatigue, undermining the effectiveness of both security and contactless entry solutions.

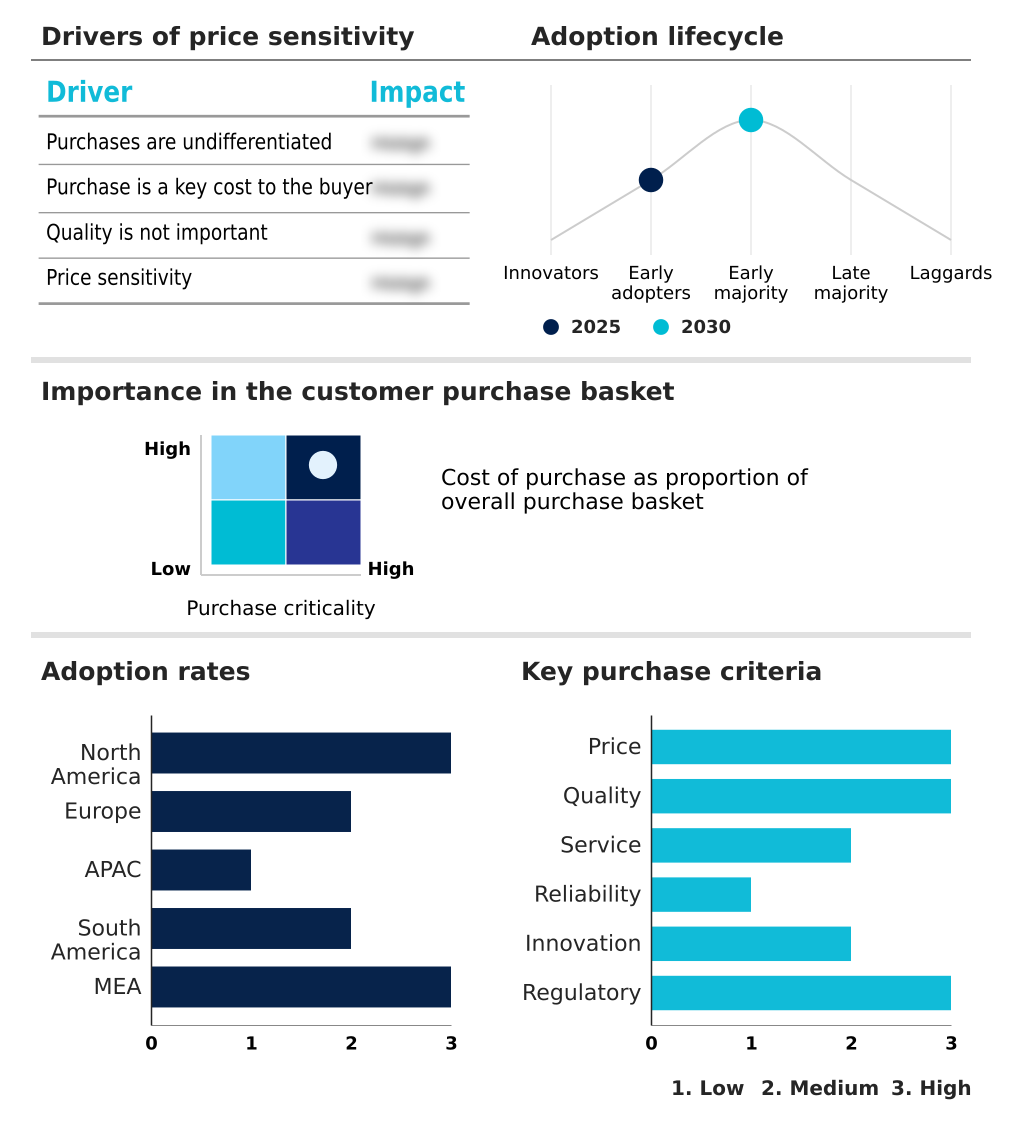
Exclusive Technavio Analysis on Customer Landscape

The smart doorbell market forecasting report includes the adoption lifecycle of the market, covering from the innovator’s stage to the laggard’s stage. It focuses on adoption rates in different regions based on penetration. Furthermore, the smart doorbell market report also includes key purchase criteria and drivers of price sensitivity to help companies evaluate and develop their market growth analysis strategies.

Customer Landscape of Smart Doorbell Industry

Competitive Landscape

Companies are implementing various strategies, such as strategic alliances, smart doorbell market forecast, partnerships, mergers and acquisitions, geographical expansion, and product/service launches, to enhance their presence in the industry.

Aeotec Group GmbH - Offerings combine AI-based motion recognition and cloud-enabled monitoring, integrating with smart displays to enhance connected home security and unify security systems.

The industry research and growth report includes detailed analyses of the competitive landscape of the market and information about key companies, including:

  • Aeotec Group GmbH
  • Aiphone Co. Ltd.
  • Anker Innovations Co. Ltd.
  • Arlo Technologies Inc.
  • ASSA ABLOY AB
  • Google LLC
  • Honeywell International Inc.
  • Legrand SA
  • Night Owl SP LLC
  • NRG Energy Inc.
  • Owlet Home LLC
  • Panasonic Holdings Corp.
  • Ring LLC
  • Simplisafe Inc.
  • SkyBell Technologies Inc.
  • Soliom Inc.
  • TP Link Corp. Ltd.
  • VStarcam
  • Xiaomi Corp.
  • Zmodo Technology Corp. Ltd.

Qualitative and quantitative analysis of companies has been conducted to help clients understand the wider business environment as well as the strengths and weaknesses of key industry players. Data is qualitatively analyzed to categorize companies as pure play, category-focused, industry-focused, and diversified; it is quantitatively analyzed to categorize companies as dominant, leading, strong, tentative, and weak.

Recent Development and News in Smart doorbell market

  • In August, 2024, Anker Innovations Co. Ltd. introduced a device that features two cameras to eliminate blind spots near the doorstep and ensure packages are monitored at all times.
  • In October, 2024, TP Link Corp. Ltd. launched a smart doorbell that supports a wide field of view and local storage via a memory card to reduce the reliance on cloud services.
  • In January, 2025, Nest expanded its customization options by introducing interchangeable faceplates made from premium materials, allowing for personalization based on architectural style.
  • In March, 2025, August Home integrated its smart locks with doorbell cameras to allow for a more seamless entry process for trusted visitors.

Dive into Technavio’s robust research methodology, blending expert interviews, extensive data synthesis, and validated models for unparalleled Smart Doorbell Market insights. See full methodology.

Market Scope
Page number 309
Base year 2025
Historic period 2020-2024
Forecast period 2026-2030
Growth momentum & CAGR Accelerate at a CAGR of 22.1%
Market growth 2026-2030 USD 9149.8 million
Market structure Fragmented
YoY growth 2025-2026(%) 20.7%
Key countries US, Canada, Mexico, Germany, France, UK, Italy, The Netherlands, Spain, China, Japan, India, South Korea, Australia, Indonesia, Brazil, Argentina, Colombia, Saudi Arabia, UAE, South Africa, Israel and Turkey
Competitive landscape Leading Companies, Market Positioning of Companies, Competitive Strategies, and Industry Risks

Request Free Sample

Research Analyst Overview

  • The smart doorbell market is defined by rapid technological convergence, creating a highly competitive environment. Core capabilities center on high-definition video streaming and two-way audio communication, which are enhanced by infrared night vision technology and high dynamic range imaging from high-resolution 4k sensors.
  • The key differentiator is intelligence, driven by intelligent motion detection, facial recognition technology, and increasingly, advanced biometric recognition like voice print identification security and gait analysis for recognition. Hardware innovations include dual-camera doorbell systems for head-to-toe video coverage and modular doorbell design with interchangeable faceplate options.
  • Devices leverage edge computing for AI to deliver real-time video alerts, including visitor and delivery alerts and package detection alerts, with customizable motion zones to reduce false positives. Power solutions are diversifying through battery-powered doorbell operation, solar charging hardware integration, low-power chipset design, and energy-efficient components.
  • For connectivity, dual-band Wi-Fi support is standard, while matter protocol interoperability is key for home security ecosystem integration within an automated home security system. Security is fortified with end-to-end video encryption and multi-factor authentication access.
  • The integration of radar-based motion detection with 3d motion detection mapping represents the cutting edge, offering contextual awareness that improves alert accuracy by over 98% in complex environments. Boardroom decisions increasingly weigh the high cost of data privacy compliance against the competitive advantage of offering such sophisticated proactive monitoring tools and local data storage solutions.

What are the Key Data Covered in this Smart Doorbell Market Research and Growth Report?

  • What is the expected growth of the Smart Doorbell Market between 2026 and 2030?

    • USD 9.15 billion, at a CAGR of 22.1%

  • What segmentation does the market report cover?

    • The report is segmented by Type (Wired, and Wireless), Distribution Channel (Offline, and Online), Component (Camera, Motion sensor, Microphone and speaker, Connectivity module, and Storage), End-user (Residential, and Commercial) and Geography (North America, Europe, APAC, South America, Middle East and Africa)

  • Which regions are analyzed in the report?

    • North America, Europe, APAC, South America and Middle East and Africa

  • What are the key growth drivers and market challenges?

    • Technological innovation and artificial intelligence integration, Data privacy and cybersecurity challenges

  • Who are the major players in the Smart Doorbell Market?

    • Aeotec Group GmbH, Aiphone Co. Ltd., Anker Innovations Co. Ltd., Arlo Technologies Inc., ASSA ABLOY AB, Google LLC, Honeywell International Inc., Legrand SA, Night Owl SP LLC, NRG Energy Inc., Owlet Home LLC, Panasonic Holdings Corp., Ring LLC, Simplisafe Inc., SkyBell Technologies Inc., Soliom Inc., TP Link Corp. Ltd., VStarcam, Xiaomi Corp. and Zmodo Technology Corp. Ltd.

Market Research Insights

  • The market's dynamics are shaped by a push for more proactive and intelligent security solutions. The integration of AI-driven motion recognition has become a key differentiator, with advanced systems reducing false positive alerts by over 70%, thereby enhancing user trust. Demand for enhanced parcel protection is driving innovation in proactive monitoring tools, which now offer specialized alerts for deliveries.
  • This focus on intelligent features addresses key consumer pain points, while the move toward seamless smart home integration broadens the utility of these devices beyond simple security. Performance metrics are critical, as the adoption of edge processing has cut notification latency by up to 50% in certain devices, a vital improvement for real-time security events.
  • However, the industry continues to navigate consumer sentiment around subscription-based cloud services, with a notable portion of the market preferring devices with local storage.

We can help! Our analysts can customize this smart doorbell market research report to meet your requirements.

Get in touch

1. Executive Summary

1.1 Market overview

Executive Summary - Chart on Market Overview
Executive Summary - Data Table on Market Overview
Executive Summary - Chart on Global Market Characteristics
Executive Summary - Chart on Market by Geography
Executive Summary - Chart on Market Segmentation by Type
Executive Summary - Chart on Market Segmentation by Distribution Channel
Executive Summary - Chart on Market Segmentation by Component
Executive Summary - Chart on Market Segmentation by End-user
Executive Summary - Chart on Incremental Growth
Executive Summary - Data Table on Incremental Growth
Executive Summary - Chart on Company Market Positioning

2. Technavio Analysis

2.1 Analysis of price sensitivity, lifecycle, customer purchase basket, adoption rates, and purchase criteria

2.2 Criticality of inputs and Factors of differentiation

Chart on Overview on criticality of inputs and factors of differentiation

2.3 Factors of disruption

Chart on Overview on factors of disruption

2.4 Impact of drivers and challenges

Chart on Impact of drivers and challenges in 2025 and 2030

3. Market Landscape

3.1 Market ecosystem

Chart on Parent Market
Data Table on - Parent Market

3.2 Market characteristics

Chart on Market characteristics analysis

3.3 Value chain analysis

Chart on Value chain analysis

4. Market Sizing

4.1 Market definition

Data Table on Offerings of companies included in the market definition

4.2 Market segment analysis

Market segments

4.3 Market size 2025

4.4 Market outlook: Forecast for 2025-2030

Chart on Global - Market size and forecast 2025-2030 ($ million)
Data Table on Global - Market size and forecast 2025-2030 ($ million)
Chart on Global Market: Year-over-year growth 2025-2030 (%)
Data Table on Global Market: Year-over-year growth 2025-2030 (%)

5. Historic Market Size

5.1 Global Smart Doorbell Market 2020 - 2024

Historic Market Size - Data Table on Global Smart Doorbell Market 2020 - 2024 ($ million)

5.2 Type segment analysis 2020 - 2024

Historic Market Size - Type Segment 2020 - 2024 ($ million)

5.3 Distribution Channel segment analysis 2020 - 2024

Historic Market Size - Distribution Channel Segment 2020 - 2024 ($ million)

5.4 Component segment analysis 2020 - 2024

Historic Market Size - Component Segment 2020 - 2024 ($ million)

5.5 End-user segment analysis 2020 - 2024

Historic Market Size - End-user Segment 2020 - 2024 ($ million)

5.6 Geography segment analysis 2020 - 2024

Historic Market Size - Geography Segment 2020 - 2024 ($ million)

5.7 Country segment analysis 2020 - 2024

Historic Market Size - Country Segment 2020 - 2024 ($ million)

6. Qualitative Analysis

6.1 Impact of AI on Global Smart Doorbell Market

7. Five Forces Analysis

7.1 Five forces summary

Five forces analysis - Comparison between 2025 and 2030

7.2 Bargaining power of buyers

Bargaining power of buyers - Impact of key factors 2025 and 2030

7.3 Bargaining power of suppliers

Bargaining power of suppliers - Impact of key factors in 2025 and 2030

7.4 Threat of new entrants

Threat of new entrants - Impact of key factors in 2025 and 2030

7.5 Threat of substitutes

Threat of substitutes - Impact of key factors in 2025 and 2030

7.6 Threat of rivalry

Threat of rivalry - Impact of key factors in 2025 and 2030

7.7 Market condition

Chart on Market condition - Five forces 2025 and 2030

8. Market Segmentation by Type

8.1 Market segments

Chart on Type - Market share 2025-2030 (%)
Data Table on Type - Market share 2025-2030 (%)

8.2 Comparison by Type

Chart on Comparison by Type
Data Table on Comparison by Type

8.3 Wired - Market size and forecast 2025-2030

Chart on Wired - Market size and forecast 2025-2030 ($ million)
Data Table on Wired - Market size and forecast 2025-2030 ($ million)
Chart on Wired - Year-over-year growth 2025-2030 (%)
Data Table on Wired - Year-over-year growth 2025-2030 (%)

8.4 Wireless - Market size and forecast 2025-2030

Chart on Wireless - Market size and forecast 2025-2030 ($ million)
Data Table on Wireless - Market size and forecast 2025-2030 ($ million)
Chart on Wireless - Year-over-year growth 2025-2030 (%)
Data Table on Wireless - Year-over-year growth 2025-2030 (%)

8.5 Market opportunity by Type

Market opportunity by Type ($ million)
Data Table on Market opportunity by Type ($ million)

9. Market Segmentation by Distribution Channel

9.1 Market segments

Chart on Distribution Channel - Market share 2025-2030 (%)
Data Table on Distribution Channel - Market share 2025-2030 (%)

9.2 Comparison by Distribution Channel

Chart on Comparison by Distribution Channel
Data Table on Comparison by Distribution Channel

9.3 Offline - Market size and forecast 2025-2030

Chart on Offline - Market size and forecast 2025-2030 ($ million)
Data Table on Offline - Market size and forecast 2025-2030 ($ million)
Chart on Offline - Year-over-year growth 2025-2030 (%)
Data Table on Offline - Year-over-year growth 2025-2030 (%)

9.4 Online - Market size and forecast 2025-2030

Chart on Online - Market size and forecast 2025-2030 ($ million)
Data Table on Online - Market size and forecast 2025-2030 ($ million)
Chart on Online - Year-over-year growth 2025-2030 (%)
Data Table on Online - Year-over-year growth 2025-2030 (%)

9.5 Market opportunity by Distribution Channel

Market opportunity by Distribution Channel ($ million)
Data Table on Market opportunity by Distribution Channel ($ million)

10. Market Segmentation by Component

10.1 Market segments

Chart on Component - Market share 2025-2030 (%)
Data Table on Component - Market share 2025-2030 (%)

10.2 Comparison by Component

Chart on Comparison by Component
Data Table on Comparison by Component

10.3 Camera - Market size and forecast 2025-2030

Chart on Camera - Market size and forecast 2025-2030 ($ million)
Data Table on Camera - Market size and forecast 2025-2030 ($ million)
Chart on Camera - Year-over-year growth 2025-2030 (%)
Data Table on Camera - Year-over-year growth 2025-2030 (%)

10.4 Motion sensor - Market size and forecast 2025-2030

Chart on Motion sensor - Market size and forecast 2025-2030 ($ million)
Data Table on Motion sensor - Market size and forecast 2025-2030 ($ million)
Chart on Motion sensor - Year-over-year growth 2025-2030 (%)
Data Table on Motion sensor - Year-over-year growth 2025-2030 (%)

10.5 Microphone and speaker - Market size and forecast 2025-2030

Chart on Microphone and speaker - Market size and forecast 2025-2030 ($ million)
Data Table on Microphone and speaker - Market size and forecast 2025-2030 ($ million)
Chart on Microphone and speaker - Year-over-year growth 2025-2030 (%)
Data Table on Microphone and speaker - Year-over-year growth 2025-2030 (%)

10.6 Connectivity module - Market size and forecast 2025-2030

Chart on Connectivity module - Market size and forecast 2025-2030 ($ million)
Data Table on Connectivity module - Market size and forecast 2025-2030 ($ million)
Chart on Connectivity module - Year-over-year growth 2025-2030 (%)
Data Table on Connectivity module - Year-over-year growth 2025-2030 (%)

10.7 Storage - Market size and forecast 2025-2030

Chart on Storage - Market size and forecast 2025-2030 ($ million)
Data Table on Storage - Market size and forecast 2025-2030 ($ million)
Chart on Storage - Year-over-year growth 2025-2030 (%)
Data Table on Storage - Year-over-year growth 2025-2030 (%)

10.8 Market opportunity by Component

Market opportunity by Component ($ million)
Data Table on Market opportunity by Component ($ million)

11. Market Segmentation by End-user

11.1 Market segments

Chart on End-user - Market share 2025-2030 (%)
Data Table on End-user - Market share 2025-2030 (%)

11.2 Comparison by End-user

Chart on Comparison by End-user
Data Table on Comparison by End-user

11.3 Residential - Market size and forecast 2025-2030

Chart on Residential - Market size and forecast 2025-2030 ($ million)
Data Table on Residential - Market size and forecast 2025-2030 ($ million)
Chart on Residential - Year-over-year growth 2025-2030 (%)
Data Table on Residential - Year-over-year growth 2025-2030 (%)

11.4 Commercial - Market size and forecast 2025-2030

Chart on Commercial - Market size and forecast 2025-2030 ($ million)
Data Table on Commercial - Market size and forecast 2025-2030 ($ million)
Chart on Commercial - Year-over-year growth 2025-2030 (%)
Data Table on Commercial - Year-over-year growth 2025-2030 (%)

11.5 Market opportunity by End-user

Market opportunity by End-user ($ million)
Data Table on Market opportunity by End-user ($ million)

12. Customer Landscape

12.1 Customer landscape overview

Analysis of price sensitivity, lifecycle, customer purchase basket, adoption rates, and purchase criteria

13. Geographic Landscape

13.1 Geographic segmentation

Chart on Market share by geography 2025-2030 (%)
Data Table on Market share by geography 2025-2030 (%)

13.2 Geographic comparison

Chart on Geographic comparison
Data Table on Geographic comparison

13.3 North America - Market size and forecast 2025-2030

Chart on North America - Market size and forecast 2025-2030 ($ million)
Data Table on North America - Market size and forecast 2025-2030 ($ million)
Chart on North America - Year-over-year growth 2025-2030 (%)
Data Table on North America - Year-over-year growth 2025-2030 (%)
Chart on Regional Comparison - North America
Data Table on Regional Comparison - North America

13.3.1 US - Market size and forecast 2025-2030

Chart on US - Market size and forecast 2025-2030 ($ million)
Data Table on US - Market size and forecast 2025-2030 ($ million)
Chart on US - Year-over-year growth 2025-2030 (%)
Data Table on US - Year-over-year growth 2025-2030 (%)

13.3.2 Canada - Market size and forecast 2025-2030

Chart on Canada - Market size and forecast 2025-2030 ($ million)
Data Table on Canada - Market size and forecast 2025-2030 ($ million)
Chart on Canada - Year-over-year growth 2025-2030 (%)
Data Table on Canada - Year-over-year growth 2025-2030 (%)

13.3.3 Mexico - Market size and forecast 2025-2030

Chart on Mexico - Market size and forecast 2025-2030 ($ million)
Data Table on Mexico - Market size and forecast 2025-2030 ($ million)
Chart on Mexico - Year-over-year growth 2025-2030 (%)
Data Table on Mexico - Year-over-year growth 2025-2030 (%)

13.4 Europe - Market size and forecast 2025-2030

Chart on Europe - Market size and forecast 2025-2030 ($ million)
Data Table on Europe - Market size and forecast 2025-2030 ($ million)
Chart on Europe - Year-over-year growth 2025-2030 (%)
Data Table on Europe - Year-over-year growth 2025-2030 (%)
Chart on Regional Comparison - Europe
Data Table on Regional Comparison - Europe

13.4.1 Germany - Market size and forecast 2025-2030

Chart on Germany - Market size and forecast 2025-2030 ($ million)
Data Table on Germany - Market size and forecast 2025-2030 ($ million)
Chart on Germany - Year-over-year growth 2025-2030 (%)
Data Table on Germany - Year-over-year growth 2025-2030 (%)

13.4.2 France - Market size and forecast 2025-2030

Chart on France - Market size and forecast 2025-2030 ($ million)
Data Table on France - Market size and forecast 2025-2030 ($ million)
Chart on France - Year-over-year growth 2025-2030 (%)
Data Table on France - Year-over-year growth 2025-2030 (%)

13.4.3 UK - Market size and forecast 2025-2030

Chart on UK - Market size and forecast 2025-2030 ($ million)
Data Table on UK - Market size and forecast 2025-2030 ($ million)
Chart on UK - Year-over-year growth 2025-2030 (%)
Data Table on UK - Year-over-year growth 2025-2030 (%)

13.4.4 Italy - Market size and forecast 2025-2030

Chart on Italy - Market size and forecast 2025-2030 ($ million)
Data Table on Italy - Market size and forecast 2025-2030 ($ million)
Chart on Italy - Year-over-year growth 2025-2030 (%)
Data Table on Italy - Year-over-year growth 2025-2030 (%)

13.4.5 The Netherlands - Market size and forecast 2025-2030

Chart on The Netherlands - Market size and forecast 2025-2030 ($ million)
Data Table on The Netherlands - Market size and forecast 2025-2030 ($ million)
Chart on The Netherlands - Year-over-year growth 2025-2030 (%)
Data Table on The Netherlands - Year-over-year growth 2025-2030 (%)

13.4.6 Spain - Market size and forecast 2025-2030

Chart on Spain - Market size and forecast 2025-2030 ($ million)
Data Table on Spain - Market size and forecast 2025-2030 ($ million)
Chart on Spain - Year-over-year growth 2025-2030 (%)
Data Table on Spain - Year-over-year growth 2025-2030 (%)

13.5 APAC - Market size and forecast 2025-2030

Chart on APAC - Market size and forecast 2025-2030 ($ million)
Data Table on APAC - Market size and forecast 2025-2030 ($ million)
Chart on APAC - Year-over-year growth 2025-2030 (%)
Data Table on APAC - Year-over-year growth 2025-2030 (%)
Chart on Regional Comparison - APAC
Data Table on Regional Comparison - APAC

13.5.1 China - Market size and forecast 2025-2030

Chart on China - Market size and forecast 2025-2030 ($ million)
Data Table on China - Market size and forecast 2025-2030 ($ million)
Chart on China - Year-over-year growth 2025-2030 (%)
Data Table on China - Year-over-year growth 2025-2030 (%)

13.5.2 Japan - Market size and forecast 2025-2030

Chart on Japan - Market size and forecast 2025-2030 ($ million)
Data Table on Japan - Market size and forecast 2025-2030 ($ million)
Chart on Japan - Year-over-year growth 2025-2030 (%)
Data Table on Japan - Year-over-year growth 2025-2030 (%)

13.5.3 India - Market size and forecast 2025-2030

Chart on India - Market size and forecast 2025-2030 ($ million)
Data Table on India - Market size and forecast 2025-2030 ($ million)
Chart on India - Year-over-year growth 2025-2030 (%)
Data Table on India - Year-over-year growth 2025-2030 (%)

13.5.4 South Korea - Market size and forecast 2025-2030

Chart on South Korea - Market size and forecast 2025-2030 ($ million)
Data Table on South Korea - Market size and forecast 2025-2030 ($ million)
Chart on South Korea - Year-over-year growth 2025-2030 (%)
Data Table on South Korea - Year-over-year growth 2025-2030 (%)

13.5.5 Australia - Market size and forecast 2025-2030

Chart on Australia - Market size and forecast 2025-2030 ($ million)
Data Table on Australia - Market size and forecast 2025-2030 ($ million)
Chart on Australia - Year-over-year growth 2025-2030 (%)
Data Table on Australia - Year-over-year growth 2025-2030 (%)

13.5.6 Indonesia - Market size and forecast 2025-2030

Chart on Indonesia - Market size and forecast 2025-2030 ($ million)
Data Table on Indonesia - Market size and forecast 2025-2030 ($ million)
Chart on Indonesia - Year-over-year growth 2025-2030 (%)
Data Table on Indonesia - Year-over-year growth 2025-2030 (%)

13.6 South America - Market size and forecast 2025-2030

Chart on South America - Market size and forecast 2025-2030 ($ million)
Data Table on South America - Market size and forecast 2025-2030 ($ million)
Chart on South America - Year-over-year growth 2025-2030 (%)
Data Table on South America - Year-over-year growth 2025-2030 (%)
Chart on Regional Comparison - South America
Data Table on Regional Comparison - South America

13.6.1 Brazil - Market size and forecast 2025-2030

Chart on Brazil - Market size and forecast 2025-2030 ($ million)
Data Table on Brazil - Market size and forecast 2025-2030 ($ million)
Chart on Brazil - Year-over-year growth 2025-2030 (%)
Data Table on Brazil - Year-over-year growth 2025-2030 (%)

13.6.2 Argentina - Market size and forecast 2025-2030

Chart on Argentina - Market size and forecast 2025-2030 ($ million)
Data Table on Argentina - Market size and forecast 2025-2030 ($ million)
Chart on Argentina - Year-over-year growth 2025-2030 (%)
Data Table on Argentina - Year-over-year growth 2025-2030 (%)

13.6.3 Colombia - Market size and forecast 2025-2030

Chart on Colombia - Market size and forecast 2025-2030 ($ million)
Data Table on Colombia - Market size and forecast 2025-2030 ($ million)
Chart on Colombia - Year-over-year growth 2025-2030 (%)
Data Table on Colombia - Year-over-year growth 2025-2030 (%)

13.7 Middle East and Africa - Market size and forecast 2025-2030

Chart on Middle East and Africa - Market size and forecast 2025-2030 ($ million)
Data Table on Middle East and Africa - Market size and forecast 2025-2030 ($ million)
Chart on Middle East and Africa - Year-over-year growth 2025-2030 (%)
Data Table on Middle East and Africa - Year-over-year growth 2025-2030 (%)
Chart on Regional Comparison - Middle East and Africa
Data Table on Regional Comparison - Middle East and Africa

13.7.1 Saudi Arabia - Market size and forecast 2025-2030

Chart on Saudi Arabia - Market size and forecast 2025-2030 ($ million)
Data Table on Saudi Arabia - Market size and forecast 2025-2030 ($ million)
Chart on Saudi Arabia - Year-over-year growth 2025-2030 (%)
Data Table on Saudi Arabia - Year-over-year growth 2025-2030 (%)

13.7.2 UAE - Market size and forecast 2025-2030

Chart on UAE - Market size and forecast 2025-2030 ($ million)
Data Table on UAE - Market size and forecast 2025-2030 ($ million)
Chart on UAE - Year-over-year growth 2025-2030 (%)
Data Table on UAE - Year-over-year growth 2025-2030 (%)

13.7.3 South Africa - Market size and forecast 2025-2030

Chart on South Africa - Market size and forecast 2025-2030 ($ million)
Data Table on South Africa - Market size and forecast 2025-2030 ($ million)
Chart on South Africa - Year-over-year growth 2025-2030 (%)
Data Table on South Africa - Year-over-year growth 2025-2030 (%)

13.7.4 Israel - Market size and forecast 2025-2030

Chart on Israel - Market size and forecast 2025-2030 ($ million)
Data Table on Israel - Market size and forecast 2025-2030 ($ million)
Chart on Israel - Year-over-year growth 2025-2030 (%)
Data Table on Israel - Year-over-year growth 2025-2030 (%)

13.7.5 Turkey - Market size and forecast 2025-2030

Chart on Turkey - Market size and forecast 2025-2030 ($ million)
Data Table on Turkey - Market size and forecast 2025-2030 ($ million)
Chart on Turkey - Year-over-year growth 2025-2030 (%)
Data Table on Turkey - Year-over-year growth 2025-2030 (%)

13.8 Market opportunity by geography

Market opportunity by geography ($ million)
Data Tables on Market opportunity by geography ($ million)

14. Drivers, Challenges, and Opportunity

14.1 Market drivers

Technological innovation and artificial intelligence integration
Growth of online retail and requirement for enhanced parcel protection
Growing demand for seamless smart home integration and interoperability

14.2 Market challenges

Data privacy and cybersecurity challenges
Network connectivity and infrastructure limitations
Cost pressure and subscription fatigue

14.3 Impact of drivers and challenges

Impact of drivers and challenges in 2025 and 2030

14.4 Market opportunities

Transition toward renewable energy and solar charging hardware
Advanced biometric recognition and specialized health monitoring features
Aesthetic refinement and architectural integration through modular design

15. Competitive Landscape

15.1 Overview

15.2

Overview on criticality of inputs and factors of differentiation

15.3 Landscape disruption

Overview on factors of disruption

15.4 Industry risks

Impact of key risks on business

16. Competitive Analysis

16.1 Companies profiled

Companies covered

16.2 Company ranking index

16.3 Market positioning of companies

Matrix on companies position and classification

16.4 Aeotec Group GmbH

Aeotec Group GmbH - Overview
Aeotec Group GmbH - Product / Service
Aeotec Group GmbH - Key offerings
SWOT

16.5 Aiphone Co. Ltd.

Aiphone Co. Ltd. - Overview
Aiphone Co. Ltd. - Product / Service
Aiphone Co. Ltd. - Key offerings
SWOT

16.6 Anker Innovations Co. Ltd.

Anker Innovations Co. Ltd. - Overview
Anker Innovations Co. Ltd. - Product / Service
Anker Innovations Co. Ltd. - Key offerings
SWOT

16.7 Arlo Technologies Inc.

Arlo Technologies Inc. - Overview
Arlo Technologies Inc. - Product / Service
Arlo Technologies Inc. - Key offerings
SWOT

16.8 ASSA ABLOY AB

ASSA ABLOY AB - Overview
ASSA ABLOY AB - Business segments
ASSA ABLOY AB - Key news
ASSA ABLOY AB - Key offerings
ASSA ABLOY AB - Segment focus
SWOT

16.9 Google LLC

Google LLC - Overview
Google LLC - Product / Service
Google LLC - Key offerings
SWOT

16.10 Honeywell International Inc.

Honeywell International Inc. - Overview
Honeywell International Inc. - Business segments
Honeywell International Inc. - Key news
Honeywell International Inc. - Key offerings
Honeywell International Inc. - Segment focus
SWOT

16.11 Legrand SA

Legrand SA - Overview
Legrand SA - Business segments
Legrand SA - Key news
Legrand SA - Key offerings
Legrand SA - Segment focus
SWOT

16.12 Night Owl SP LLC

Night Owl SP LLC - Overview
Night Owl SP LLC - Product / Service
Night Owl SP LLC - Key offerings
SWOT

16.13 Panasonic Holdings Corp.

Panasonic Holdings Corp. - Overview
Panasonic Holdings Corp. - Business segments
Panasonic Holdings Corp. - Key news
Panasonic Holdings Corp. - Key offerings
Panasonic Holdings Corp. - Segment focus
SWOT

16.14 Ring LLC

Ring LLC - Overview
Ring LLC - Product / Service
Ring LLC - Key offerings
SWOT

16.15 Simplisafe Inc.

Simplisafe Inc. - Overview
Simplisafe Inc. - Product / Service
Simplisafe Inc. - Key offerings
SWOT

16.16 SkyBell Technologies Inc.

SkyBell Technologies Inc. - Overview
SkyBell Technologies Inc. - Product / Service
SkyBell Technologies Inc. - Key offerings
SWOT

16.17 TP Link Corp. Ltd.

TP Link Corp. Ltd. - Overview
TP Link Corp. Ltd. - Product / Service
TP Link Corp. Ltd. - Key offerings
SWOT

16.18 Xiaomi Corp.

Xiaomi Corp. - Overview
Xiaomi Corp. - Business segments
Xiaomi Corp. - Key news
Xiaomi Corp. - Key offerings
Xiaomi Corp. - Segment focus
SWOT

17. Appendix

17.1 Scope of the report

Market definition
Objectives
Notes and caveats

17.2 Inclusions and exclusions checklist

Inclusions checklist
Exclusions checklist

17.3 Currency conversion rates for US$

17.4 Research methodology

17.5 Data procurement

Information sources

17.6 Data validation

17.7 Validation techniques employed for market sizing

17.8 Data synthesis

17.9 360 degree market analysis

17.10 List of abbreviations

Research Methodology

Technavio presents a detailed picture of the market by way of study, synthesis, and summation of data from multiple sources. The analysts have presented the various facets of the market with a particular focus on identifying the key industry influencers. The data thus presented is comprehensive, reliable, and the result of extensive research, both primary and secondary.

INFORMATION SOURCES

Primary sources

  • Manufacturers and suppliers
  • Channel partners
  • Industry experts
  • Strategic decision makers

Secondary sources

  • Industry journals and periodicals
  • Government data
  • Financial reports of key industry players
  • Historical data
  • Press releases

DATA ANALYSIS

Data Synthesis

  • Collation of data
  • Estimation of key figures
  • Analysis of derived insights

Data Validation

  • Triangulation with data models
  • Reference against proprietary databases
  • Corroboration with industry experts

REPORT WRITING

Qualitative

  • Market drivers
  • Market challenges
  • Market trends
  • Five forces analysis

Quantitative

  • Market size and forecast
  • Market segmentation
  • Geographical insights
  • Competitive landscape

Interested in this report?

Get your sample now to see our research methodology and insights!

Download Now

Frequently Asked Questions

Smart Doorbell market growth will increase by USD 9149.8 million during 2026-2030.

The Smart Doorbell market is expected to grow at a CAGR of 22.1% during 2026-2030.

Smart Doorbell market is segmented by Type (Wired, Wireless) Distribution channel (Offline, Online) Component (Camera, Motion sensor, Microphone and speaker, Connectivity module, Storage) End-user (Residential, Commercial)

Aeotec Group GmbH, Aiphone Co. Ltd., Anker Innovations Co. Ltd., Arlo Technologies Inc., ASSA ABLOY AB, Google LLC, Honeywell International Inc., Legrand SA, Night Owl SP LLC, NRG Energy Inc., Owlet Home LLC, Panasonic Holdings Corp., Ring LLC, Simplisafe Inc., SkyBell Technologies Inc., Soliom Inc., TP Link Corp. Ltd., VStarcam, Xiaomi Corp., Zmodo Technology Corp. Ltd. are a few of the key vendors in the Smart Doorbell market.

North America will register the highest growth rate of 35.7% among the other regions. Therefore, the Smart Doorbell market in North America is expected to garner significant business opportunities for the vendors during the forecast period.

US, Canada, Mexico, Germany, France, UK, Italy, The Netherlands, Spain, China, Japan, India, South Korea, Australia, Indonesia, Brazil, Argentina, Colombia, Saudi Arabia, UAE, South Africa, Israel, Turkey

  • Technological innovation and artificial intelligence integration is the driving factor this market.

The Smart Doorbell market vendors should focus on grabbing business opportunities from the Type segment as it accounted for the largest market share in the base year.
RIA - Research AI Assistant
Ask RIA