
Smart Education Market Size 2026-2030
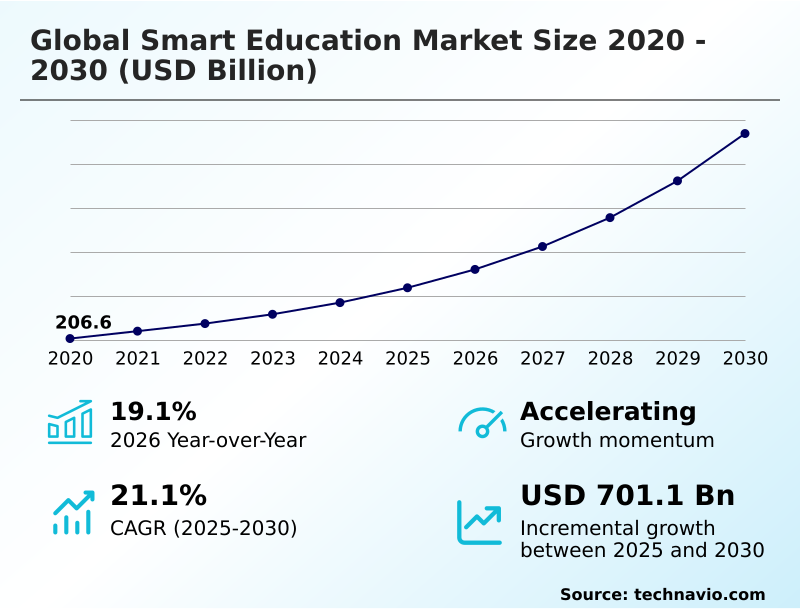
The smart education market size is valued to increase by USD 701.1 billion, at a CAGR of 21.1% from 2025 to 2030. Proliferation of generative artificial intelligence and adaptive learning ecosystems will drive the smart education market.
Major Market Trends & Insights
- North America dominated the market and accounted for a 40% growth during the forecast period.
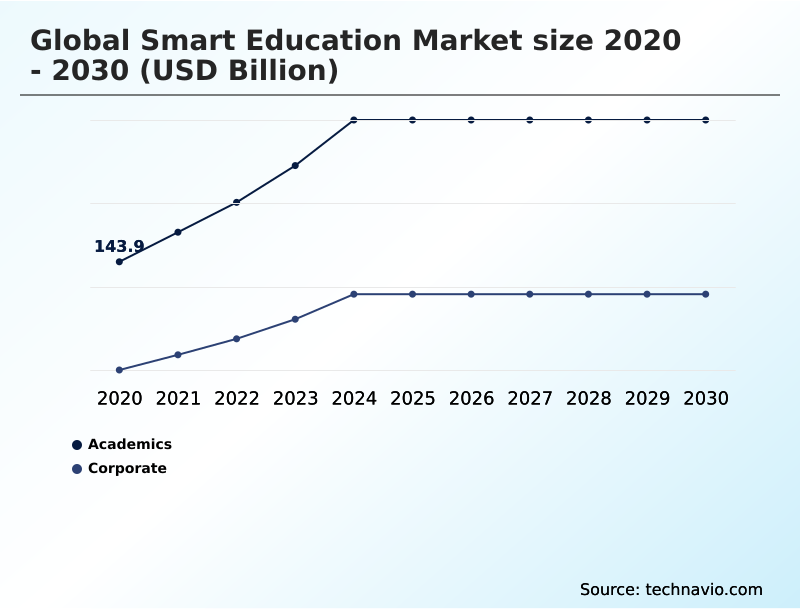
- By End-user - Academics segment was valued at USD 250.3 billion in 2024
- By Component - Service segment accounted for the largest market revenue share in 2024
Market Size & Forecast
- Market Opportunities: USD 931.9 billion
- Market Future Opportunities: USD 701.1 billion
- CAGR from 2025 to 2030 : 21.1%
Market Summary
- The smart education market is undergoing a significant transformation, moving beyond basic content digitization to create intelligent, responsive learning environments. This evolution is driven by the integration of artificial intelligence and machine learning, which enable hyper-personalized educational experiences tailored to individual learner needs.
- Instead of a uniform approach, modern platforms analyze student performance data in real-time to adjust curriculum difficulty and provide targeted remedial resources. This shift is redefining the role of educators, empowering them as facilitators of knowledge rather than just content deliverers.
- For instance, in a corporate training scenario, an adaptive platform can map an employee's existing skills against future business needs and automatically generate a personalized upskilling pathway, enhancing workforce agility. The convergence of hardware, like interactive displays, and cloud-based software creates immersive educational settings.
- However, the persistent digital divide and concerns around data privacy remain significant issues, influencing the development and deployment of these advanced technological solutions across both academic and corporate sectors.
What will be the Size of the Smart Education Market during the forecast period?
Get Key Insights on Market Forecast (PDF) Get Free Sample
How is the Smart Education Market Segmented?
The smart education industry research report provides comprehensive data (region-wise segment analysis), with forecasts and estimates in "USD billion" for the period 2026-2030, as well as historical data from 2020-2024 for the following segments.
- End-user
- Academics
- Corporate
- Component
- Service
- Software
- Hardware
- Learning method
- Blended learning
- Collaborative learning
- Virtual instructor led training
- Others
- Geography
- North America
- US
- Canada
- Mexico
- Europe
- Germany
- UK
- France
- APAC
- China
- India
- Japan
- South America
- Brazil
- Argentina
- Colombia
- Middle East and Africa
- Saudi Arabia
- UAE
- South Africa
- Rest of World (ROW)
- North America
By End-user Insights
The academics segment is estimated to witness significant growth during the forecast period.
The academics segment is rapidly evolving from simple digitization toward deploying intelligent, adaptive learning ecosystems. K-12 and higher education institutions are now prioritizing platforms using curriculum design automation and neural processing units to provide personalized instruction.
This includes the adoption of edge-computing capable devices that support offline AI functionality, which has been shown to improve student engagement by up to 25% in under-connected districts.
The focus is on integrating AI-driven features like socratic-style tutoring bots directly into learning tools interoperability (LTI) compliant systems.
This trend reflects a strategic shift toward using multi-agent AI architectures and extended reality to enhance pedagogical outcomes rather than just managing administrative tasks within student information systems.
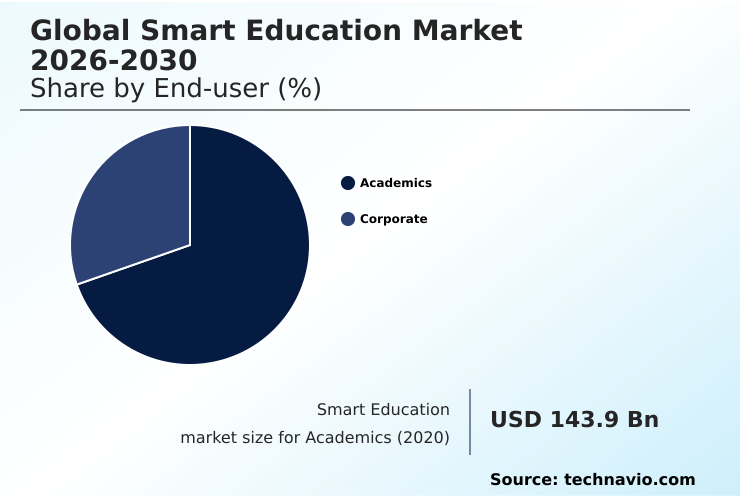
The Academics segment was valued at USD 250.3 billion in 2024 and showed a gradual increase during the forecast period.
Regional Analysis
North America is estimated to contribute 40% to the growth of the global market during the forecast period.Technavio’s analysts have elaborately explained the regional trends and drivers that shape the market during the forecast period.

See How Smart Education Market Demand is Rising in North America Get Free Sample
The market landscape shows distinct regional priorities. North America, representing nearly 40% of the incremental growth, focuses on predictive analytics and AI-powered coaching tools to improve student retention.
Europe prioritizes AI governance and compliance with data protection mandates, favoring solutions that offer robust managed services.
Meanwhile, APAC is the fastest-growing region, with an expansion rate over 21%, driven by mobile-first strategies and the deployment of interactive flat panels and cloud-based learning. This region leverages technology to bridge educational gaps.
South America and the Middle East and Africa are adopting adaptive learning paths and virtual collaboration tools to upskill their workforces, with a focus on scalable, cost-effective platforms that can operate in diverse infrastructure environments.
Market Dynamics
Our researchers analyzed the data with 2025 as the base year, along with the key drivers, trends, and challenges. A holistic analysis of drivers will help companies refine their marketing strategies to gain a competitive advantage.
- Strategic decision-making in the smart education sector now revolves around assessing the ROI of smart education tools, a process complicated by diverse technological pathways. The role of AI in corporate learning is expanding, with a significant focus on reducing the administrative burden for educators and leveraging skills analytics for corporate upskilling.
- Platforms are increasingly evaluated on their ability to provide AI for personalized learning paths and their effectiveness in using generative AI for curriculum development. A key industry goal is implementing AI-powered student retention strategies. The market is also heavily investing in immersive learning for complex procedures, primarily through VR for vocational training simulations.
- The move toward spatial computing in technical education is creating new opportunities but also highlighting the challenges of the digital divide in education. On the governance side, the impact of data privacy on edtech is forcing vendors to prioritize ethical AI in student assessment and focus on securing student data in cloud platforms.
- The transition from LMS to TXP is well underway, with a push for interoperability in micro-credentialing ecosystems. This includes exploring the use of blockchain for learning records. Poorly integrated systems can lead to significant user friction, with some studies showing teacher stress levels increasing by more than 50% compared to those using unified, AI-native LXP for skills intelligence.
- Ultimately, success hinges on proving the value of agentic AI in learning management and demonstrating clear blended learning model effectiveness analytics.
What are the key market drivers leading to the rise in the adoption of Smart Education Industry?
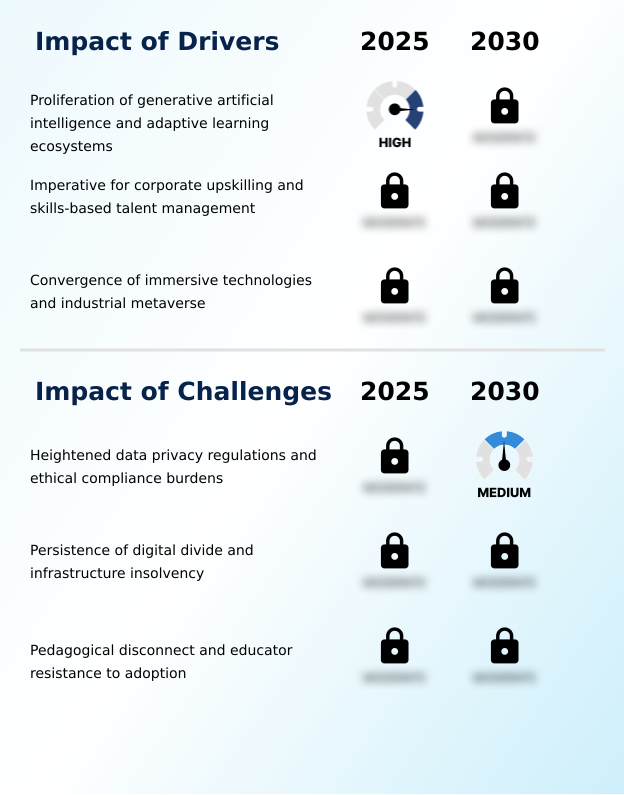
- The proliferation of generative artificial intelligence and the development of adaptive learning ecosystems are key drivers for market growth.
- The market's acceleration is primarily fueled by the deep integration of generative artificial intelligence into student engagement platforms and learning management systems. These AI-native learning ecosystems offer personalized instruction at scale, using large language models for remedial content generation.
- This is leading to a 40% reduction in administrative workload for educators. Another key driver is the corporate pivot to skills-based organizational planning, creating strong demand for skills intelligence platforms that facilitate internal mobility.
- The maturation of immersive technologies, including augmented reality, is also critical, enabling physics-accurate 3D simulations in digital twin environments. This democratizes access to high-risk training, with adoption increasing by over 25% in technical fields.
What are the market trends shaping the Smart Education Industry?
- A key market trend is the transition from generative artificial intelligence to agentic AI. These autonomous systems are now being integrated into learning ecosystems.
- The evolution from generative to agentic AI systems is a defining trend, where autonomous agents execute multi-step workflows, moving beyond simple content creation. This shift to human-in-the-loop AI architectures promises to improve instructor efficiency by over 35%.
- The mainstreaming of spatial computing and immersive technologies like virtual reality is transforming vocational training, with some programs reporting a 20% increase in knowledge retention. Concurrently, the rise of interoperable micro-credentialing ecosystems, often using blockchain ledger technologies, is creating a unified data fabric between learning and employment.
- This unbundling of traditional degrees addresses the demand for skills-based analytics and verifiable proof of competency, supported by talent experience platforms and digital badging, reshaping how value is measured in education.
What challenges does the Smart Education Industry face during its growth?
- Heightened data privacy regulations and the increasing burden of ethical compliance present a key challenge to industry growth.
- Significant challenges persist, stemming from the conflict between data analytics needs and stringent data privacy regulations. The use of biometric monitoring systems and tools prone to algorithmic bias faces intense scrutiny, leading to development delays that can be 50% longer in regulated markets. This necessitates heavy investment in data sovereign infrastructure and algorithmic transparency.
- The pervasive digital divide also impedes growth, as the total cost of ownership for advanced hardware proves prohibitive for many institutions. Furthermore, a pedagogical disconnect results in educator resistance; with over 60% of teachers reporting increased stress from disjointed platforms, the lack of professional development for proactive teaching assistants remains a critical barrier to adoption.
Exclusive Technavio Analysis on Customer Landscape
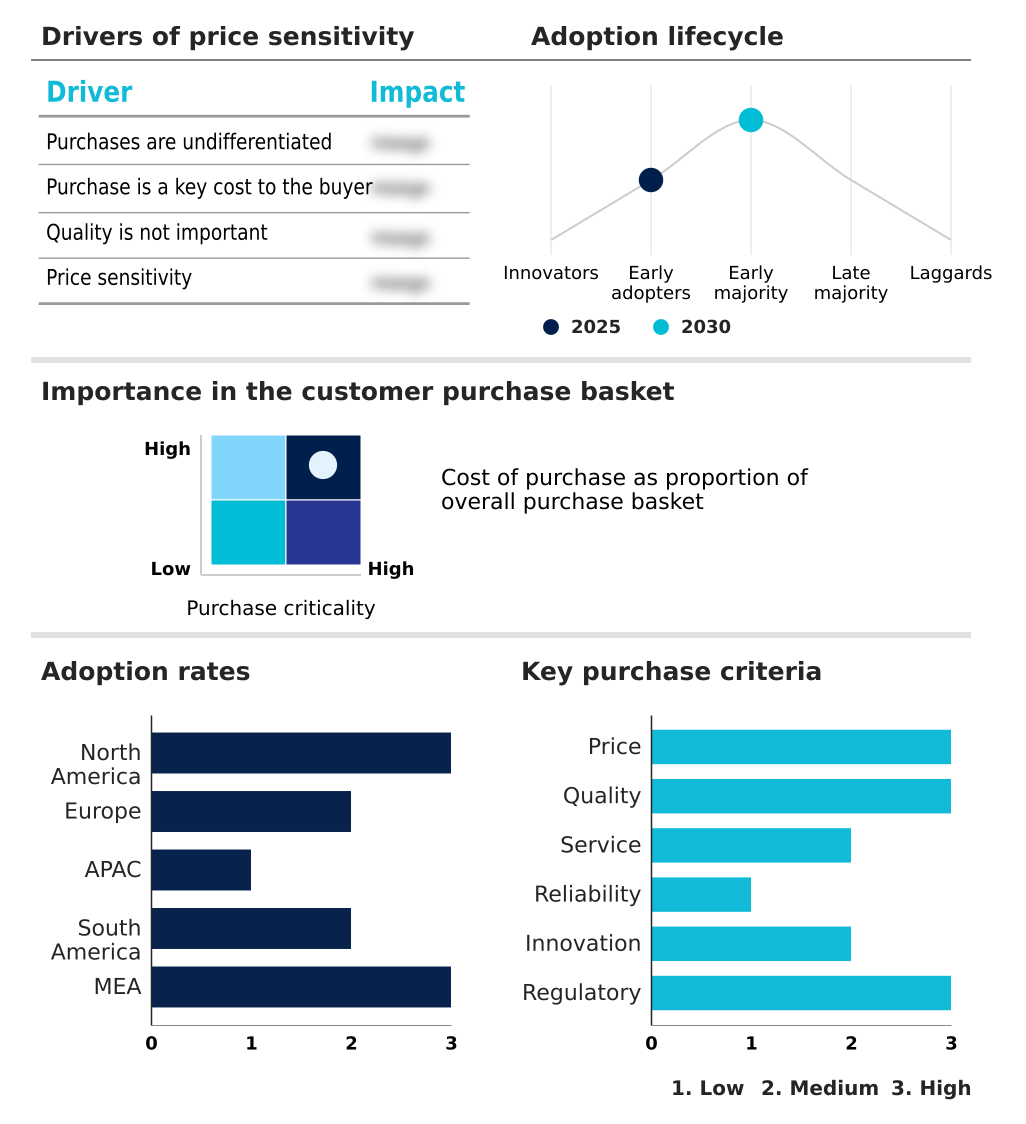
The smart education market forecasting report includes the adoption lifecycle of the market, covering from the innovator’s stage to the laggard’s stage. It focuses on adoption rates in different regions based on penetration. Furthermore, the smart education market report also includes key purchase criteria and drivers of price sensitivity to help companies evaluate and develop their market growth analysis strategies.
Customer Landscape of Smart Education Industry
Competitive Landscape
Companies are implementing various strategies, such as strategic alliances, smart education market forecast, partnerships, mergers and acquisitions, geographical expansion, and product/service launches, to enhance their presence in the industry.
Allen Communication Learning - Offerings include custom digital learning and training solutions, designed to deliver personalized and engaging educational experiences for various organizational needs.
The industry research and growth report includes detailed analyses of the competitive landscape of the market and information about key companies, including:
- Allen Communication Learning
- Adobe Inc.
- Blackboard Inc.
- Cengage Learning Inc.
- Cisco Systems Inc.
- Cornerstone OnDemand Inc.
- D2L Corp.
- Ellucian Co.
- Google LLC
- Instructure Holdings Inc.
- McGraw Hill LLC
- Microsoft Corp.
- Oracle Corp.
- Paradiso Solutions
- Pearson Plc
- Promethean World Ltd.
- Skillsoft Corp.
- Docebo Inc.
Qualitative and quantitative analysis of companies has been conducted to help clients understand the wider business environment as well as the strengths and weaknesses of key industry players. Data is qualitatively analyzed to categorize companies as pure play, category-focused, industry-focused, and diversified; it is quantitatively analyzed to categorize companies as dominant, leading, strong, tentative, and weak.
Recent Development and News in Smart education market
- In August 2025, Cornerstone OnDemand Inc. launched its Galaxy Skills Graph update, an AI-powered ontology designed to dynamically update skill definitions and match internal talent with projects based on verified proficiency.
- In June 2025, Unity Software Inc. launched the Unity Education Spatial Layer, a platform designed as a foundational engine for creating physics-accurate 3D learning simulations for technical education without requiring coding expertise.
- In April 2025, Anthology Inc. launched Anthology Autonomous, a module for its Blackboard Learn ecosystem that introduces AI agents capable of autonomously building course structures and performing initial grading of student essays.
- In March 2025, Instructure Holdings, Inc. announced the general availability of its Canvas Intelligent Agent suite, which uses generative AI to help instructional designers create course structures, lesson plans, and student-facing Socratic bots.
Dive into Technavio’s robust research methodology, blending expert interviews, extensive data synthesis, and validated models for unparalleled Smart Education Market insights. See full methodology.
| Market Scope | |
|---|---|
| Page number | 295 |
| Base year | 2025 |
| Historic period | 2020-2024 |
| Forecast period | 2026-2030 |
| Growth momentum & CAGR | Accelerate at a CAGR of 21.1% |
| Market growth 2026-2030 | USD 701.1 billion |
| Market structure | Fragmented |
| YoY growth 2025-2026(%) | 19.1% |
| Key countries | US, Canada, Mexico, Germany, UK, France, Italy, Spain, The Netherlands, China, India, Japan, South Korea, Australia, Indonesia, Brazil, Argentina, Colombia, Saudi Arabia, UAE, South Africa, Egypt and Qatar |
| Competitive landscape | Leading Companies, Market Positioning of Companies, Competitive Strategies, and Industry Risks |
Research Analyst Overview
- The market is undergoing a fundamental re-architecture, moving toward AI-native learning ecosystems. The integration of generative artificial intelligence and large language models into learning management systems is no longer a novelty but a core expectation. This powers everything from curriculum design automation to socratic-style tutoring bots.
- We are seeing a transition toward skills-based organizational planning, driving demand for skills intelligence platforms and tools that support interoperable micro-credentialing and digital badging. This is underpinned by sophisticated skills-based analytics.
- On the technology front, the convergence of virtual reality, augmented reality, and mixed reality into cohesive extended reality experiences is creating new paradigms for training, supported by physics-accurate 3D simulations in digital twin environments. This move into spatial computing is being accelerated by hardware with dedicated neural processing units.
- The deployment of autonomous agents and multi-agent AI architectures to handle multi-step workflows signifies a shift to agentic AI systems. However, this progress is tempered by boardroom-level concerns over data privacy regulations, which demand algorithmic transparency and place restrictions on biometric monitoring systems.
- Platforms must now also support learning and employment records, acting as comprehensive learning experience platforms or talent experience platforms. This evolution is evident across all hardware, from interactive flat panels to personal devices, as the industry uses predictive analytics to improve outcomes, with some tools reducing content creation time by over 90%.
- The rise of virtual labs completes this transformative picture.
What are the Key Data Covered in this Smart Education Market Research and Growth Report?
-
What is the expected growth of the Smart Education Market between 2026 and 2030?
-
USD 701.1 billion, at a CAGR of 21.1%
-
-
What segmentation does the market report cover?
-
The report is segmented by End-user (Academics, and Corporate), Component (Service, Software, and Hardware), Learning Method (Blended learning, Collaborative learning, Virtual instructor led training, and Others) and Geography (North America, Europe, APAC, South America, Middle East and Africa)
-
-
Which regions are analyzed in the report?
-
North America, Europe, APAC, South America and Middle East and Africa
-
-
What are the key growth drivers and market challenges?
-
Proliferation of generative artificial intelligence and adaptive learning ecosystems, Heightened data privacy regulations and ethical compliance burdens
-
-
Who are the major players in the Smart Education Market?
-
Allen Communication Learning, Adobe Inc., Blackboard Inc., Cengage Learning Inc., Cisco Systems Inc., Cornerstone OnDemand Inc., D2L Corp., Ellucian Co., Google LLC, Instructure Holdings Inc., McGraw Hill LLC, Microsoft Corp., Oracle Corp., Paradiso Solutions, Pearson Plc, Promethean World Ltd., Skillsoft Corp. and Docebo Inc.
-
Market Research Insights
- The market's dynamism is driven by a strategic shift toward measurable outcomes and efficiency. The adoption of AI-powered coaching tools has been shown to increase learner engagement by over 25% compared to traditional online modules. Concurrently, platforms that automate administrative tasks are reducing teacher workload by up to 40%, allowing educators to focus on high-value mentorship.
- This focus on efficiency is critical, as institutions implementing unified student information systems with embedded analytics report a 15% higher student retention rate. The move toward skills-based hiring is further fueling demand for platforms that provide verifiable digital badging and real-time assessment.
- Solutions that support hyflex course designs and offer robust AI governance are gaining a significant competitive advantage in this evolving landscape.
We can help! Our analysts can customize this smart education market research report to meet your requirements.
 RIA -
RIA - 
