Smart Machines Market Size 2024-2028
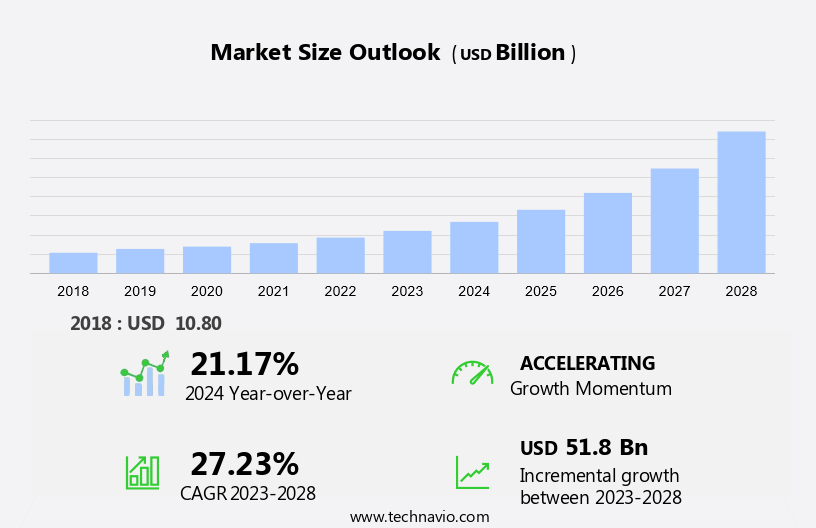
The smart machines market size is forecast to increase by USD 51.8 billion at a CAGR of 27.23% between 2023 and 2028.
- The market is experiencing significant growth, driven by several key factors. One major trend is the changing global labor force, with an increasing emphasis on automation and digitalization to increase efficiency and productivity. Another significant factor is the emergence of the Internet of Things (IoT), which enables machines to connect and communicate with each other and their environments, leading to improved performance and predictive maintenance. However, the high cost of deployment and integration of smart machines remains a challenge for many organizations, particularly for smaller businesses and those in developing countries. Despite this, the benefits of smart machines, including increased productivity, improved quality, and enhanced safety, are leading many companies to invest in this technology. Overall, the market is expected to continue growing at a strong pace in the coming years.
What will be the Size of the Smart Machines Market During the Forecast Period?
- The market encompasses various types of machines that leverage Machine-to-Machine technology, Deep Learning, Machine Learning, and Artificial Intelligence. These machines include Robots, Drones, Smart Wearables, Self-driving cars, and Cognitive Computing Systems. The market is segmented into several verticals such as Hardware, Software, and Services. In the Hardware segment, components of Smart Machines like sensors, actuators, and processors are in high demand. Machine types In the market include Robotic and Autonomous cars, Self-ruling vehicles, and various types of industrial machinery.
- The market is also vertical-specific, catering to sectors like Healthcare, Transportation, and Manufacturing. Machine Learning and Artificial Intelligence are integral to the functioning of these machines, enabling them to learn from data and make decisions without human intervention. Key players In the market include various technology and vehicle producers. The market is expected to witness significant growth due to the increasing adoption of AI and advanced technologies in various industries.
How is this Smart Machines Industry segmented and which is the largest segment?
The smart machines industry research report provides comprehensive data (region-wise segment analysis), with forecasts and estimates in "USD billion" for the period 2024-2028, as well as historical data from 2018-2022 for the following segments.
- Component
- Software
- Hardware
- Product
- Expert systems
- Autonomous robots
- Digital assistants
- Others
- Geography
- North America
- US
- Europe
- Germany
- UK
- APAC
- China
- Japan
- South America
- Middle East and Africa
- North America
By Component Insights
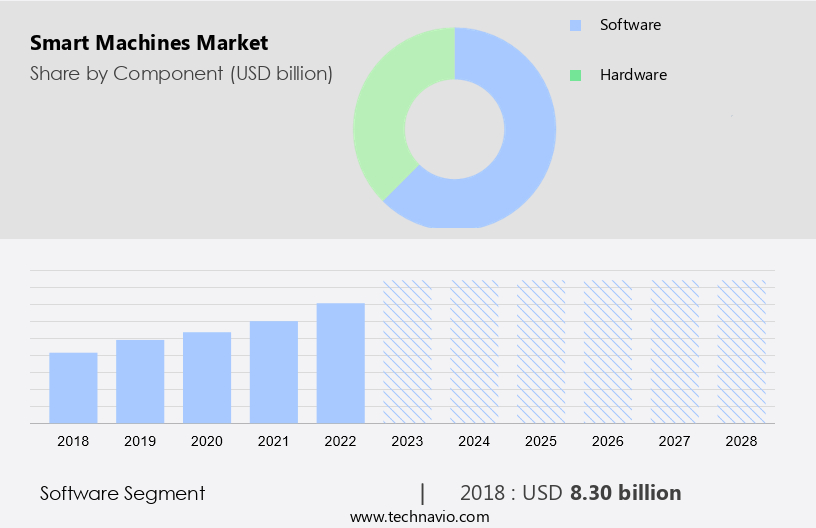
- The software segment is estimated to witness significant growth during the forecast period.
The market encompasses various machine types, including autonomous robots, drones, and autonomous cars, that leverage advanced technologies such as artificial intelligence (AI), machine learning, deep learning, and cognitive technology. These machines are increasingly being adopted across industries, including aerospace and defense, healthcare, manufacturing, consumer electronics, and logistics, to enhance efficiency, optimization, and decision-making capabilities. Affective technology and perception capabilities are also gaining traction, enabling machines to interact more effectively with humans.
Big Data Technology and Cloud Computing Technology are essential components of these intelligent machines, facilitating real-time data processing and analysis. Rethink Robotics and Cognitive Technology lead the market, with a majority share, driven by the growing demand for automation in manufacturing, material handling, inventory management, and diagnosis. The integration of AI and machine learning algorithms in expert systems and embedded systems is further fueling the market's growth. Additionally, the adoption of machine-to-machine technology and the Internet of Everything is revolutionizing industries, from defense and healthcare to creative virtual assistant applications.
Get a glance at the market report of share of various segments Request Free Sample
The software segment was valued at USD 8.30 billion in 2018 and showed a gradual increase during the forecast period.
Regional Analysis
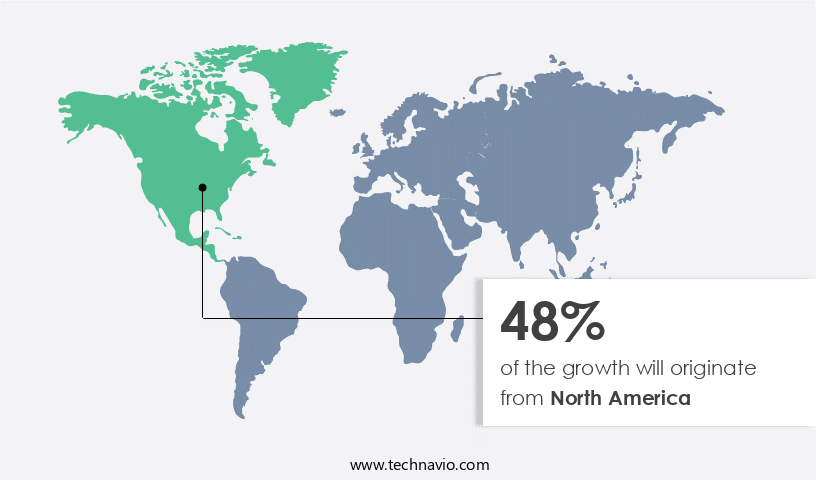
- North America is estimated to contribute 48% to the growth of the global market during the forecast period.
Technavio's analysts have elaborately explained the regional trends and drivers that shape the market during the forecast period.
For more insights on the market size of various regions, Request Free Sample
The market encompasses a range of advanced technologies, including robots and robotics, self-driving cars and self-ruling vehicles, virtual assistants, speech recognition software, and wearable devices. In the manufacturing sector, robots and robotics are increasingly being used for services such as assembly, welding, and material handling. In transportation and logistics, self-driving cars and trucks are revolutionizing the industry, while in healthcare, smart machines are being used for surgery and treatment. Vehicle producers are investing heavily In these technologies to stay competitive. In verticals like warehousing, smart machines are streamlining operations and improving efficiency. V-Person technology and speech recognition software are also gaining popularity in various industries for their ability to enhance user experience.
Smart wearables, such as fitness trackers and smartwatches, are another segment of the market that is experiencing significant growth. Overall, the market is poised for continued expansion as technology continues to advance and find new applications.
Market Dynamics
Our researchers analyzed the data with 2023 as the base year, along with the key drivers, trends, and challenges. A holistic analysis of drivers will help companies refine their marketing strategies to gain a competitive advantage.
What are the key market drivers leading to the rise In the adoption of Smart Machines Industry?
Changes in global labor force is the key driver of the market.
- The global market for smart machines is experiencing significant growth due to the increasing demand for automation and efficiency in various industries. Artificial intelligence (AI), machine learning, and cognitive technology are driving the development of advanced machine types, including autonomous cars, drones, and robots. These machines are equipped with perception capabilities and decision-making algorithms, enabling them to perform tasks that were previously the domain of humans. Industries such as aerospace and defense, healthcare, manufacturing, and logistics are major adopters of smart machines. Big Data Technology and Cloud Computing Technology are facilitating the integration of these machines into complex systems, enabling optimization and inventory management.
- In the healthcare sector, AI and machine learning are being used for medical imaging and diagnosis. In the manufacturing sector, smart machines are being used for material handling and component assembly. The adoption of smart machines is also being driven by the need for round-the-clock operations in industries such as consumer electronics and creative virtual assistant services. The use of autonomous robots and drones in agriculture and mining is increasing efficiency and reducing labor costs. Rethink Robotics and Expert systems are being used to automate repetitive tasks and improve productivity. The future of smart machines lies In their ability to learn and adapt to new situations, making them increasingly valuable in industries where human labor is scarce or expensive. By 2050, the global working-age population is expected to decrease significantly, making the adoption of smart machines even more crucial for maintaining productivity and competitiveness.
What are the market trends shaping the Smart Machines Industry?
Emergence of IIoT is the upcoming market trend.
- The industrial landscape is witnessing a significant shift towards the integration of smart machines, driven by the Industrial Internet of Things (IIoT) and technological advancements. These machines, incorporating artificial intelligence (AI), cognitive technology, and machine learning, are revolutionizing industries such as aerospace and defense, healthcare, manufacturing, and consumer electronics. Smart machines are increasingly being used in sectors like automation, inventory management, logistics, and material handling, where efficiency and optimization are paramount. In aerospace and defense, AI-powered decision-making algorithms are being employed for diagnosis and optimization, while autonomous drones are used for surveillance and reconnaissance. In healthcare, machine learning is being used for medical imaging and diagnosis, and cognitive technology is being employed for expert systems.
- Moreover, smart machines are making their way into consumer electronics, with autonomous cars and robots becoming increasingly common. Machine-to-machine technology and Big Data Technology are enabling these machines to communicate and learn from each other, enhancing their perception capabilities and enabling them to make decisions based on real-time data. Embedded systems and cloud computing technology are essential components of these machines, enabling remote control and monitoring. With the increasing competition, companies are offering services and control modules from remote locations, making these machines more flexible and convenient for human operators. One can now control multiple machines simultaneously, increasing productivity and efficiency. Hence, the future of smart machines is bright, with their utility and mode of operation set to expand further, making them indispensable in various industries.
What challenges does the Smart Machines Industry face during its growth?
High cost of deployment is a key challenge affecting the industry growth.
- Smart machines, including autonomous robots and drones, incorporate sensors, software, and advanced technologies that necessitate substantial upfront investments. The high costs of deployment pose a significant challenge for potential users, particularly in developing countries with price-conscious consumers. In addition to the initial costs, there are additional expenses associated with modifying infrastructure and facilities to accommodate smart machines. End-users seeking to implement these technologies often require customization and additional services to meet their operational needs. For instance, the implementation of an autonomous robot involves expenses for programming, commissioning, and installation, which can vary based on the application and industry. In sectors such as aerospace and defense, healthcare, manufacturing, and logistics, the integration of smart machines, including those with cognitive technology, machine learning, and deep learning capabilities, offers significant benefits in terms of efficiency, optimization, and decision-making algorithms.
- Despite the high costs, the majority share of the market is held by these industries due to the substantial returns on investment. The integration of big data technology, cloud computing, and machine-to-machine technology further enhances the capabilities of smart machines, enabling them to perform tasks such as inventory management, medical imaging, and diagnosis with greater precision and accuracy.
Exclusive Customer Landscape
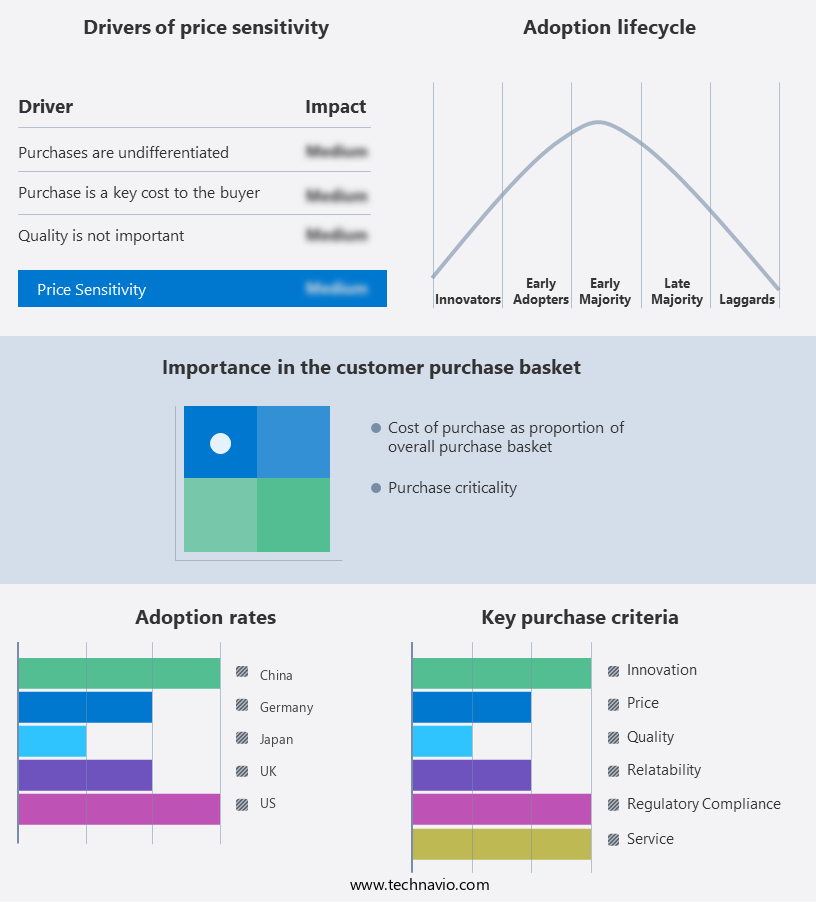
The smart machines market forecasting report includes the adoption lifecycle of the market, market growth and forecasting, covering from the innovator's stage to the laggard's stage. It focuses on adoption rates in different regions based on penetration. Furthermore, the smart machines market report also includes key purchase criteria and drivers of price sensitivity to help companies evaluate and develop their market growth analysis strategies.
Customer Landscape
Key Companies & Market Insights
Companies are implementing various strategies, such as strategic alliances, smart machines market forecast, partnerships, mergers and acquisitions, geographical expansion, and product/service launches, to enhance their presence In the industry.
The industry research and growth report includes detailed analyses of the competitive landscape of the market and information about key companies, including:
- Alphabet Inc.
- Amazon.com Inc.
- Apple Inc.
- BAE Systems Plc
- Oracle Corp.
- Clearpath Robotics Inc.
- CoreTigo Ltd.
- Creative Virtual Ltd.
- HAHN Group GmbH
- International Business Machines Corp.
- Koninklijke Philips N.V.
- KUKA AG
- Microsoft Corp.
- Mobile Industrial Robots AS
- RELX Plc
- Salesforce Inc.
- Samsung Electronics Co. Ltd.
- Smarsh Inc.
- ST Engineering Aethon Inc.
- Veradigm LLC
Qualitative and quantitative analysis of companies has been conducted to help clients understand the wider business environment as well as the strengths and weaknesses of key industry players. Data is qualitatively analyzed to categorize companies as pure play, category-focused, industry-focused, and diversified; it is quantitatively analyzed to categorize companies as dominant, leading, strong, tentative, and weak.
Research Analyst Overview
The market is witnessing significant growth in various industries, including Aerospace & Defense, Consumer Electronics, and Manufacturing. This market encompasses various machine types, such as autonomous robots, drones, and autonomous cars, which are integrated with Artificial Intelligence (AI), Cognitive Technology, and Machine Learning. In Aerospace & Defense, AI is used for decision-making algorithms in defense systems and drones, while in Consumer Electronics, Creative Virtual Assistants are becoming more common in Advice Line calls and Internet of Everything applications. In Manufacturing, automation and optimization are key drivers, with Machine-to-Machine Technology and Big Data Technology playing essential roles in Inventory Management and Logistics.
Moreover, the integration of Perception Capabilities, Deep Learning, and Efficiency in machines is revolutionizing industries, such as Healthcare with Medical Imaging and Material Handling. Rethink Robotics and other companies are leading the market with Majority Share In their respective sectors. Embedded systems and Expert Systems are also gaining popularity in various applications. Overall, the market is a dynamic and evolving landscape, with continued innovation in AI, Machine Learning, and other technologies driving growth and transformation across industries.
|
Market Scope |
|
|
Report Coverage |
Details |
|
Page number |
182 |
|
Base year |
2023 |
|
Historic period |
2018-2022 |
|
Forecast period |
2024-2028 |
|
Growth momentum & CAGR |
Accelerate at a CAGR of 27.23% |
|
Market growth 2024-2028 |
USD 51.8 billion |
|
Market structure |
Fragmented |
|
YoY growth 2023-2024(%) |
21.17 |
|
Key countries |
US, UK, Germany, China, and Japan |
|
Competitive landscape |
Leading Companies, Market Positioning of Companies, Competitive Strategies, and Industry Risks |
What are the Key Data Covered in this Market Research and Growth Report?
- CAGR of the industry during the forecast period
- Detailed information on factors that will drive the growth and forecasting between 2024 and 2028
- Precise estimation of the size of the market and its contribution of the industry in focus to the parent market
- Accurate predictions about upcoming growth and trends and changes in consumer behaviour
- Growth of the market across North America, Europe, APAC, South America, and Middle East and Africa
- Thorough analysis of the market's competitive landscape and detailed information about companies
- Comprehensive analysis of factors that will challenge the market growth of industry companies
We can help! Our analysts can customize this market research report to meet your requirements.
 RIA -
RIA - 
