Smart Office Solutions Market Analysis, Size, and Forecast 2025-2029: APAC (China, India, Japan, South Korea), North America (US and Canada), Europe (France, Germany, Italy, UK), South America , and Middle East and Africa

Smart Office Solutions Market Analysis, Size, and Forecast 2025-2029:
APAC (China, India, Japan, South Korea), North America (US and Canada), Europe (France, Germany, Italy, UK), South America , and Middle East and Africa

Published: Mar 2025 245 Pages SKU: IRTNTR40822

Market Overview at a Glance

$5.05 B
Market Opportunity
17.1%
CAGR
14.2
YoY growth 2024-2025(%)

Smart Office Solutions Market Size 2025-2029

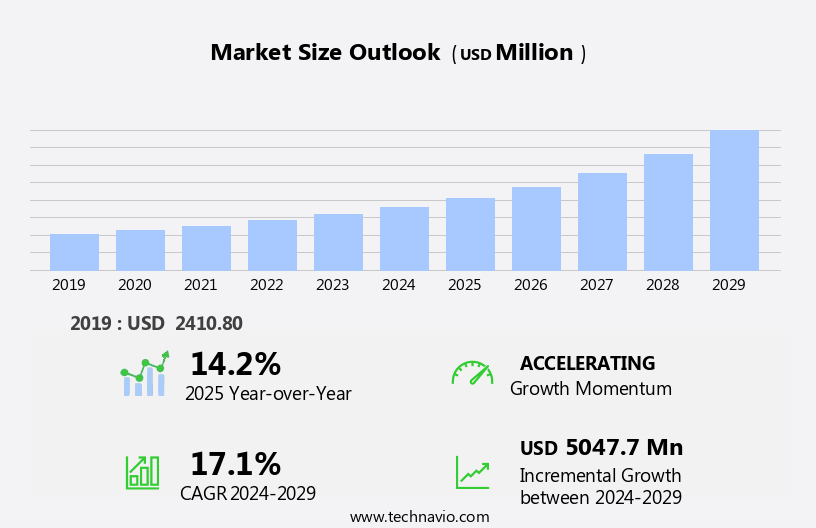
The smart office solutions market size is forecast to increase by USD 5.05 billion, at a CAGR of 17.1% between 2024 and 2029.

  • The market is experiencing significant growth, driven by the increasing number of startups innovating in this space and the integration of advanced technologies such as artificial intelligence (AI) and machine learning algorithms. These technologies enable smart offices to optimize energy usage, improve occupant comfort, and enhance productivity. However, the high upfront costs associated with implementing smart office solutions remain a challenge for many organizations, particularly smaller businesses and those with limited budgets. Despite this obstacle, the market's potential for cost savings and operational efficiencies makes it an attractive investment for forward-thinking companies seeking to stay competitive in today's business landscape.
  • The integration of AI and machine learning algorithms is expected to be a key trend in the market, as these technologies enable smart offices to learn and adapt to the unique needs of their occupants and environments. Overall, the market offers significant opportunities for growth and innovation, but companies must carefully consider the upfront costs and explore financing options or partnerships to make these investments more feasible.

What will be the Size of the Smart Office Solutions Market during the forecast period?

Smart Office Solutions Market Size

 Request Free Sample

The market continues to evolve, with dynamic applications across various sectors. Acoustic design, cybersecurity solutions, user experience design, natural language processing, data security, and interactive whiteboards are seamlessly integrated into smart office standards. Change management, environmental controls, sustainability initiatives, mobile app development, agile workspaces, workplace wellbeing, occupancy monitoring, and digital transformation strategies are also key components. Cloud-based collaboration, smart security systems, employee training, user interface design, workplace analytics, and employee satisfaction are essential elements of the digital transformation. High-speed internet, virtual reality, connectivity solutions, desk booking systems, interior design, smart lighting, managed services, wireless networking, energy management, and green building standards are also integral.

IoT sensors, building information modeling, data center infrastructure, augmented reality, access control, flexible work environments, employee engagement platforms, collaboration software, machine learning algorithms, productivity metrics, workflow automation, remote work management, space utilization optimization, digital twins, network infrastructure, return on investment, space planning, and digital signage are ongoing trends. The market's continuous unfolding is marked by the integration of AI-powered assistants, subscription models, hybrid work models, and smart building integration. Embracing these advancements, organizations can optimize their workspaces, enhance productivity, and improve employee engagement. The market's evolution is driven by the need for advanced technology solutions that cater to the evolving needs of modern workplaces.

How is this Smart Office Solutions Industry segmented?

The smart office solutions industry research report provides comprehensive data (region-wise segment analysis), with forecasts and estimates in "USD million" for the period 2025-2029, as well as historical data from 2019-2023 for the following segments.

  • Product
    • Smart security systems
    • Smart EMS
    • HVAC control systems
    • Smart lighting systems
    • Audio-video conferencing systems
  • Technology
    • Wireless technologies
    • Wired technologies
  • Component
    • Hardware
    • Software
    • Service
  • Type
    • Retrofit
    • New construction
  • Geography
    • North America
      • US
      • Canada
    • Europe
      • France
      • Germany
      • Italy
      • UK
    • APAC
      • China
      • India
      • Japan
      • South Korea
    • Rest of World (ROW)

    By Product Insights

    The smart security systems segment is estimated to witness significant growth during the forecast period.

    In the dynamic world of smart office solutions, various entities continue to shape the market's evolution. Acoustic design and user experience (UX) have emerged as critical factors, ensuring harmonious workspaces with optimized noise levels and intuitive interfaces. Cybersecurity solutions have become essential, emphasizing robust data security and natural language processing for seamless communication. Interactive whiteboards and digital transformation strategies facilitate agile workspaces and cloud-based collaboration. Change management and employee training are crucial components of smart office design, enabling a smooth transition to new technologies. Environmental controls and sustainability initiatives prioritize energy efficiency and green building standards, while occupancy monitoring optimizes space utilization.

    Smart security systems incorporate advanced access control, video conferencing, and building information modeling for enhanced safety and productivity. Workplace wellbeing is a growing concern, with workplace analytics and employee satisfaction metrics driving decisions. High-speed internet, virtual reality, and connectivity solutions enable remote work management and flexible work environments. Desk booking systems, smart lighting, and managed services streamline daily operations. Employee engagement platforms and collaboration software leverage machine learning algorithms and workflow automation to boost productivity. Remote work management and space planning tools optimize resources and improve return on investment. Digital signage and data visualization enhance communication and knowledge management.

    As the market continues to evolve, hybrid work models and subscription services are gaining popularity, with IoT sensors and data center infrastructure powering the digital transformation. Access control, flexible work environments, and AI-powered assistants are shaping the future of smart offices. Building integration, unified communications, and talent acquisition strategies are also key areas of focus.

    Smart Office Solutions Market Size

    Request Free Sample

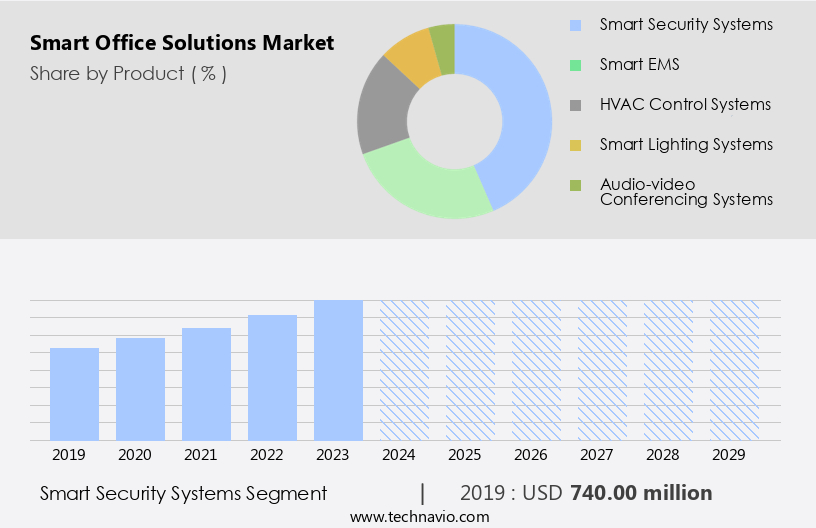
    The Smart security systems segment was valued at USD 740.00 billion in 2019 and showed a gradual increase during the forecast period.

    Regional Analysis

    APAC is estimated to contribute 30% to the growth of the global market during the forecast period.Technavio’s analysts have elaborately explained the regional trends and drivers that shape the market during the forecast period.

    Smart Office Solutions Market Share by Geography

     Request Free Sample

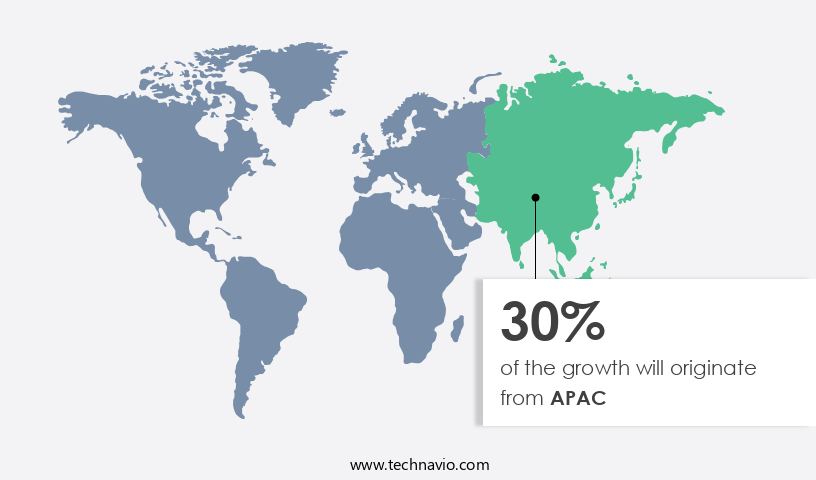
    In the dynamic business landscape of APAC, Japan, China, and India are leading the adoption of smart office solutions. The surge in the number of commercial offices and the prioritization of technological safety measures, particularly in China and India, are driving market expansion. IoT services are experiencing significant growth in the region, with over 80% of the populations in China and Japan adopting these technologies. Infrastructure development and the integration of IoT services are gaining momentum due to the increasing number of corporate offices. Amidst growing concerns over cybersecurity, the demand for enhanced safety and security in smart office solutions is escalating in the corporate sector.

    User experience design, natural language processing, and data security are key components of these solutions, ensuring harmonious and productive work environments. Change management, environmental controls, and sustainability initiatives are also essential elements, reflecting the region's commitment to workplace wellbeing and eco-consciousness. Mobile app development, agile workspaces, and employee training are other areas of focus, enabling seamless collaboration and productivity. Digital transformation strategies, cloud-based collaboration, and smart security systems are essential components of these solutions, fostering a flexible and connected work environment. Employee engagement platforms, collaboration software, and machine learning algorithms further optimize productivity and workflow automation, while remote work management and space utilization optimization cater to the evolving needs of hybrid work models.

    The integration of AI-powered assistants, subscription models, and building information modeling enhances the overall functionality and efficiency of smart office solutions. The adoption of green building standards, energy management, and IT support ensures a sustainable and efficient infrastructure. The market's evolution reflects the region's commitment to digital transformation and the integration of advanced technologies to create harmonious, productive, and secure workspaces.

    Market Dynamics

    Our researchers analyzed the data with 2024 as the base year, along with the key drivers, trends, and challenges. A holistic analysis of drivers will help companies refine their marketing strategies to gain a competitive advantage.

    What are the key market drivers leading to the rise in the adoption of Smart Office Solutions Industry?

    • The significant rise in the number of startups serves as the primary catalyst for market growth. 

    • The market is experiencing significant growth due to increasing investments in technology startups by established IT companies. This trend is driving market expansion as these companies seek to innovate and offer specialized services. For instance, Wipro, a leading IT firm, has invested in several startups, such as Tricentis and Drivestream, to enhance its portfolio. Augmented reality, access control, flexible work environments, employee engagement platforms, collaboration software, machine learning algorithms, productivity metrics, workflow automation, remote work management, space utilization optimization, digital twins, network infrastructure, and digital signage are key technologies shaping the market. These solutions improve productivity, streamline workflows, and create harmonious workspaces.
    • Moreover, the adoption of these technologies is essential for businesses to maintain a competitive edge. Productivity metrics, for example, enable companies to monitor employee performance and optimize resource allocation. Workflow automation and remote work management tools are essential for organizations with distributed teams. Space utilization optimization and digital twins help businesses optimize their physical workspaces and reduce costs. The return on investment (ROI) from these solutions is significant, making them a worthwhile investment for businesses. As companies continue to prioritize employee engagement and productivity, the demand for smart office solutions is expected to grow.

    What are the market trends shaping the Smart Office Solutions Industry?

    • The integration of artificial intelligence (AI) and machine learning algorithms is becoming a significant trend in the development of smart office solutions. These advanced technologies enhance the functionality and efficiency of office environments by automating routine tasks, optimizing energy consumption, and improving overall productivity.

    • The market is witnessing significant growth due to the integration of advanced technologies such as artificial intelligence (AI) and machine learning algorithms. This trend signifies a move towards more intelligent and adaptive workplaces that prioritize data-driven insights to boost efficiency, productivity, and user experience. AI and machine learning are being utilized in various smart office solutions, offering capabilities like predictive analytics, automation, and personalized experiences. For instance, AI-enabled occupancy sensors can analyze workspace usage patterns to optimize desk allocation and facility utilization, thereby reducing unnecessary space and enhancing resource efficiency. Additionally, machine learning algorithms can analyze historical employee data to dynamically adjust environmental settings such as lighting, temperature, and air quality, ensuring a comfortable and customized work environment.
    • Moreover, smart office designs are incorporating acoustic design, cybersecurity solutions, user experience design, natural language processing, data security, interactive whiteboards, change management, environmental controls, sustainability initiatives, mobile app development, agile workspaces, workplace wellbeing, and occupancy monitoring to create harmonious and immersive workplaces. These digital transformation strategies are revolutionizing the way businesses operate and are essential for staying competitive in today's dynamic business landscape.

    What challenges does the Smart Office Solutions Industry face during its growth?

    • The implementation of smart offices entails significant upfront costs, which represents a significant challenge and may hinder the industry's growth. 

    • The market presents significant opportunities for businesses seeking to enhance productivity, employee satisfaction, and workplace efficiency. Cloud-based collaboration tools enable seamless communication and document sharing among teams, while smart security systems ensure a secure working environment. User interface design and workplace analytics provide valuable insights into employee behavior and preferences, fostering a harmonious and immersive work experience. However, the high upfront costs associated with implementing smart office technologies pose a challenge for many organizations, particularly SMEs. These costs encompass hardware procurement, software licensing, infrastructure upgrades, and installation fees. The complexity of integrating various smart office components and systems can also escalate implementation costs.
    • To mitigate these challenges, businesses can consider connectivity solutions such as high-speed internet, virtual reality, and desk booking systems. These solutions offer cost-effective alternatives to traditional hardware and infrastructure upgrades. Additionally, managed services and wireless networking can help streamline implementation and maintenance processes. Energy management and green building standards are essential considerations for businesses seeking to reduce operational costs and promote sustainability. Smart lighting and interior design enhance the workplace environment, while workplace analytics can help identify areas for energy savings. In conclusion, the benefits of smart office solutions are undeniable, but the initial investment required for implementation can be substantial.
    • By exploring cost-effective alternatives and prioritizing essential components, businesses can overcome financial and logistical barriers to adoption and reap the long-term rewards of a smart office environment.

    Exclusive Customer Landscape

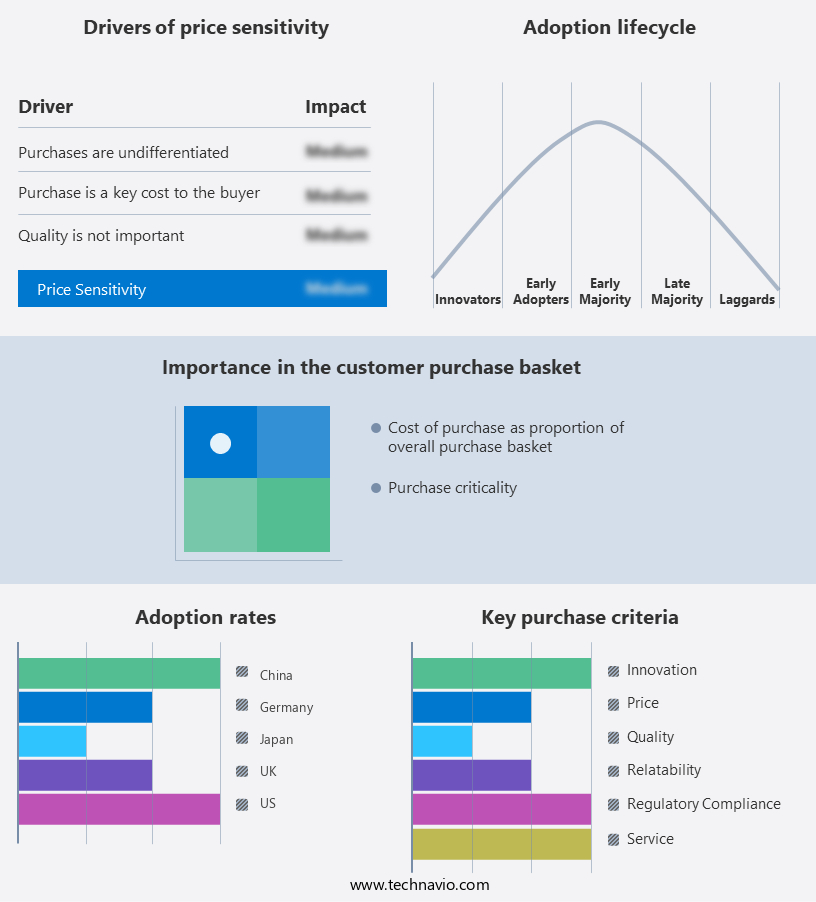
    The smart office solutions market forecasting report includes the adoption lifecycle of the market, covering from the innovator’s stage to the laggard’s stage. It focuses on adoption rates in different regions based on penetration. Furthermore, the smart office solutions market report also includes key purchase criteria and drivers of price sensitivity to help companies evaluate and develop their market growth analysis strategies.

    Smart Office Solutions Market Share by Geography

     Customer Landscape

    Key Companies & Market Insights

    Companies are implementing various strategies, such as strategic alliances, smart office solutions market forecast, partnerships, mergers and acquisitions, geographical expansion, and product/service launches, to enhance their presence in the industry.

    ABB Ltd. - This company specializes in advanced office technology, delivering integrated control systems for power distribution, lighting, shading, HVAC, and electric vehicle charging. Our innovative solutions optimize energy usage, enhance comfort, and promote sustainability. By seamlessly merging these essential functions, we enable businesses to streamline operations, reduce costs, and improve overall efficiency. Our cutting-edge technology adheres to the highest industry standards, ensuring reliability and ease of use. Embrace the future of smart offices with our comprehensive, customizable solutions.

    The industry research and growth report includes detailed analyses of the competitive landscape of the market and information about key companies, including:

    • ABB Ltd.
    • Avnet Inc.
    • Cisco Systems Inc.
    • Coor Service Management Holding AB
    • Crestron Electronics Inc.
    • DEKOM AG
    • Develco Products AS
    • GoBright B V
    • Honeywell International Inc.
    • Johnson Controls International Plc
    • Komstadt Systems Ltd.
    • Konig Neurath AG
    • Koninklijke Philips NV
    • Lutron Electronics Co. Inc.
    • Schneider Electric SE
    • Senion AB
    • Siemens AG
    • Signify NV
    • Smart Office Software Solutions
    • Tata Teleservices Ltd.

    Qualitative and quantitative analysis of companies has been conducted to help clients understand the wider business environment as well as the strengths and weaknesses of key industry players. Data is qualitatively analyzed to categorize companies as pure play, category-focused, industry-focused, and diversified; it is quantitatively analyzed to categorize companies as dominant, leading, strong, tentative, and weak.

    Recent Development and News in Smart Office Solutions Market

    • In January 2023, Microsoft announced the global availability of its Microsoft Teams Rooms Surface Hub 2S, a new all-in-one smart device designed for modern meeting spaces. This expansion marks Microsoft's commitment to enhancing collaboration and productivity in offices through its Smart Office Solutions (Microsoft, 2023).
    • In March 2024, Google and Cisco Systems entered into a strategic partnership to integrate Google Workspace with Cisco's Webex Meetings platform. This collaboration aimed to provide seamless video conferencing and collaboration tools to businesses, merging Google's productivity suite with Cisco's video conferencing capabilities (Google, 2024).
    • In May 2024, Logitech, a leading provider of video conferencing equipment, completed its acquisition of Jabra, a Danish audio device manufacturer. This strategic move enabled Logitech to expand its product portfolio, offering integrated audio and video solutions for smart offices (Logitech, 2024).
    • In October 2025, the European Union announced the 'Green Deal for Europe' initiative, which includes a focus on digitizing public services and promoting smart offices to reduce carbon emissions. The EU's investment in smart office solutions is expected to drive market growth and innovation in the sector (European Commission, 2025).

    Research Analyst Overview

    • In the dynamic the market, immersive technologies such as holographic displays and virtual assistant integration enhance user experiences, while biometric authentication and facial recognition ensure data privacy and security. Compliance regulations, including green procurement and carbon footprinting, drive the adoption of sustainable building standards and IoT-enabled smart mobility. Predictive analytics and real-time data analytics optimize building performance and automate HVAC systems, reducing energy consumption. Edge computing and digital asset management streamline content management and data governance, enabling seamless integration with 5G connectivity and smart city infrastructure.
    • Building automation systems and smart desk technology leverage voice recognition systems and wayfinding solutions to improve productivity and efficiency. Data privacy and security concerns are addressed through blockchain security and smart city integration, ensuring a secure and interconnected office environment.

    Dive into Technavio’s robust research methodology, blending expert interviews, extensive data synthesis, and validated models for unparalleled Smart Office Solutions Market insights. See full methodology.

    Market Scope

    Report Coverage

    Details

    Page number

    245

    Base year

    2024

    Historic period

    2019-2023

    Forecast period

    2025-2029

    Growth momentum & CAGR

    Accelerate at a CAGR of 17.1%

    Market growth 2025-2029

    USD 5047.7 million

    Market structure

    Fragmented

    YoY growth 2024-2025(%)

    14.2

    Key countries

    US, China, Japan, Germany, India, South Korea, UK, France, Canada, and Italy

    Competitive landscape

    Leading Companies, Market Positioning of Companies, Competitive Strategies, and Industry Risks

    Request Free Sample

    What are the Key Data Covered in this Smart Office Solutions Market Research and Growth Report?

    • CAGR of the Smart Office Solutions industry during the forecast period
    • Detailed information on factors that will drive the growth and forecasting between 2025 and 2029
    • Precise estimation of the size of the market and its contribution of the industry in focus to the parent market
    • Accurate predictions about upcoming growth and trends and changes in consumer behaviour
    • Growth of the market across APAC, North America, Europe, South America, and Middle East and Africa
    • Thorough analysis of the market’s competitive landscape and detailed information about companies
    • Comprehensive analysis of factors that will challenge the smart office solutions market growth of industry companies

    We can help! Our analysts can customize this smart office solutions market research report to meet your requirements.

    Get in touch


    1 Executive Summary

    • 1.1 Market overview
      • Executive Summary - Chart on Market Overview
      • Executive Summary - Data Table on Market Overview
      • Executive Summary - Chart on Global Market Characteristics
      • Executive Summary - Chart on Market by Geography
      • Executive Summary - Chart on Market Segmentation by Product
      • Executive Summary - Chart on Market Segmentation by Technology
      • Executive Summary - Chart on Market Segmentation by Component
      • Executive Summary - Chart on Market Segmentation by Type
      • Executive Summary - Chart on Incremental Growth
      • Executive Summary - Data Table on Incremental Growth
      • Executive Summary - Chart on Company Market Positioning

    2 Technavio Analysis

    • 2.1 Analysis of price sensitivity, lifecycle, customer purchase basket, adoption rates, and purchase criteria
      • Analysis of price sensitivity, lifecycle, customer purchase basket, adoption rates, and purchase criteria
    • 2.2 Criticality of inputs and Factors of differentiation
      • Overview on criticality of inputs and factors of differentiation
    • 2.3 Factors of disruption
      • Overview on factors of disruption
    • 2.4 Impact of drivers and challenges
      • Impact of drivers and challenges in 2024 and 2029

    3 Market Landscape

    • 3.1 Market ecosystem
      • Parent Market
      • Data Table on - Parent Market
    • 3.2 Market characteristics
      • Market characteristics analysis
    • 3.3 Value chain analysis
      • Value chain analysis

    4 Market Sizing

    • 4.1 Market definition
      • Offerings of companies included in the market definition
    • 4.2 Market segment analysis
      • Market segments
    • 4.3 Market size 2024
      • 4.4 Market outlook: Forecast for 2024-2029
        • Chart on Global - Market size and forecast 2024-2029 ($ million)
        • Data Table on Global - Market size and forecast 2024-2029 ($ million)
        • Chart on Global Market: Year-over-year growth 2024-2029 (%)
        • Data Table on Global Market: Year-over-year growth 2024-2029 (%)

      5 Historic Market Size

      • 5.1 Global Smart Office Solutions Market 2019 - 2023
        • Historic Market Size - Data Table on Global Smart Office Solutions Market 2019 - 2023 ($ million)
      • 5.2 Product segment analysis 2019 - 2023
        • Historic Market Size - Product Segment 2019 - 2023 ($ million)
      • 5.3 Technology segment analysis 2019 - 2023
        • Historic Market Size - Technology Segment 2019 - 2023 ($ million)
      • 5.4 Component segment analysis 2019 - 2023
        • Historic Market Size - Component Segment 2019 - 2023 ($ million)
      • 5.5 Type segment analysis 2019 - 2023
        • Historic Market Size - Type Segment 2019 - 2023 ($ million)
      • 5.6 Geography segment analysis 2019 - 2023
        • Historic Market Size - Geography Segment 2019 - 2023 ($ million)
      • 5.7 Country segment analysis 2019 - 2023
        • Historic Market Size - Country Segment 2019 - 2023 ($ million)

      6 Qualitative Analysis

      • 6.1 The AI impact on global smart office solutions market

        7 Five Forces Analysis

        • 7.1 Five forces summary
          • Five forces analysis - Comparison between 2024 and 2029
        • 7.2 Bargaining power of buyers
          • Bargaining power of buyers - Impact of key factors 2024 and 2029
        • 7.3 Bargaining power of suppliers
          • Bargaining power of suppliers - Impact of key factors in 2024 and 2029
        • 7.4 Threat of new entrants
          • Threat of new entrants - Impact of key factors in 2024 and 2029
        • 7.5 Threat of substitutes
          • Threat of substitutes - Impact of key factors in 2024 and 2029
        • 7.6 Threat of rivalry
          • Threat of rivalry - Impact of key factors in 2024 and 2029
        • 7.7 Market condition
          • Chart on Market condition - Five forces 2024 and 2029

        8 Market Segmentation by Product

        • 8.1 Market segments
          • Chart on Product - Market share 2024-2029 (%)
          • Data Table on Product - Market share 2024-2029 (%)
        • 8.2 Comparison by Product
          • Chart on Comparison by Product
          • Data Table on Comparison by Product
        • 8.3 Smart security systems - Market size and forecast 2024-2029
          • Chart on Smart security systems - Market size and forecast 2024-2029 ($ million)
          • Data Table on Smart security systems - Market size and forecast 2024-2029 ($ million)
          • Chart on Smart security systems - Year-over-year growth 2024-2029 (%)
          • Data Table on Smart security systems - Year-over-year growth 2024-2029 (%)
        • 8.4 Smart EMS - Market size and forecast 2024-2029
          • Chart on Smart EMS - Market size and forecast 2024-2029 ($ million)
          • Data Table on Smart EMS - Market size and forecast 2024-2029 ($ million)
          • Chart on Smart EMS - Year-over-year growth 2024-2029 (%)
          • Data Table on Smart EMS - Year-over-year growth 2024-2029 (%)
        • 8.5 HVAC control systems - Market size and forecast 2024-2029
          • Chart on HVAC control systems - Market size and forecast 2024-2029 ($ million)
          • Data Table on HVAC control systems - Market size and forecast 2024-2029 ($ million)
          • Chart on HVAC control systems - Year-over-year growth 2024-2029 (%)
          • Data Table on HVAC control systems - Year-over-year growth 2024-2029 (%)
        • 8.6 Smart lighting systems - Market size and forecast 2024-2029
          • Chart on Smart lighting systems - Market size and forecast 2024-2029 ($ million)
          • Data Table on Smart lighting systems - Market size and forecast 2024-2029 ($ million)
          • Chart on Smart lighting systems - Year-over-year growth 2024-2029 (%)
          • Data Table on Smart lighting systems - Year-over-year growth 2024-2029 (%)
        • 8.7 Audio-video conferencing systems - Market size and forecast 2024-2029
          • Chart on Audio-video conferencing systems - Market size and forecast 2024-2029 ($ million)
          • Data Table on Audio-video conferencing systems - Market size and forecast 2024-2029 ($ million)
          • Chart on Audio-video conferencing systems - Year-over-year growth 2024-2029 (%)
          • Data Table on Audio-video conferencing systems - Year-over-year growth 2024-2029 (%)
        • 8.8 Market opportunity by Product
          • Market opportunity by Product ($ million)
          • Data Table on Market opportunity by Product ($ million)

        9 Market Segmentation by Technology

        • 9.1 Market segments
          • Chart on Technology - Market share 2024-2029 (%)
          • Data Table on Technology - Market share 2024-2029 (%)
        • 9.2 Comparison by Technology
          • Chart on Comparison by Technology
          • Data Table on Comparison by Technology
        • 9.3 Wireless technologies - Market size and forecast 2024-2029
          • Chart on Wireless technologies - Market size and forecast 2024-2029 ($ million)
          • Data Table on Wireless technologies - Market size and forecast 2024-2029 ($ million)
          • Chart on Wireless technologies - Year-over-year growth 2024-2029 (%)
          • Data Table on Wireless technologies - Year-over-year growth 2024-2029 (%)
        • 9.4 Wired technologies - Market size and forecast 2024-2029
          • Chart on Wired technologies - Market size and forecast 2024-2029 ($ million)
          • Data Table on Wired technologies - Market size and forecast 2024-2029 ($ million)
          • Chart on Wired technologies - Year-over-year growth 2024-2029 (%)
          • Data Table on Wired technologies - Year-over-year growth 2024-2029 (%)
        • 9.5 Market opportunity by Technology
          • Market opportunity by Technology ($ million)
          • Data Table on Market opportunity by Technology ($ million)

        10 Market Segmentation by Component

        • 10.1 Market segments
          • Chart on Component - Market share 2024-2029 (%)
          • Data Table on Component - Market share 2024-2029 (%)
        • 10.2 Comparison by Component
          • Chart on Comparison by Component
          • Data Table on Comparison by Component
        • 10.3 Hardware - Market size and forecast 2024-2029
          • Chart on Hardware - Market size and forecast 2024-2029 ($ million)
          • Data Table on Hardware - Market size and forecast 2024-2029 ($ million)
          • Chart on Hardware - Year-over-year growth 2024-2029 (%)
          • Data Table on Hardware - Year-over-year growth 2024-2029 (%)
        • 10.4 Software - Market size and forecast 2024-2029
          • Chart on Software - Market size and forecast 2024-2029 ($ million)
          • Data Table on Software - Market size and forecast 2024-2029 ($ million)
          • Chart on Software - Year-over-year growth 2024-2029 (%)
          • Data Table on Software - Year-over-year growth 2024-2029 (%)
        • 10.5 Service - Market size and forecast 2024-2029
          • Chart on Service - Market size and forecast 2024-2029 ($ million)
          • Data Table on Service - Market size and forecast 2024-2029 ($ million)
          • Chart on Service - Year-over-year growth 2024-2029 (%)
          • Data Table on Service - Year-over-year growth 2024-2029 (%)
        • 10.6 Market opportunity by Component
          • Market opportunity by Component ($ million)
          • Data Table on Market opportunity by Component ($ million)

        11 Market Segmentation by Type

        • 11.1 Market segments
          • Chart on Type - Market share 2024-2029 (%)
          • Data Table on Type - Market share 2024-2029 (%)
        • 11.2 Comparison by Type
          • Chart on Comparison by Type
          • Data Table on Comparison by Type
        • 11.3 Retrofit - Market size and forecast 2024-2029
          • Chart on Retrofit - Market size and forecast 2024-2029 ($ million)
          • Data Table on Retrofit - Market size and forecast 2024-2029 ($ million)
          • Chart on Retrofit - Year-over-year growth 2024-2029 (%)
          • Data Table on Retrofit - Year-over-year growth 2024-2029 (%)
        • 11.4 New construction - Market size and forecast 2024-2029
          • Chart on New construction - Market size and forecast 2024-2029 ($ million)
          • Data Table on New construction - Market size and forecast 2024-2029 ($ million)
          • Chart on New construction - Year-over-year growth 2024-2029 (%)
          • Data Table on New construction - Year-over-year growth 2024-2029 (%)
        • 11.5 Market opportunity by Type
          • Market opportunity by Type ($ million)
          • Data Table on Market opportunity by Type ($ million)

        12 Customer Landscape

        • 12.1 Customer landscape overview
          • Analysis of price sensitivity, lifecycle, customer purchase basket, adoption rates, and purchase criteria

        13 Geographic Landscape

        • 13.1 Geographic segmentation
          • Chart on Market share by geography 2024-2029 (%)
          • Data Table on Market share by geography 2024-2029 (%)
        • 13.2 Geographic comparison
          • Chart on Geographic comparison
          • Data Table on Geographic comparison
        • 13.3 APAC - Market size and forecast 2024-2029
          • Chart on APAC - Market size and forecast 2024-2029 ($ million)
          • Data Table on APAC - Market size and forecast 2024-2029 ($ million)
          • Chart on APAC - Year-over-year growth 2024-2029 (%)
          • Data Table on APAC - Year-over-year growth 2024-2029 (%)
        • 13.4 North America - Market size and forecast 2024-2029
          • Chart on North America - Market size and forecast 2024-2029 ($ million)
          • Data Table on North America - Market size and forecast 2024-2029 ($ million)
          • Chart on North America - Year-over-year growth 2024-2029 (%)
          • Data Table on North America - Year-over-year growth 2024-2029 (%)
        • 13.5 Europe - Market size and forecast 2024-2029
          • Chart on Europe - Market size and forecast 2024-2029 ($ million)
          • Data Table on Europe - Market size and forecast 2024-2029 ($ million)
          • Chart on Europe - Year-over-year growth 2024-2029 (%)
          • Data Table on Europe - Year-over-year growth 2024-2029 (%)
        • 13.6 South America - Market size and forecast 2024-2029
          • Chart on South America - Market size and forecast 2024-2029 ($ million)
          • Data Table on South America - Market size and forecast 2024-2029 ($ million)
          • Chart on South America - Year-over-year growth 2024-2029 (%)
          • Data Table on South America - Year-over-year growth 2024-2029 (%)
        • 13.7 Middle East and Africa - Market size and forecast 2024-2029
          • Chart on Middle East and Africa - Market size and forecast 2024-2029 ($ million)
          • Data Table on Middle East and Africa - Market size and forecast 2024-2029 ($ million)
          • Chart on Middle East and Africa - Year-over-year growth 2024-2029 (%)
          • Data Table on Middle East and Africa - Year-over-year growth 2024-2029 (%)
        • 13.8 US - Market size and forecast 2024-2029
          • Chart on US - Market size and forecast 2024-2029 ($ million)
          • Data Table on US - Market size and forecast 2024-2029 ($ million)
          • Chart on US - Year-over-year growth 2024-2029 (%)
          • Data Table on US - Year-over-year growth 2024-2029 (%)
        • 13.9 China - Market size and forecast 2024-2029
          • Chart on China - Market size and forecast 2024-2029 ($ million)
          • Data Table on China - Market size and forecast 2024-2029 ($ million)
          • Chart on China - Year-over-year growth 2024-2029 (%)
          • Data Table on China - Year-over-year growth 2024-2029 (%)
        • 13.10 Japan - Market size and forecast 2024-2029
          • Chart on Japan - Market size and forecast 2024-2029 ($ million)
          • Data Table on Japan - Market size and forecast 2024-2029 ($ million)
          • Chart on Japan - Year-over-year growth 2024-2029 (%)
          • Data Table on Japan - Year-over-year growth 2024-2029 (%)
        • 13.11 Germany - Market size and forecast 2024-2029
          • Chart on Germany - Market size and forecast 2024-2029 ($ million)
          • Data Table on Germany - Market size and forecast 2024-2029 ($ million)
          • Chart on Germany - Year-over-year growth 2024-2029 (%)
          • Data Table on Germany - Year-over-year growth 2024-2029 (%)
        • 13.12 India - Market size and forecast 2024-2029
          • Chart on India - Market size and forecast 2024-2029 ($ million)
          • Data Table on India - Market size and forecast 2024-2029 ($ million)
          • Chart on India - Year-over-year growth 2024-2029 (%)
          • Data Table on India - Year-over-year growth 2024-2029 (%)
        • 13.13 UK - Market size and forecast 2024-2029
          • Chart on UK - Market size and forecast 2024-2029 ($ million)
          • Data Table on UK - Market size and forecast 2024-2029 ($ million)
          • Chart on UK - Year-over-year growth 2024-2029 (%)
          • Data Table on UK - Year-over-year growth 2024-2029 (%)
        • 13.14 South Korea - Market size and forecast 2024-2029
          • Chart on South Korea - Market size and forecast 2024-2029 ($ million)
          • Data Table on South Korea - Market size and forecast 2024-2029 ($ million)
          • Chart on South Korea - Year-over-year growth 2024-2029 (%)
          • Data Table on South Korea - Year-over-year growth 2024-2029 (%)
        • 13.15 France - Market size and forecast 2024-2029
          • Chart on France - Market size and forecast 2024-2029 ($ million)
          • Data Table on France - Market size and forecast 2024-2029 ($ million)
          • Chart on France - Year-over-year growth 2024-2029 (%)
          • Data Table on France - Year-over-year growth 2024-2029 (%)
        • 13.16 Italy - Market size and forecast 2024-2029
          • Chart on Italy - Market size and forecast 2024-2029 ($ million)
          • Data Table on Italy - Market size and forecast 2024-2029 ($ million)
          • Chart on Italy - Year-over-year growth 2024-2029 (%)
          • Data Table on Italy - Year-over-year growth 2024-2029 (%)
        • 13.17 Canada - Market size and forecast 2024-2029
          • Chart on Canada - Market size and forecast 2024-2029 ($ million)
          • Data Table on Canada - Market size and forecast 2024-2029 ($ million)
          • Chart on Canada - Year-over-year growth 2024-2029 (%)
          • Data Table on Canada - Year-over-year growth 2024-2029 (%)
        • 13.18 Market opportunity by geography
          • Market opportunity by geography ($ million)
          • Data Tables on Market opportunity by geography ($ million)

        14 Drivers, Challenges, and Opportunity/Restraints

        • 14.1 Market drivers
          • 14.2 Market challenges
            • 14.3 Impact of drivers and challenges
              • Impact of drivers and challenges in 2024 and 2029
            • 14.4 Market opportunities/restraints

              15 Competitive Landscape

              • 15.1 Overview
                • 15.2 Competitive Landscape
                  • Overview on criticality of inputs and factors of differentiation
                • 15.3 Landscape disruption
                  • Overview on factors of disruption
                • 15.4 Industry risks
                  • Impact of key risks on business

                16 Competitive Analysis

                • 16.1 Companies profiled
                  • Companies covered
                • 16.2 Company ranking index
                  • Company ranking index
                • 16.3 Market positioning of companies
                  • Matrix on companies position and classification
                • 16.4 ABB Ltd.
                  • ABB Ltd. - Overview
                  • ABB Ltd. - Business segments
                  • ABB Ltd. - Key news
                  • ABB Ltd. - Key offerings
                  • ABB Ltd. - Segment focus
                  • SWOT
                • 16.5 Avnet Inc.
                  • Avnet Inc. - Overview
                  • Avnet Inc. - Business segments
                  • Avnet Inc. - Key offerings
                  • Avnet Inc. - Segment focus
                  • SWOT
                • 16.6 Cisco Systems Inc.
                  • Cisco Systems Inc. - Overview
                  • Cisco Systems Inc. - Business segments
                  • Cisco Systems Inc. - Key news
                  • Cisco Systems Inc. - Key offerings
                  • Cisco Systems Inc. - Segment focus
                  • SWOT
                • 16.7 Coor Service Management Holding AB
                  • Coor Service Management Holding AB - Overview
                  • Coor Service Management Holding AB - Business segments
                  • Coor Service Management Holding AB - Key offerings
                  • Coor Service Management Holding AB - Segment focus
                  • SWOT
                • 16.8 Crestron Electronics Inc.
                  • Crestron Electronics Inc. - Overview
                  • Crestron Electronics Inc. - Product / Service
                  • Crestron Electronics Inc. - Key offerings
                  • SWOT
                • 16.9 DEKOM AG
                  • DEKOM AG - Overview
                  • DEKOM AG - Product / Service
                  • DEKOM AG - Key offerings
                  • SWOT
                • 16.10 Develco Products AS
                  • Develco Products AS - Overview
                  • Develco Products AS - Product / Service
                  • Develco Products AS - Key offerings
                  • SWOT
                • 16.11 Honeywell International Inc.
                  • Honeywell International Inc. - Overview
                  • Honeywell International Inc. - Business segments
                  • Honeywell International Inc. - Key news
                  • Honeywell International Inc. - Key offerings
                  • Honeywell International Inc. - Segment focus
                  • SWOT
                • 16.12 Johnson Controls International Plc
                  • Johnson Controls International Plc - Overview
                  • Johnson Controls International Plc - Business segments
                  • Johnson Controls International Plc - Key news
                  • Johnson Controls International Plc - Key offerings
                  • Johnson Controls International Plc - Segment focus
                  • SWOT
                • 16.13 Komstadt Systems Ltd.
                  • Komstadt Systems Ltd. - Overview
                  • Komstadt Systems Ltd. - Product / Service
                  • Komstadt Systems Ltd. - Key offerings
                  • SWOT
                • 16.14 Koninklijke Philips NV
                  • Koninklijke Philips NV - Overview
                  • Koninklijke Philips NV - Business segments
                  • Koninklijke Philips NV - Key news
                  • Koninklijke Philips NV - Key offerings
                  • Koninklijke Philips NV - Segment focus
                  • SWOT
                • 16.15 Lutron Electronics Co. Inc.
                  • Lutron Electronics Co. Inc. - Overview
                  • Lutron Electronics Co. Inc. - Product / Service
                  • Lutron Electronics Co. Inc. - Key offerings
                  • SWOT
                • 16.16 Schneider Electric SE
                  • Schneider Electric SE - Overview
                  • Schneider Electric SE - Business segments
                  • Schneider Electric SE - Key news
                  • Schneider Electric SE - Key offerings
                  • Schneider Electric SE - Segment focus
                  • SWOT
                • 16.17 Siemens AG
                  • Siemens AG - Overview
                  • Siemens AG - Business segments
                  • Siemens AG - Key news
                  • Siemens AG - Key offerings
                  • Siemens AG - Segment focus
                  • SWOT
                • 16.18 Signify NV
                  • Signify NV - Overview
                  • Signify NV - Business segments
                  • Signify NV - Key news
                  • Signify NV - Key offerings
                  • Signify NV - Segment focus
                  • SWOT

                17 Appendix

                • 17.1 Scope of the report
                  • 17.2 Inclusions and exclusions checklist
                    • Inclusions checklist
                    • Exclusions checklist
                  • 17.3 Currency conversion rates for US$
                    • Currency conversion rates for US$
                  • 17.4 Research methodology
                    • Research methodology
                  • 17.5 Data procurement
                    • Information sources
                  • 17.6 Data validation
                    • Data validation
                  • 17.7 Validation techniques employed for market sizing
                    • Validation techniques employed for market sizing
                  • 17.8 Data synthesis
                    • Data synthesis
                  • 17.9 360 degree market analysis
                    • 360 degree market analysis
                  • 17.10 List of abbreviations
                    • List of abbreviations

                  Research Methodology

                  Technavio presents a detailed picture of the market by way of study, synthesis, and summation of data from multiple sources. The analysts have presented the various facets of the market with a particular focus on identifying the key industry influencers. The data thus presented is comprehensive, reliable, and the result of extensive research, both primary and secondary.

                  INFORMATION SOURCES

                  Primary sources

                  • Manufacturers and suppliers
                  • Channel partners
                  • Industry experts
                  • Strategic decision makers

                  Secondary sources

                  • Industry journals and periodicals
                  • Government data
                  • Financial reports of key industry players
                  • Historical data
                  • Press releases

                  DATA ANALYSIS

                  Data Synthesis

                  • Collation of data
                  • Estimation of key figures
                  • Analysis of derived insights

                  Data Validation

                  • Triangulation with data models
                  • Reference against proprietary databases
                  • Corroboration with industry experts

                  REPORT WRITING

                  Qualitative

                  • Market drivers
                  • Market challenges
                  • Market trends
                  • Five forces analysis

                  Quantitative

                  • Market size and forecast
                  • Market segmentation
                  • Geographical insights
                  • Competitive landscape

                  Interested in this report?

                  Get your sample now to see our research methodology and insights!

                  Download Now

                  Frequently Asked Questions

                  Smart Office Solutions market growth will increase by $ 5047.7 mn during 2025-2029 .

                  The Smart Office Solutions market is expected to grow at a CAGR of 17.1% during 2025-2029 .

                  Smart Office Solutions market is segmented by Product( Smart security systems, Smart EMS, HVAC control systems, Smart lighting systems, Audio-video conferencing systems) Technology( Wireless technologies, Wired technologies, Europe, South America, MEA) Component( Hardware, Software, Service, South America, Middle East and Africa)

                  ABB Ltd., Avnet Inc., Cisco Systems Inc., Coor Service Management Holding AB, Crestron Electronics Inc., DEKOM AG, Develco Products AS, GoBright B V, Honeywell International Inc., Johnson Controls International Plc, Komstadt Systems Ltd., Konig Neurath AG, Koninklijke Philips NV, Lutron Electronics Co. Inc., Schneider Electric SE, Senion AB, Siemens AG, Signify NV, Smart Office Software Solutions, Tata Teleservices Ltd. are a few of the key vendors in the Smart Office Solutions market.

                  APAC will register the highest growth rate of 30% among the other regions. Therefore, the Smart Office Solutions market in APAC is expected to garner significant business opportunities for the vendors during the forecast period.

                  US, China, Japan, Germany, India, South Korea, UK, France, Canada, Italy

                  • Increase in number of startupsThe rise in the number of technology startups entering the market in focus is expected to drive the growth of the market in focus during the forecast period. The growth of the market in focus is mainly driven by the rise in investments in startups by venture capitalists and other companies. Well-established companies in the IT sector are focusing on creating a brand for specialized services by investing in startups. For example is the driving factor this market.
                  • Wipro is the driving factor this market.
                  • one of the leading IT companies is the driving factor this market.
                  • is a key investor in numerous startups is the driving factor this market.
                  • such as Tricentis is the driving factor this market.
                  • an Australian software testing firm is the driving factor this market.
                  • and Drivestream is the driving factor this market.
                  • a cloud services firm based in the US. Similarly is the driving factor this market.
                  • Infosys is investing in startups such as Cloudyn is the driving factor this market.
                  • an Israeli cloud-management firm is the driving factor this market.
                  • and idea Forge Technology is the driving factor this market.
                  • a Mumbai-based drone maker. These startups primarily focus on AI is the driving factor this market.
                  • big data and analytics is the driving factor this market.
                  • and cloud services is the driving factor this market.
                  • which are used for integrating smart office solutions. Thus is the driving factor this market.
                  • the overall increase in the number of startups is expected to drive the growth of the global smart office solutions market during the forecast period. is the driving factor this market.

                  The Smart Office Solutions market vendors should focus on grabbing business opportunities from the Smart security systems segment as it accounted for the largest market share in the base year.