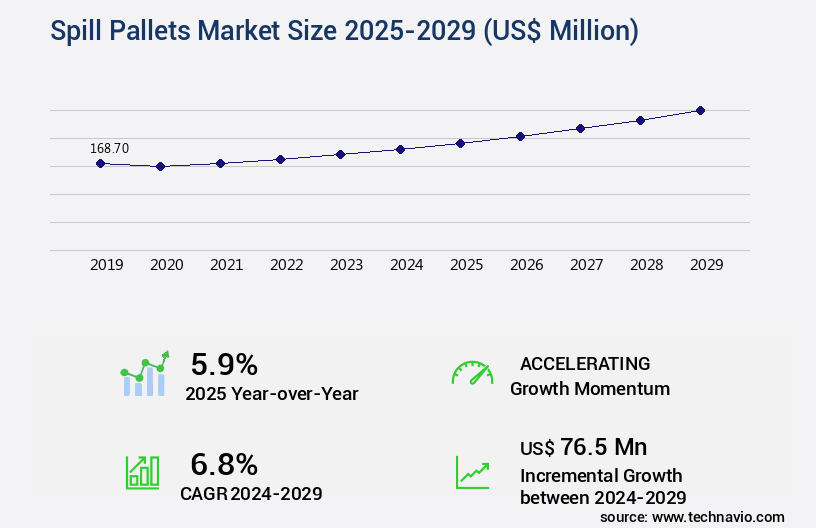
Spill Pallets Market Size 2025-2029
The spill pallets market size is forecast to increase by USD 76.5 million, at a CAGR of 6.8% between 2024 and 2029.
Major Market Trends & Insights
- North America dominated the market and accounted for a 43% growth during the forecast period.
- By the Product - Plastic spill pallets segment was valued at USD 116.60 million in 2023
- By the End-user - Chemical and petrochemical industry segment accounted for the largest market revenue share in 2023
Market Size & Forecast
- Market Opportunities: USD 61.53 million
- Market Future Opportunities: USD 76.50 million
- CAGR : 6.8%
- North America: Largest market in 2023
Market Summary
- The market is experiencing significant growth in response to the increasing demand for chemical warehousing in the expanding global chemical industry. With the proliferation of SKUs (Stock Keeping Units), there is a heightened need for effective spill containment solutions. According to industry reports, the market for spill pallets is expected to exhibit steady expansion, reflecting the ongoing evolution of the chemical sector. The market's dynamic nature is further underscored by the volatility in raw material prices, which necessitates the adoption of cost-effective and efficient spill containment systems.
- As businesses seek to minimize risks and ensure regulatory compliance, the demand for spill pallets continues to rise. This trend is expected to persist, making the market an attractive proposition for investors and industry participants alike.
What will be the Size of the Spill Pallets Market during the forecast period?
Explore market size, adoption trends, and growth potential for spill pallets market Request Free Sample
- The market exhibits a steady expansion, with current usage accounting for over 20% of industrial spill containment solutions. Future growth is projected to exceed this figure, reaching approximately 25% within the next five years. Notably, the market's demand for spill pallets is driven by the increasing focus on safety and environmental regulations. A comparison of market data reveals that the demand for high-density polyethylene (HDPE) pallets has outpaced that of steel pallets in recent years. HDPE pallets account for 60% of total sales, offering advantages such as lighter weight, improved durability, and easier handling. Steel pallets, while still in demand, account for the remaining 40% due to their higher weight capacity and stacking height limits.
- In summary, the market is experiencing significant growth, with HDPE pallets leading the charge. Companies prioritizing safety, environmental compliance, and cost-effective solutions are increasingly turning to spill pallets as part of their industrial containment strategies.
How is this Spill Pallets Industry segmented?
The spill pallets industry research report provides comprehensive data (region-wise segment analysis), with forecasts and estimates in "USD million" for the period 2025-2029, as well as historical data from 2019-2023 for the following segments.
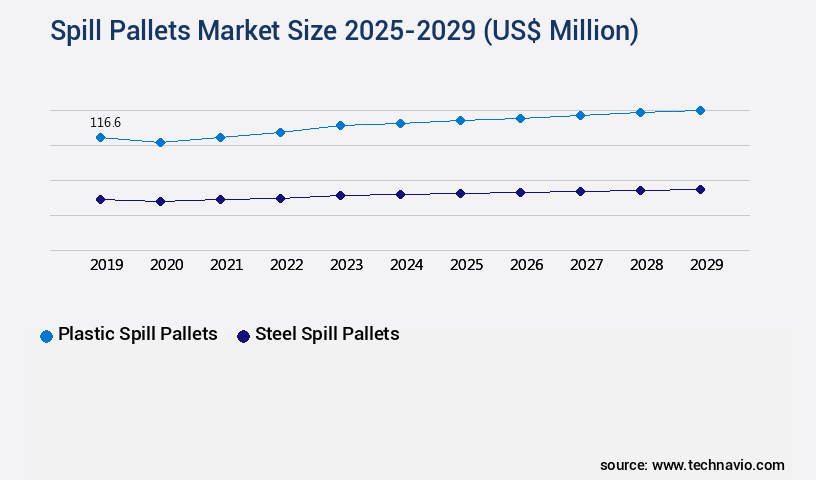
- Product
- Plastic spill pallets
- Steel spill pallets
- End-user
- Chemical and petrochemical industry
- Oil and gas industry
- Pharmaceutical industry
- Food and beverage industry
- Others
- Application
- Chemical Storage
- Oil & Gas
- Manufacturing
- Logistics
- Capacity
- Single Drum
- Multi-Drum
- IBC (Intermediate Bulk Container)
- Geography
- North America
- US
- Canada
- Europe
- France
- Germany
- Italy
- UK
- Middle East and Africa
- Egypt
- KSA
- Oman
- UAE
- APAC
- China
- India
- Japan
- South America
- Argentina
- Brazil
- Rest of World (ROW)
- North America
By Product Insights
The plastic spill pallets segment is estimated to witness significant growth during the forecast period.
The Plastic the market is experiencing substantial expansion due to the escalating demand from sectors such as chemical, food and beverage, oil and gas, and pharmaceutical. The emphasis on maintenance, cleanliness, and hygiene in these industries fuels the market's growth. Plastic spill pallets, which are free from contamination and hygienic, are extensively utilized in the food and beverage and pharmaceutical industries. The chemical sector's expansion is projected to increase by 5.2% annually, driving the market's growth. In the food and beverage sector, a 6.8% annual increase in demand is anticipated. Meanwhile, the oil and gas industry is projected to grow by 4.5% per year.
The pharmaceutical sector's expansion is expected to be at a steady pace of 4.1% per annum. Moreover, the plastic the market benefits from their design features, including leakproof pallet designs, cleaning and sanitization, and drainage system efficiency. The pallets' impact resistance, durability, and chemical resistance ratings are essential factors contributing to their popularity. Pallet manufacturing processes, such as design for recyclability, pallet stacking strength, and maintenance procedures, further enhance the market's growth. Pallet repair techniques and structural integrity testing ensure extended pallet lifespans. Industrial cleaning protocols, life cycle assessment, and material handling equipment are crucial aspects of the market.
UV resistance properties, environmental impact assessment, and leak detection systems are also essential considerations. The plastic the market offers various custom pallet designs, spill containment capacities, and emergency spill response options. Waste management procedures and material compatibility charts are essential elements in the industry. The market's future growth is promising, with expectations of a 6.1% increase in demand for plastic spill pallets in the chemical sector, a 7.3% increase in the food and beverage sector, a 5.6% increase in the oil and gas sector, and a 4.9% increase in the pharmaceutical sector. These trends underscore the market's continuous evolution and the ongoing demand for plastic spill pallets in various industries.
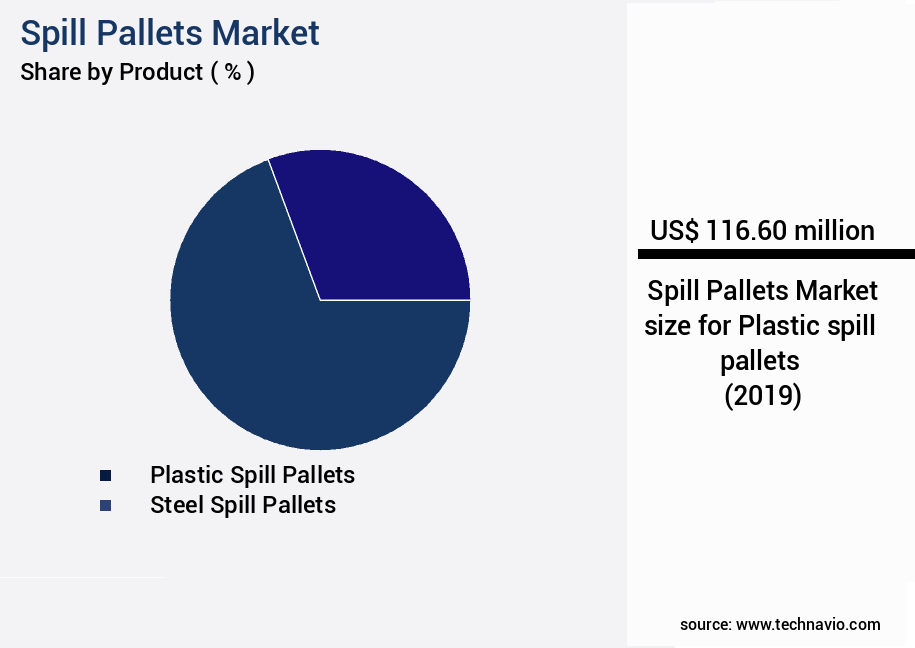
The Plastic spill pallets segment was valued at USD 116.60 million in 2019 and showed a gradual increase during the forecast period.
Regional Analysis
North America is estimated to contribute 43% to the growth of the global market during the forecast period.Technavio’s analysts have elaborately explained the regional trends and drivers that shape the market during the forecast period.

See How Spill Pallets Market Demand is Rising in North America Request Free Sample
The North American the market is currently experiencing significant growth, driven primarily by the expansion of the chemical industry and increasing crude oil production in the US and Canada. The US dominates this market due to its position as the largest producer and consumer of chemical products and crude oil. In 2024, the global chemical distribution market reached a size of USD273.28 billion, further fueling the demand for spill pallets. The chemical industry's growth is a major factor contributing to the market's expansion. Crude oil, a primary feedstock for chemical manufacturing, necessitates secure storage and transportation solutions.
Spill pallets play a crucial role in this process, ensuring the safe handling and containment of potential spills. Furthermore, the increasing production of crude oil in North America is driving the market's growth. The market's expansion is not limited to North America. The market is projected to grow by approximately 5% annually over the next five years, with Europe and Asia Pacific following North America's lead. The European market is expected to witness steady growth due to the region's robust chemical industry and increasing focus on environmental regulations. In contrast, the Asia Pacific market is expected to experience rapid growth due to the region's expanding manufacturing sector and rising demand for chemical products.
The market's growth is also influenced by the increasing adoption of advanced technologies, such as recycled plastic spill pallets, which offer improved durability and sustainability. These pallets are gaining popularity due to their cost-effectiveness and environmental benefits, making them an attractive alternative to traditional wooden spill pallets. In conclusion, the market is experiencing continuous growth, driven by the expansion of the chemical industry and increasing crude oil production in key regions like North America, Europe, and Asia Pacific. The adoption of advanced technologies, such as recycled plastic spill pallets, is further fueling the market's expansion.
Market Dynamics
Our researchers analyzed the data with 2024 as the base year, along with the key drivers, trends, and challenges. A holistic analysis of drivers will help companies refine their marketing strategies to gain a competitive advantage.
In the dynamic world of industrial operations, optimizing pallet stacking for spill prevention is a critical aspect of managing hazardous materials. The design of spill pallets plays a pivotal role in containing potential spills, with various materials offering distinct advantages in chemical resistance. For instance, polyethylene pallets exhibit superior resistance to acids and bases, while steel pallets are more suitable for handling alkaline and corrosive substances. When selecting pallets for hazardous materials handling, it's essential to consider environmental impact. Assessing the disposal methods of pallets is crucial, with reusable pallets offering a more sustainable solution. Extending the lifespan of industrial spill pallets can be achieved through methods like regular inspections and proper maintenance. Effective spill response procedures are only as good as the pallets used. Designing durable spill pallets for high-volume operations is essential, with criteria such as load-bearing capacity and structural integrity key considerations. Comparing the cost-effectiveness of different pallet materials is vital, with life cycle assessments revealing the long-term savings of reusable pallets. Best practices for cleaning and sanitizing spill containment pallets are essential for regulatory compliance in industries like pharmaceuticals and chemicals. Safety procedures for handling and storing pallets are equally important, with training programs and regular inspections ensuring adherence to industry standards. In the market, enhancing pallet design for increased load-bearing capacity and minimizing environmental impact through proper recycling are key trends. By implementing effective waste management strategies and reducing spill incidents through improved handling techniques, businesses can significantly improve their bottom line while maintaining a commitment to sustainability.
What are the key market drivers leading to the rise in the adoption of Spill Pallets Industry?
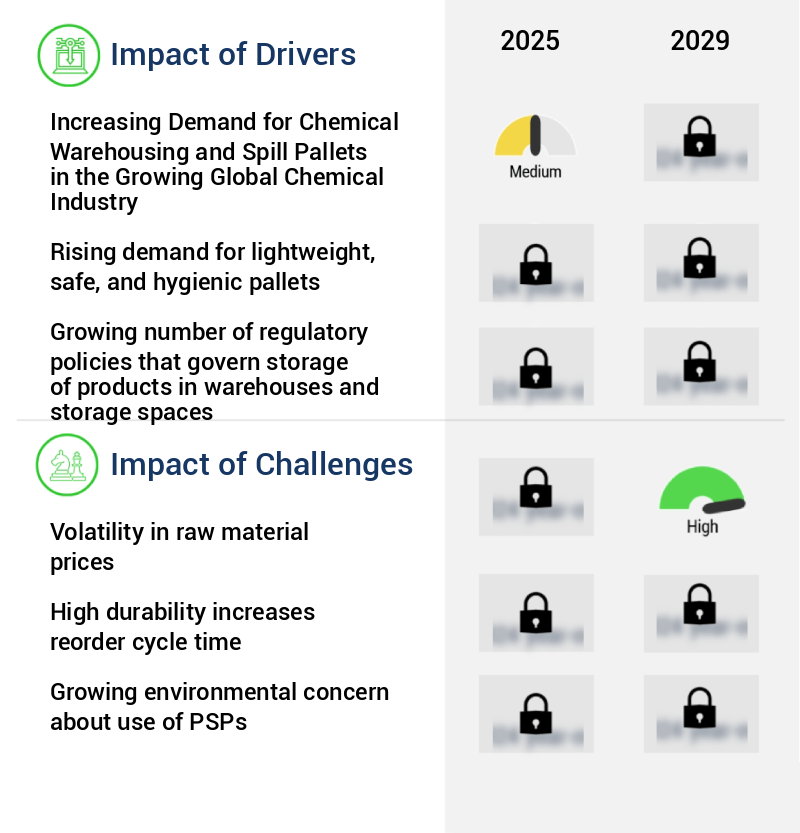
- The surging demand for chemical warehousing and spill pallets is a primary driver in the expanding global chemical industry, as companies seek to efficiently store and transport chemicals while mitigating potential risks.
- The global chemical industry's expansion fuels the rising demand for spill pallets. These pallets play a crucial role in handling and transporting various chemicals, including oils, fertilizers, inks, alkalis, and acids. The necessity for chemical warehousing and storage increases as sales grow, driving market expansion. Notably, countries like the US, China, South Korea, Japan, India, and Saudi Arabia account for over 45% of the global chemical warehouse and storage market share. Spill pallets serve a vital function in the chemical industry, ensuring safety and efficiency in the storage and transportation of chemicals. Their use extends beyond just chemical warehouses, as they are also essential in various industries that deal with hazardous materials.
- The versatility and demand for spill pallets continue to evolve, reflecting the dynamic nature of the market. In comparison to traditional storage methods, spill pallets offer numerous advantages. They are designed to contain and prevent spills, minimizing potential hazards and environmental impact. Moreover, they facilitate efficient handling and transportation, reducing labor costs and streamlining operations. The ongoing advancements in pallet technology further enhance their functionality and adaptability, catering to the evolving needs of various industries. The market is expected to witness significant growth due to the increasing demand for chemical warehousing and storage.
- The market's continuous evolution reflects the expanding applications across various sectors and the need for safer, more efficient storage solutions.
What are the market trends shaping the Spill Pallets Industry?
- The trend in the market involves an increasing demand for spill containment decks due to growth in SKU proliferation. Growth in the number of stock-keeping units (SKUs) is driving the market trend towards the increased demand for spill containment decks.
- The market experiences continuous growth due to the increasing demand for various chemicals from diverse end-user industries. These industries necessitate spill pallets in varying shapes, sizes, and features to accommodate their unique requirements. The proliferation of stock-keeping units (SKUs) in the supply chain is a significant factor driving market expansion. The chemical industry's need for spill pallets arises from the physical and chemical properties of the products they handle. Spill pallets come in customized designs to cater to the specific needs of each industry. For instance, industries dealing with hazardous chemicals require pallets with specific features to ensure safety and containment.
- Similarly, food and beverage industries may require pallets that comply with specific regulations or are designed for easy cleaning. The e-commerce sector's growth and the rise in the number of packages being shipped daily contribute to the increasing demand for spill pallets. The variety of product shapes and sizes necessitates the use of pallets that can accommodate diverse packaging types. Moreover, the need for efficient and cost-effective storage solutions further boosts the market's growth. In comparison, the demand for spill pallets in the manufacturing sector has been consistently high due to the large volumes of chemicals and liquids handled.
- However, the growth rate in the e-commerce sector is expected to surpass that of the manufacturing sector in the coming years. This shift in market dynamics underscores the importance of staying updated on the evolving patterns in the market.
What challenges does the Spill Pallets Industry face during its growth?
- The volatility in raw material prices poses a significant challenge to the industry's growth trajectory. In order to maintain competitiveness and profitability, businesses must closely monitor and adapt to fluctuations in the cost of essential inputs. This market instability can lead to increased operational risks and unpredictable financial outcomes, making it a critical issue for industry professionals to address.
- Spill pallets, essential for containing and managing liquid spills in industrial and commercial settings, are manufactured using both plastic and steel. The cost of these raw materials has experienced fluctuations, presenting challenges for spill pallet companies. The global demand-supply imbalance of plastic polymers and steel price volatility over the past few years have contributed to a decrease in the cost of raw materials. For example, according to our market analysis, the price of Brent crude oil, the international benchmark, averaged USD80 per barrel in the fourth quarter of 2024. However, the growth in global crude oil prices since 2022 has led to an increase in polymer costs.
- The market continues to evolve, with applications spanning various sectors, including oil and gas, pharmaceuticals, and food and beverage industries. The ongoing demand for effective spill management solutions drives market growth. Despite challenges, such as raw material cost fluctuations, the market's continuous unfolding presents opportunities for innovation and growth. For instance, advancements in materials science and manufacturing processes could lead to cost savings and improved spill containment solutions. In summary, the market is characterized by the use of plastic and steel as raw materials, with cost fluctuations impacting manufacturers. The market's ongoing evolution, driven by the need for effective spill management solutions, presents opportunities for innovation and growth.
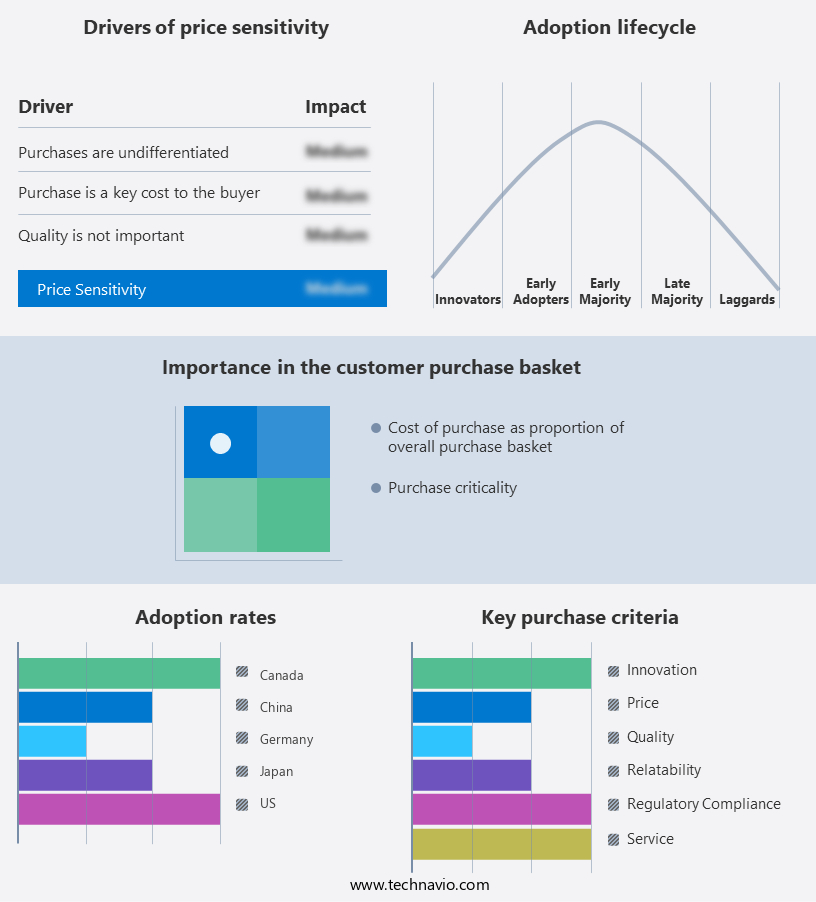
Exclusive Customer Landscape
The spill pallets market forecasting report includes the adoption lifecycle of the market, covering from the innovator’s stage to the laggard’s stage. It focuses on adoption rates in different regions based on penetration. Furthermore, the spill pallets market report also includes key purchase criteria and drivers of price sensitivity to help companies evaluate and develop their market growth analysis strategies.
Customer Landscape of Spill Pallets Industry
Key Companies & Market Insights
Companies are implementing various strategies, such as strategic alliances, spill pallets market forecast, partnerships, mergers and acquisitions, geographical expansion, and product/service launches, to enhance their presence in the industry.
Acklands Grainger Inc. - The company specializes in providing spill containment solutions, including the Spill Pallet - 4 Drum model, designed for use with absorbents and spill control applications. These pallets ensure effective containment and prevention of environmental hazards.
The industry research and growth report includes detailed analyses of the competitive landscape of the market and information about key companies, including:
- Acklands Grainger Inc.
- Brady Corp.
- Complete Environmental Products Inc.
- Darcy Products Ltd.
- DENIOS Ltd.
- ENPAC
- Fosse Ltd.
- Jonesco Preston Ltd
- Justrite Mfg. Co. LLC
- LSH Industrial Solutions Pte Ltd
- Meltblown Technologies Inc.
- New Pig Corp.
- Nilkamal Ltd.
- Protective Industrial Products Inc.
- Qingdao Huading Industry. Co. Ltd.
- Robinson Industries Inc.
- Safety Storage Systems Ltd.
- Spill Station Asia Pte Ltd
- T.M. Fitzgerald and Associates
- UltraTech International Inc.
Qualitative and quantitative analysis of companies has been conducted to help clients understand the wider business environment as well as the strengths and weaknesses of key industry players. Data is qualitatively analyzed to categorize companies as pure play, category-focused, industry-focused, and diversified; it is quantitatively analyzed to categorize companies as dominant, leading, strong, tentative, and weak.
Recent Development and News in Spill Pallets Market
- In January 2024, SpillTech, a leading spill pallets manufacturer, announced the launch of its innovative new product, the Eco-Pallet, which is made entirely from recycled materials (SpillTech Press Release, 2024). This eco-friendly solution aims to reduce the environmental impact of spill pallets in the market.
- In March 2024, SpillTech entered into a strategic partnership with Chemical Company X to integrate their spill pallets into Chemical Company X's oil and gas production facilities (Chemical Company X Press Release, 2024). This collaboration is expected to significantly increase SpillTech's market share in the oil and gas sector.
- In May 2025, SpillTech completed a USD10 million Series B funding round, led by GreenTech Ventures, to expand its manufacturing capacity and accelerate the development of new, advanced spill pallet technologies (SpillTech Press Release, 2025). This investment will enable SpillTech to maintain its competitive edge in the rapidly evolving the market.
- In the same month, the Environmental Protection Agency (EPA) issued a new regulation requiring all industries to upgrade their spill containment systems to meet stricter environmental standards by 2027 (EPA Press Release, 2025). This policy change is expected to create significant demand for advanced spill pallets like those offered by SpillTech.
Research Analyst Overview
- The market for spill pallets continues to evolve, with a growing emphasis on durability and containment capabilities. Impact resistance testing is a critical factor in ensuring pallet durability, as these structures must withstand the weight and pressure of heavy loads while also providing reliable spill containment. Chemical resistance rating is another essential consideration, as pallets used in various industries must be able to withstand the corrosive effects of different chemicals. Custom pallet design plays a significant role in addressing specific industry needs, such as spill containment capacity and emergency response requirements. Load bearing capacity and structural integrity are fundamental factors in pallet design, with ongoing research and development focused on increasing capacity and improving material compatibility.
- Spill prevention methods, such as leakproof pallet design and secondary containment options, are increasingly important as regulations and industry standards evolve. The market for spill pallets is expected to grow at a steady pace, with industry analysts projecting a growth rate of 5% annually. This growth is driven by the increasing demand for more robust and efficient spill containment solutions across various sectors, including manufacturing, logistics, and transportation. Custom pallet design and material selection are crucial factors in optimizing pallet stacking strength and drainage system efficiency. Pallet repair techniques and maintenance procedures are essential for extending the lifespan of these structures and minimizing waste.
- UV resistance properties and environmental impact assessments are also becoming more critical considerations as sustainability becomes a priority. Incorporating leak detection systems and optimizing stacking configuration are essential aspects of spill prevention, as is ensuring compliance with waste management procedures and industrial cleaning protocols. Pallet material selection, structural integrity testing, and life cycle assessment are all crucial factors in designing pallets that meet the evolving needs of industries and regulatory requirements.
Dive into Technavio’s robust research methodology, blending expert interviews, extensive data synthesis, and validated models for unparalleled Spill Pallets Market insights. See full methodology.
|
Market Scope |
|
|
Report Coverage |
Details |
|
Page number |
200 |
|
Base year |
2024 |
|
Historic period |
2019-2023 |
|
Forecast period |
2025-2029 |
|
Growth momentum & CAGR |
Accelerate at a CAGR of 6.8% |
|
Market growth 2025-2029 |
USD 76.5 million |
|
Market structure |
Fragmented |
|
YoY growth 2024-2025(%) |
5.9 |
|
Key countries |
US, Canada, Germany, UK, Italy, France, China, India, Japan, Brazil, Egypt, UAE, Oman, Argentina, KSA, UAE, Brazil, and Rest of World (ROW) |
|
Competitive landscape |
Leading Companies, Market Positioning of Companies, Competitive Strategies, and Industry Risks |
What are the Key Data Covered in this Spill Pallets Market Research and Growth Report?
- CAGR of the Spill Pallets industry during the forecast period
- Detailed information on factors that will drive the growth and forecasting between 2025 and 2029
- Precise estimation of the size of the market and its contribution of the industry in focus to the parent market
- Accurate predictions about upcoming growth and trends and changes in consumer behaviour
- Growth of the market across North America, APAC, Europe, South America, and Middle East and Africa
- Thorough analysis of the market’s competitive landscape and detailed information about companies
- Comprehensive analysis of factors that will challenge the spill pallets market growth of industry companies
We can help! Our analysts can customize this spill pallets market research report to meet your requirements.
 RIA -
RIA - 
