
Sports Software Market Size 2024-2028
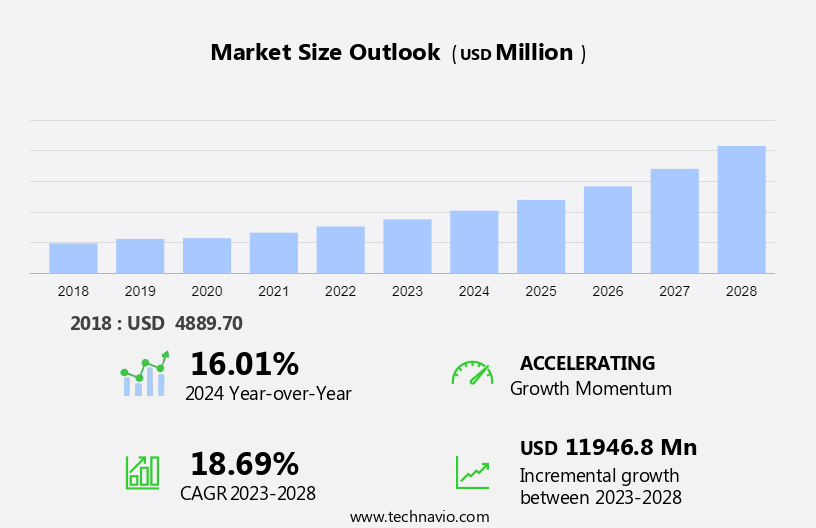
The sports software market size is forecast to increase by USD 11.95 billion, at a CAGR of 18.69% between 2023 and 2028.
- The market is experiencing significant growth due to the increasing need for teams and organizations to enhance their competitive strategies. A key trend in this market is the emergence of machine learning and artificial intelligence technologies, which enable advanced data analysis and predictive modeling for player performance, injury prevention, and fan engagement. However, data privacy and security concerns remain a challenge, as sensitive athlete and fan information must be protected. Additionally, the integration of software solutions with various sports equipment and wearables is another area of focus for market growth. Overall, the market is poised for continued expansion as technology increasingly plays a crucial role in optimizing team performance and fan experience.
What will be the Size of the Sports Software Market During the Forecast Period?
- The market is a dynamic and growing industry that caters to the needs of various sports entities, including Games, Leagues, Clubs, Sports associations, Sports academies, Coaches, and Athletes. This market offers a range of software solutions that help streamline administrative tasks, manage player performance, and provide real-time feeds and visualization of statistics during sports tournaments. The software solutions in this market include online registration systems, audio and video analysis tools, and prediction and pre-event review platforms. Big data analytics plays a crucial role in sports Analytics, enabling coaches and sports organizations to gain valuable insights and make data-driven decisions.
- Moreover, the market offers scheduling software to manage fixtures and training sessions, ticketing systems to manage fan engagement, and prediction tools to help teams and athletes prepare for upcoming events. Overall, the market is a vital component of the sports ecosystem, providing tools to enhance the performance of athletes, streamline administrative tasks, and engage fans.
How is this Sports Software Industry segmented and which is the largest segment?
The sports software industry research report provides comprehensive data (region-wise segment analysis), with forecasts and estimates in "USD billion" for the period 2024-2028, as well as historical data from 2018-2022 for the following segments.
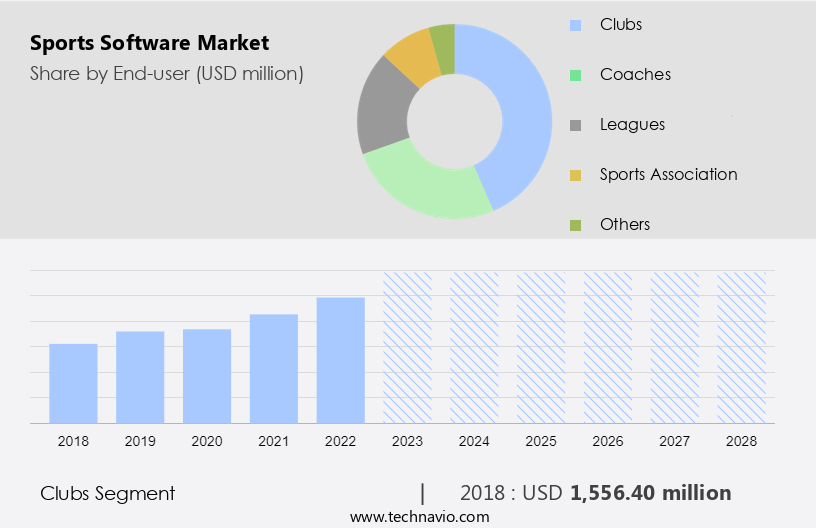
- End-user
- Clubs
- Coaches
- Leagues
- Sports association
- Others
- Deployment
- Cloud-based
- On-premises
- Geography
- North America
- Canada
- US
- Europe
- Germany
- APAC
- China
- Japan
- South America
- Middle East and Africa
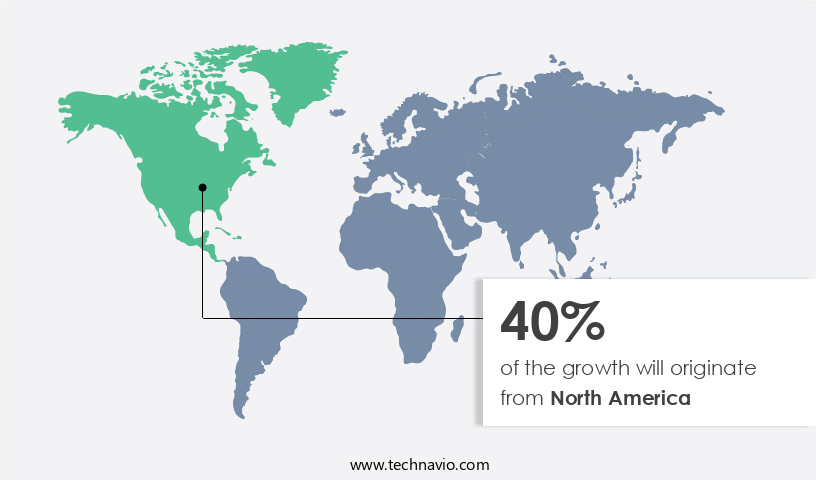
- North America
By End-user Insights
- The clubs segment is estimated to witness significant growth during the forecast period.
The global sports industry is increasingly leveraging machine learning and artificial intelligence to enhance performance, fan engagement, and operational efficiency. Sports software plays a pivotal role in this digital transformation, catering to various needs of sports managers, youth sports organizations, and professional teams alike. These solutions facilitate real-time feeds, visualization, prediction, and advanced analytics, enabling success in sports tournaments and marketing strategies. Sports software is essential for managing administrative tasks, scheduling, statistics, training, ticketing, and game strategy. Cloud-based platforms offer access to big data analytics, enabling real-time platform usage for sports analytics, coaching, and athlete performance tracking. Additionally, smart stadiums and online gaming platforms are integrating sports software for IoT-enabled services, sports betting, and sports video software.
Major sports organizations, including professional, collegiate, and youth teams, use sports software for streamlining operations. For instance, LeagueOne sports software by Active Network offers features like online registrations, creating rosters, team management, and document uploading. ClubReg, an online registration module integrated with LeagueOne, simplifies the registration process for teams, audiences, and club managers. Machine learning and AI-driven sports software are revolutionizing the sports sector by providing real-time insights, predictive analytics, and personalized experiences for athletes, teams, and fans. This technology is expected to continue influencing the sports industry, propelling growth and innovation.
Get a glance at the Sports Software Industry report of share of various segments Request Free Sample
The clubs segment was valued at USD 1.56 billion in 2018 and showed a gradual increase during the forecast period.
Regional Analysis
- North America is estimated to contribute 40% to the growth of the global market during the forecast period.
Technavio's analysts have elaborately explained the regional trends and drivers that shape the market during the forecast period.
For more insights on the market share of various regions, Request Free Sample
The sports industry is witnessing significant advancements with the integration of machine learning and artificial intelligence. Global sports organizations, including professional, collegiate, and youth sports teams, are leveraging these technologies to enhance their operations and gain a competitive edge. Machine learning and AI enable real-time feed analysis, prediction, and visualization of sports data, providing valuable insights for sports managers to make informed decisions. Sports analytics software is a crucial component of this transformation, offering advanced analytics for scheduling, statistics, training, and administrative tasks. Big data analytics is used to gain insights into marketing strategies, TV ratings, game strategy, and success.
In addition, AI and machine learning also power smart stadiums, online gaming, and sports betting software. Machine learning algorithms can analyze audio and video data to provide real-time player performance metrics, enabling coaches to make data-driven decisions. Cloud-based sports software and the Internet of Things enable remote access to data, allowing teams to collaborate and make decisions in real-time. These technologies are revolutionizing the sports sector by streamlining administrative tasks, improving training, and enhancing the fan experience.
Market Dynamics
Our researchers analyzed the data with 2023 as the base year, along with the key drivers, trends, and challenges. A holistic analysis of drivers will help companies refine their marketing strategies to gain a competitive advantage.
What are the key market drivers leading to the rise In the adoption of Sports Software Industry?
The increasing need to improve competitive strategies in sports is the key driver of the market.
- In the dynamic sports industry, software companies are adapting customer-focused pricing strategies to remain competitive. Value-based pricing models are increasingly popular, as they align with customer demand and perception of value. The delivery and cost of sports software are determined by the company's ability to provide unique benefits to customers.
- Economic and market factors, such as the emphasis on return on investment, limited IT budgets, and the availability of free models like open source, influence the adoption of sports software. Constrained budgets and customer perceptions of high software costs are putting pressure on pricing. Two primary deployment models, cloud-based and on-premise, offer flexibility for sports media companies to choose the best fit for their specific needs and budgets.
What are the market trends shaping the Sports Software Industry?
The emergence of machine learning in sports software is the upcoming market trend.
- The market is experiencing significant growth due to the increasing adoption of advanced technologies such as blockchain, virtual reality, and artificial intelligence, particularly machine learning tools. These technologies are revolutionizing the way sports media companies operate, enabling them to provide more accurate and personalized content to consumers. Major companies In the market are investing heavily in machine learning algorithms and predictive analytics to enhance their offerings. Machine learning models can analyze vast amounts of data from various sources, including player performance and weather, to make real-time predictions with high accuracy.
- This not only improves the efficiency of sports operations but also enhances the fan experience by providing more accurate and timely information. The market is expected to continue growing as technology continues to advance and consumer demand for more personalized sports experiences increases. Cloud-based deployment and on-premise deployment options are also gaining popularity, offering flexibility and scalability to meet the varying needs of different organizations.
What challenges does the Sports Software Industry face during its growth?
Data privacy and security concerns is a key challenge affecting the industry growth.
- The market is witnessing significant growth due to the increasing adoption of advanced technologies In the sports industry. Two deployment models, cloud-based and on-premise, are popular among sports media companies. Cloud-based deployment offers benefits such as scalability, flexibility, and cost savings. However, data privacy and security risks are major concerns for sports organizations, particularly In the case of cloud services. Cloud infrastructure, which is based on numerous open-source codes, presents a high risk of introducing flaws and vulnerabilities.
- Public clouds, which are multi-tenant and share resources, are more susceptible to security breaches due to the potential for hackers to gain access to data storage systems. Companies must prioritize cloud security management to address these concerns and ensure the protection of sensitive sports data.
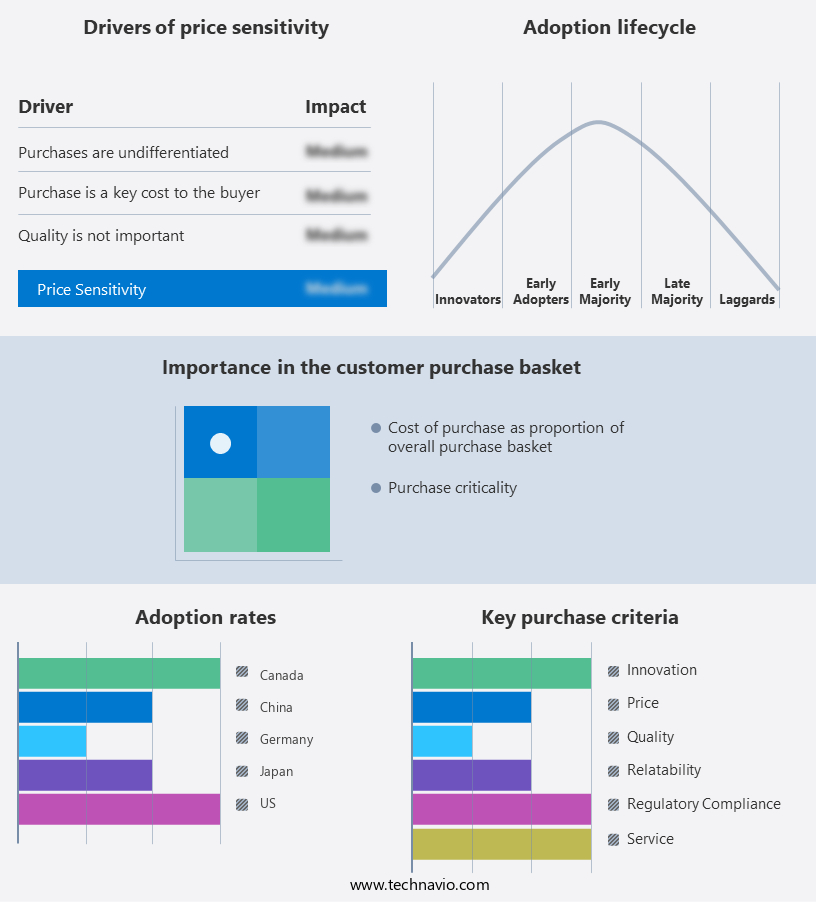
Exclusive Customer Landscape
The sports software market forecasting report includes the adoption lifecycle of the market, covering from the innovator's stage to the laggard's stage. It focuses on adoption rates in different regions based on penetration. Furthermore, the sports software market report also includes key purchase criteria and drivers of price sensitivity to help companies evaluate and develop their market growth analysis strategies.
Customer Landscape
Key Companies & Market Insights
Companies are implementing various strategies, such as strategic alliances, sports software market forecast, partnerships, mergers and acquisitions, geographical expansion, and product/service launches, to enhance their presence In the industry.
The industry research and growth report includes detailed analyses of the competitive landscape of the market and information about key companies, including:
- Constellation Software Inc.
- Daktronics Inc.
- Digital Edge Sport Inc.
- EDGE10 Group Ltd.
- Engage Sports LLC
- Global Payments Inc.
- International Business Machines Corp.
- Jevin
- LeagueApps Inc.
- SAP SE
- SPay Inc.
- Sport 80 Services Ltd
- Sportlyzer LLC
- SportsEngine Inc.
- Stats Perform group of companies
- Team Topia Inc.
- TeamSideline.com
- TeamSnap Inc.
- TopDog Sports
- Upper Hand Inc.
Qualitative and quantitative analysis of companies has been conducted to help clients understand the wider business environment as well as the strengths and weaknesses of key industry players. Data is qualitatively analyzed to categorize companies as pure play, category-focused, industry-focused, and diversified; it is quantitatively analyzed to categorize companies as dominant, leading, strong, tentative, and weak.
Research Analyst Overview
Sports software has become an integral part of the sports industry, revolutionizing the way Games, Leagues, Clubs, Sports associations, and Sports academies operate. From Teamwork and Player performance to Online registration and Team management, sports software solutions offer a multitude of benefits. Features like Member database access, Game scheduling, Online payment processing, and Digital transformation enable efficient Sports management. With the ongoing Digital revolution, Cloud-based services have gained popularity, providing access to Match statistics and Match-related data from anywhere.
Further, the tourism sector and Local stadiums have also embraced sports software, implementing Social distance protocols during the Lockdown. Sports management software caters to various sports, including baseball, hockey, soccer, basketball, rugby, field soccer, volleyball, netball, ice hockey, and vricket. Coaches can use these tools to analyze player performance and strategize effectively. Software-based services have seen significant penetration, offering good experiences and raw fan interaction. The future of sports is undeniably digital, and sports software is leading the charge.
|
Market Scope |
|
|
Report Coverage |
Details |
|
Page number |
175 |
|
Base year |
2023 |
|
Historic period |
2018-2022 |
|
Forecast period |
2024-2028 |
|
Growth momentum & CAGR |
Accelerate at a CAGR of 18.69% |
|
Market Growth 2024-2028 |
USD 11.95 billion |
|
Market structure |
Fragmented |
|
YoY growth 2023-2024(%) |
16.01 |
|
Key countries |
US, China, Germany, Japan, and Canada |
|
Competitive landscape |
Leading Companies, Market Positioning of Companies, Competitive Strategies, and Industry Risks |
What are the Key Data Covered in this Sports Software Market Research and Growth Report?
- CAGR of the Sports Software industry during the forecast period
- Detailed information on factors that will drive the market growth and forecasting between 2024 and 2028
- Precise estimation of the size of the market and its contribution of the industry in focus to the parent market
- Accurate predictions about upcoming growth and trends and changes in consumer behaviour
- Growth of the market across North America, Europe, APAC, South America, and Middle East and Africa
- Thorough analysis of the market's competitive landscape and detailed information about companies
- Comprehensive analysis of factors that will challenge the sports software market growth of industry companies
We can help! Our analysts can customize this sports software market research report to meet your requirements.
 RIA -
RIA - 
