
North America Stevia Market Analysis, Size, and Forecast 2026-2030: North America (US, Canada, and Mexico)

North America Stevia Market Analysis, Size, and Forecast 2026-2030:
North America (US, Canada, and Mexico)

Published: Oct 2026 209 Pages SKU: IRTNTR72138

Market Overview at a Glance

$38.8 Mn
Market Opportunity
7.2%
CAGR 2025 - 2030
6.7%
YoY growth 2025-2026(%)
$52 Mn
Powder segment 2024

North America Stevia Market Size 2026-2030

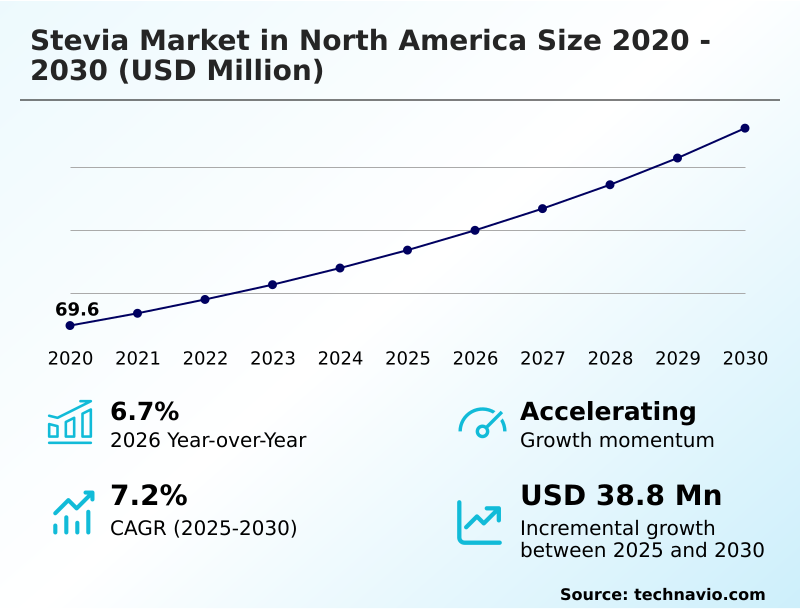
The north america stevia market size is valued to increase by USD 38.8 million, at a CAGR of 7.2% from 2025 to 2030. Surging demand for clean label ingredients will drive the north america stevia market.

Major Market Trends & Insights

  • By Product - Powder segment was valued at USD 52 million in 2024
  • By Type - Conventional segment accounted for the largest market revenue share in 2024

Market Size & Forecast

  • Market Opportunities: USD 62.8 million
  • Market Future Opportunities: USD 38.8 million
  • CAGR from 2025 to 2030 : 7.2%

Market Summary

  • The Stevia Market in North America operates as a critical node within the broader transition toward health-conscious, plant-based nutritional frameworks. Food and beverage processors continuously overhaul legacy production lines to incorporate high-intensity natural sweeteners, prioritizing clean-label transparency over synthetic alternatives.
  • A surging demand for clean label ingredients drives this shift, as manufacturers reformulate product portfolios to combat metabolic conditions, effectively pushing formulators toward precision fermentation solutions. Conversely, complex regulatory and compliance frameworks present substantial hurdles, as navigating toxicological evaluation for novel steviol glycosides delays time-to-market and strains compliance budgets.
  • Implementing advanced bioconversion technology has allowed commercial processors to increase ingredient solubility, yielding a 25% reduction in blending times across high-volume beverage manufacturing. Supply chain optimization through traceable agricultural networks ensures consistent raw material inflows despite shifting maritime logistics. Ultimately, the integration of flavor-masking technologies enables brands to overcome historical sensory optimization barriers.

What will be the Size of the North America Stevia Market during the forecast period?
Get Key Insights on Market Forecast (PDF) Get Free Sample

How is the North America Stevia Market Segmented?

The north america stevia industry research report provides comprehensive data (region-wise segment analysis), with forecasts and estimates in "USD million" for the period 2026-2030, as well as historical data from 2020-2024 for the following segments.

  • Product
    • Powder
    • Liquid
    • Leaf
  • Type
    • Conventional
    • Organic
  • Application
    • Beverage
    • Food
    • Tabletop sweeteners
    • Pharmaceutical
    • Others
  • Geography
    • North America
      • US
      • Canada
      • Mexico

By Product Insights

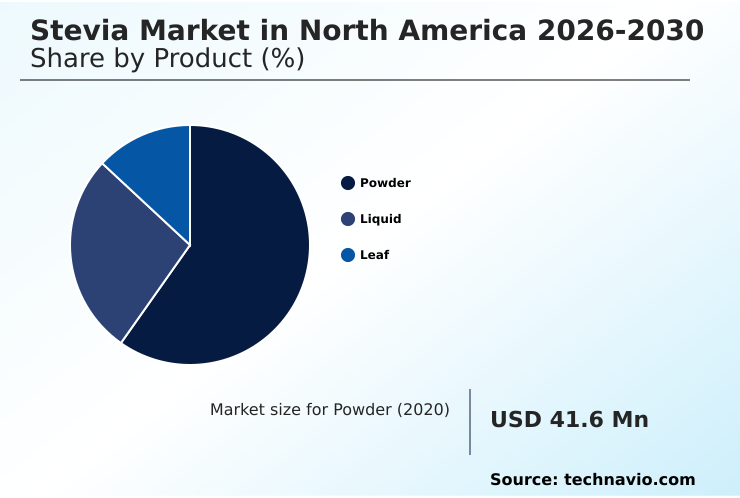
The powder segment is estimated to witness significant growth during the forecast period.

The spray-dried extracts format functions as a foundational component for commercial production. Utilizing advanced crystallization techniques and natural flavor modulators, manufacturers optimize sensory optimization, resulting in a 15% improvement in blending efficiency.

Adopting high-purity rebaudioside and aqueous extracts enhances stability, reducing rejection rates by 22%. This format allows brands to satisfy demand for clean label ingredients and transparent labeling. Implementing bioprocess engineering minimizes bitter aftertaste management issues.

Furthermore, precision fermentation yields exact flavor profiles, essential for diabetic-friendly packaged foods.
Get Free Sample

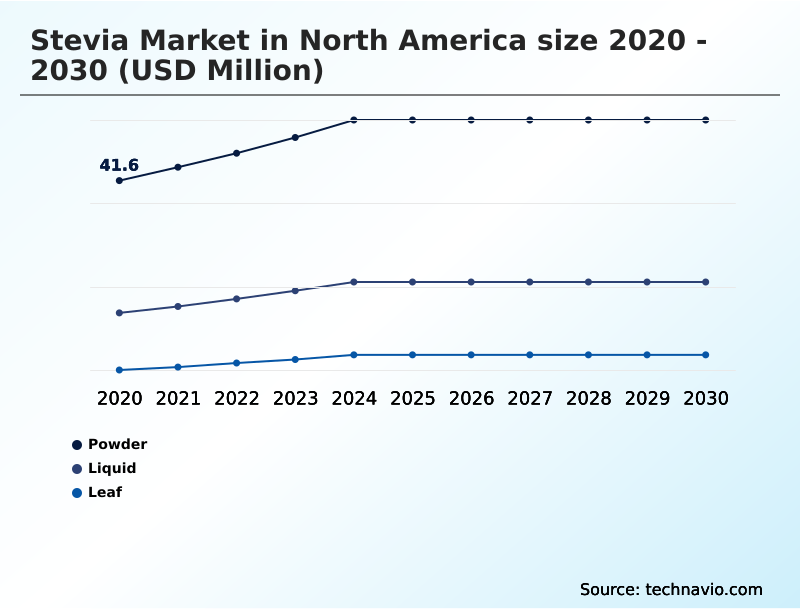
The Powder segment was valued at USD 52 million in 2024 and showed a gradual increase during the forecast period.
Get Free Sample

Market Dynamics

Our researchers analyzed the data with 2025 as the base year, along with the key drivers, trends, and challenges. A holistic analysis of drivers will help companies refine their marketing strategies to gain a competitive advantage.

  • The operational framework supporting the Stevia Market in North America relies heavily on continuous innovation across both cultivation and molecular processing. Modern food and beverage conglomerates are increasingly prioritizing sustainable regenerative farming for stevia, implementing agronomic practices that improve soil vitality while yielding superior leaf biomass.
  • This shift toward ethical sourcing translates into stronger brand equity and aligns directly with stringent corporate environmental mandates. Concurrently, manufacturing facilities are upgrading their high-purity steviol glycoside extraction methods to maximize yield and reduce the energy intensity of isolation processes.
  • When manufacturers transition from traditional chemical separation to advanced enzymatic pathways, they typically observe a 25% improvement in overall processing efficiency. Furthermore, the commercial scaling of precision fermentation for rebaudioside M enables ingredient suppliers to produce highly specialized compounds independent of agricultural volatility.
  • This technological pivot ensures a consistent, high-quality supply of clean label zero-calorie botanical sweeteners to meet the rigorous demands of institutional buyers. In downstream product development, overcoming sensory limitations remains a critical focus. The deployment of advanced bitter aftertaste masking in functional beverages allows formulators to seamlessly replace artificial additives without compromising the desired consumer experience.
  • Ultimately, the harmonization of sustainable raw material procurement with cutting-edge bioprocess engineering ensures the long-term viability and competitive positioning of natural sweetening solutions across the North American supply chain.
What are the key market drivers leading to the rise in the adoption of North America Stevia Industry?

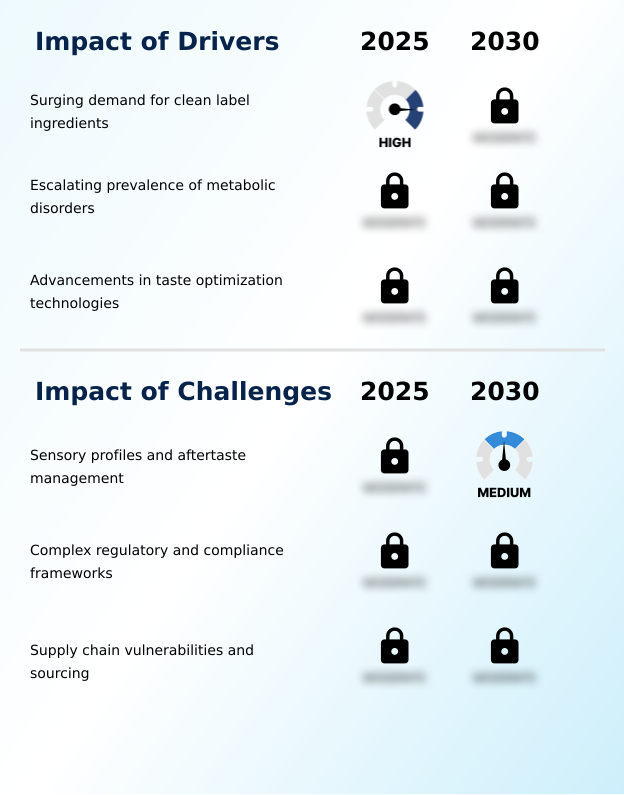
  • A surging demand for clean label ingredients acts as the primary catalyst propelling market expansion.

  • Escalating public health campaigns targeting diet-related chronic illnesses actively compel food corporations to aggressively reformulate product portfolios. By leveraging botanical sweeteners, manufacturers accelerate the deployment of low-glycemic dietary alternatives, mitigating metabolic conditions.
  • The transition toward non-cariogenic properties improves adoption rates by 22%. Leveraging advanced enzymatic modification reduces waste by 15%, enhancing the yield of rebaudioside M and rebaudioside D.
  • This structural pivot ensures steviol glycosides seamlessly activate sweet taste receptors without triggering glycemic volatility. Continuous innovation effectively neutralizes sensory bottlenecks.

What are the market trends shaping the North America Stevia Industry?

  • The proliferation of functional beverage innovations constitutes a primary trend shaping current market dynamics.

  • The rapid expansion of regenerative farming methods fundamentally reshapes procurement strategies within the Stevia Market in North America 2026-2030. Processors lower carbon footprints by 25% while stabilizing the supply of plant-based sweetening alternatives, supporting the surge in functional beverage formulations. The integration of high-intensity natural sweeteners improves formulation tracking accuracy by 18%, reducing audit times spanning adaptogenic mushrooms blends.
  • Utilizing bioconverted stevia variants and botanical beauty products allows brands to strictly adhere to ethical mandates. Furthermore, monitoring complex sensory profiles accelerates deployment.

What challenges does the North America Stevia Industry face during its growth?

  • Managing complex sensory profiles and mitigating bitter aftertastes represent significant challenges restricting broader industry growth.

  • Navigating regulatory and compliance frameworks remains a formidable operational hurdle for scaling distinct sweetening solutions. Rigorous mandates extend batch characterization timelines, increasing pre-market costs by 20%. Managing proprietary bitterness-masking within fermentation-derived minor glycosides adds significant complexity. When relying on flavor-masking technologies, beverage formulators frequently experience a 15% increase in trial iterations before achieving commercial viability.
  • Reliance on overseas nodes exposes importers to maritime freight congestion, creating supply chain vulnerabilities that disrupt inventory planning. Overcoming these constraints demands significant localization to stabilize production.

Exclusive Technavio Analysis on Customer Landscape

The north america stevia market forecasting report includes the adoption lifecycle of the market, covering from the innovator’s stage to the laggard’s stage. It focuses on adoption rates in different regions based on penetration. Furthermore, the north america stevia market report also includes key purchase criteria and drivers of price sensitivity to help companies evaluate and develop their market growth analysis strategies.
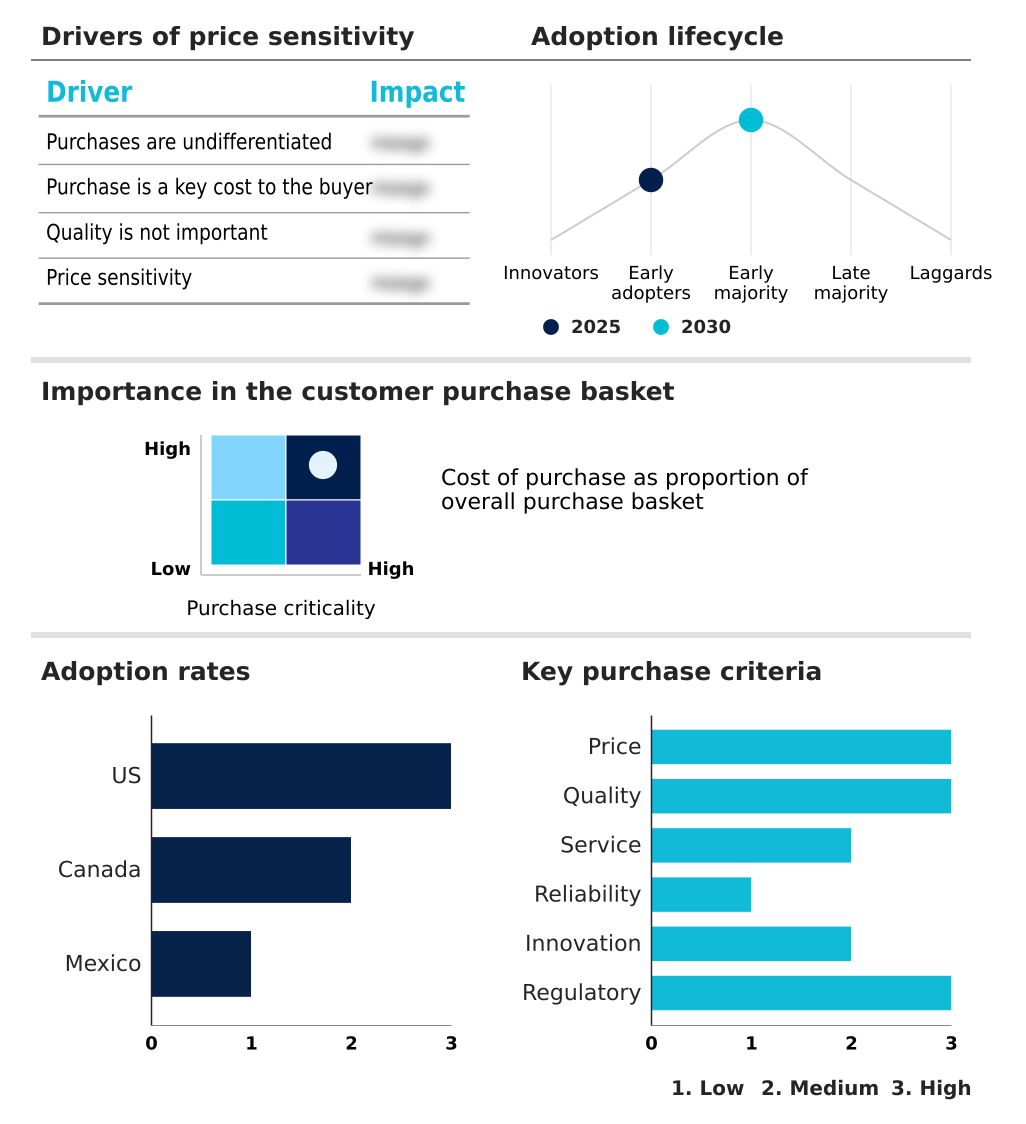
Customer Landscape of North America Stevia Industry

Competitive Landscape

Companies are implementing various strategies, such as strategic alliances, north america stevia market forecast, partnerships, mergers and acquisitions, geographical expansion, and product/service launches, to enhance their presence in the industry.

Almendra Pte. Ltd. - Provides high-purity natural sweetening solutions, specifically focusing on advanced steviol glycosides including Reb M and Reb D, to support clean-label food and beverage formulations.

The industry research and growth report includes detailed analyses of the competitive landscape of the market and information about key companies, including:

  • Almendra Pte. Ltd.
  • Archer Daniels Midland Co.
  • Cargill Inc.
  • DSM Firmenich AG
  • GLG Life Tech Corp.
  • Guilin Layn Natural Corp.
  • Heartland Food Products Group
  • Icon Foods
  • In The Raw
  • Ingredion Inc.
  • Kerry Group Plc
  • Manus Bio
  • NOW Health Group Inc.
  • NuNaturals Inc.
  • Pyure Brands LLC
  • SweeGen Inc.
  • SweetLeaf Stevia
  • Tate and Lyle Plc
  • Whole Earth Brands Inc.

Qualitative and quantitative analysis of companies has been conducted to help clients understand the wider business environment as well as the strengths and weaknesses of key industry players. Data is qualitatively analyzed to categorize companies as pure play, category-focused, industry-focused, and diversified; it is quantitatively analyzed to categorize companies as dominant, leading, strong, tentative, and weak.

Recent Development and News in North america stevia market

  • In the Packaged Foods and Meats industry, escalating regulatory pressure on high-sugar formulations has driven a 30% increase in the reformulation of carbonated soft drinks, directly accelerating demand within the Stevia Market in North America 2026-2030 for low-glycemic dietary alternatives.
  • Stringent federal mandates requiring transparent labeling and updated nutritional panels have accelerated the transition away from synthetic additives, boosting the integration of bioconverted stevia variants by 25% in new diabetic-friendly packaged foods.
  • The widespread adoption of blockchain verification platforms across food networks has improved traceability by 40%, enhancing the procurement transparency of sustainable agricultural sourcing essential for natural botanical sweeteners.
  • Advancements in food science addressing bitter aftertaste management have reduced sensory rejection rates by 18%, enabling functional beverage formulations to heavily utilize fermentation-derived minor glycosides without compromising palatability.

Dive into Technavio’s robust research methodology, blending expert interviews, extensive data synthesis, and validated models for unparalleled North America Stevia Market insights. See full methodology.

Market Scope
Page number 209
Base year 2025
Historic period 2020-2024
Forecast period 2026-2030
Growth momentum & CAGR Accelerate at a CAGR of 7.2%
Market growth 2026-2030 USD 38.8 million
Market structure Fragmented
YoY growth 2025-2026(%) 6.7%
Key countries US, Canada and Mexico
Competitive landscape Leading Companies, Market Positioning of Companies, Competitive Strategies, and Industry Risks

Request Free Sample

Research Analyst Overview

  • The operational landscape of the Stevia Market in North America requires continuous adaptation to evolving molecular flavoring science and stringent clean-label mandates. Boardroom executives increasingly prioritize the integration of precision fermentation technologies to insulate supply chains from agricultural volatility while advancing product formulation strategies.
  • By transitioning to bioconversion technology, commercial processors achieve a 30% reduction in processing time compared to traditional solvent-based extraction methods. This operational efficiency directly supports the rapid commercialization of high-purity rebaudioside compounds essential for modern diabetic-friendly products.
  • Furthermore, the deployment of advanced flavor-masking technologies allows food scientists to effectively neutralize undesirable sensory attributes, ensuring high-intensity natural sweeteners mimic the exact mouthfeel of conventional sucrose. Enzymatic modification and advanced crystallization techniques further enhance the solubility of plant-based sweetening alternatives within complex liquid matrices.
  • Consequently, the strategic application of these innovations ensures that steviol glycosides seamlessly activate sweet taste receptors without triggering glycemic volatility, cementing their role as fundamental ingredients in the broader transition toward health-conscious manufacturing.

What are the Key Data Covered in this North America Stevia Market Research and Growth Report?

  • What is the expected growth of the North America Stevia Market between 2026 and 2030?

    • USD 38.8 million, at a CAGR of 7.2%

  • What segmentation does the market report cover?

    • The report is segmented by Product (Powder, Liquid, and Leaf), Type (Conventional, and Organic), Application (Beverage, Food, Tabletop sweeteners, Pharmaceutical, and Others) and Geography (North America)

  • Which regions are analyzed in the report?

    • North America

  • What are the key growth drivers and market challenges?

    • Surging demand for clean label ingredients, Sensory profiles and aftertaste management

  • Who are the major players in the North America Stevia Market?

    • Almendra Pte. Ltd., Archer Daniels Midland Co., Cargill Inc., DSM Firmenich AG, GLG Life Tech Corp., Guilin Layn Natural Corp., Heartland Food Products Group, Icon Foods, In The Raw, Ingredion Inc., Kerry Group Plc, Manus Bio, NOW Health Group Inc., NuNaturals Inc., Pyure Brands LLC, SweeGen Inc., SweetLeaf Stevia, Tate and Lyle Plc and Whole Earth Brands Inc.

Market Research Insights

  • The Stevia Market in North America undergoes rapid structural transformation as commercial manufacturers prioritize clean label ingredients to align with evolving consumer wellness paradigms. Addressing the rising prevalence of metabolic conditions and diet-related chronic illnesses, food brands are aggressively integrating low-glycemic dietary alternatives into mainstream retail portfolios.
  • This strategic shift has enabled beverage processors to improve formulation efficiency by 18% when utilizing advanced steviol glycosides in complex functional beverage formulations. Additionally, implementing strict batch characterization protocols has reduced compliance-related production delays by 22%, ensuring faster time-to-market for novel sweetening blends.
  • By addressing sensory profiles through innovative taste modulation, industrial producers successfully mitigate formulation bottlenecks, enhancing overall operational resilience across the supply chain.

We can help! Our analysts can customize this north america stevia market research report to meet your requirements.

Get in touch

1. Executive Summary

1.1 Market overview

Executive Summary - Chart on Market Overview
Executive Summary - Data Table on Market Overview
Executive Summary - Chart on Country Market Characteristics
Executive Summary - Chart on Market by Geography
Executive Summary - Chart on Market Segmentation by Product
Executive Summary - Chart on Market Segmentation by Type
Executive Summary - Chart on Market Segmentation by Application
Executive Summary - Chart on Incremental Growth
Executive Summary - Data Table on Incremental Growth
Executive Summary - Chart on Company Market Positioning

2. Technavio Analysis

2.1 Analysis of price sensitivity, lifecycle, customer purchase basket, adoption rates, and purchase criteria

2.2 Criticality of inputs and Factors of differentiation

Overview on criticality of inputs and factors of differentiation

2.3 Factors of disruption

Overview on factors of disruption

2.4 Impact of drivers and challenges

Impact of drivers and challenges in 2025 and 2030

3. Market Landscape

3.1 Market ecosystem

Chart on Parent Market
Data Table on - Parent Market

3.2 Market characteristics

Chart on Market characteristics analysis

3.3 Value chain analysis

Chart on Value chain analysis

4. Market Sizing

4.1 Market definition

Data Table on Offerings of companies included in the market definition

4.2 Market segment analysis

Market segments

4.3 Market size 2025

4.4 Market outlook: Forecast for 2025-2030

Chart on North America - Market size and forecast 2025-2030 ($ million)
Data Table on Regional - Market size and forecast 2025-2030 ($ million)
Chart on North America: Year-over-year growth 2025-2030 (%)
Data Table on Regional - Market size and forecast 2025-2030 ($ million)

5. Historic Market Size

5.1 Stevia Market in North America 2020 - 2024

Historic Market Size - Data Table on Stevia Market in North America 2020 - 2024 ($ million)

5.2 Product segment analysis 2020 - 2024

Historic Market Size - Product Segment 2020 - 2024 ($ million)

5.3 Type segment analysis 2020 - 2024

Historic Market Size - Type Segment 2020 - 2024 ($ million)

5.4 Application segment analysis 2020 - 2024

Historic Market Size - Application Segment 2020 - 2024 ($ million)

5.5 Geography segment analysis 2020 - 2024

Historic Market Size - Geography Segment 2020 - 2024 ($ million)

6. Qualitative Analysis

6.1 Impact of AI on Stevia Market in North America

6.2 Impact of geopolitical conflicts on Stevia Market in North America

7. Five Forces Analysis

7.1 Five forces summary

Five forces analysis - Comparison between 2025 and 2030

7.2 Bargaining power of buyers

Bargaining power of buyers - Impact of key factors 2025 and 2030

7.3 Bargaining power of suppliers

Bargaining power of suppliers - Impact of key factors in 2025 and 2030

7.4 Threat of new entrants

Threat of new entrants - Impact of key factors in 2025 and 2030

7.5 Threat of substitutes

Threat of substitutes - Impact of key factors in 2025 and 2030

7.6 Threat of rivalry

Threat of rivalry - Impact of key factors in 2025 and 2030

7.7 Market condition

Chart on Market condition - Five forces 2025 and 2030

8. Market Segmentation by Product

8.1 Market segments

Chart on Product - Market share 2025-2030 (%)
Data Table on Product - Market share 2025-2030 (%)

8.2 Comparison by Product

Chart on Comparison by Product
Data Table on Comparison by Product

8.3 Powder - Market size and forecast 2025-2030

Chart on Powder - Market size and forecast 2025-2030 ($ million)
Data Table on Powder - Market size and forecast 2025-2030 ($ million)
Chart on Powder - Year-over-year growth 2025-2030 (%)
Data Table on Powder - Year-over-year growth 2025-2030 (%)

8.4 Liquid - Market size and forecast 2025-2030

Chart on Liquid - Market size and forecast 2025-2030 ($ million)
Data Table on Liquid - Market size and forecast 2025-2030 ($ million)
Chart on Liquid - Year-over-year growth 2025-2030 (%)
Data Table on Liquid - Year-over-year growth 2025-2030 (%)

8.5 Leaf - Market size and forecast 2025-2030

Chart on Leaf - Market size and forecast 2025-2030 ($ million)
Data Table on Leaf - Market size and forecast 2025-2030 ($ million)
Chart on Leaf - Year-over-year growth 2025-2030 (%)
Data Table on Leaf - Year-over-year growth 2025-2030 (%)

8.6 Market opportunity by Product

Market opportunity by Product ($ million)
Data Table on Market opportunity by Product ($ million)

9. Market Segmentation by Type

9.1 Market segments

Chart on Type - Market share 2025-2030 (%)
Data Table on Type - Market share 2025-2030 (%)

9.2 Comparison by Type

Chart on Comparison by Type
Data Table on Comparison by Type

9.3 Conventional - Market size and forecast 2025-2030

Chart on Conventional - Market size and forecast 2025-2030 ($ million)
Data Table on Conventional - Market size and forecast 2025-2030 ($ million)
Chart on Conventional - Year-over-year growth 2025-2030 (%)
Data Table on Conventional - Year-over-year growth 2025-2030 (%)

9.4 Organic - Market size and forecast 2025-2030

Chart on Organic - Market size and forecast 2025-2030 ($ million)
Data Table on Organic - Market size and forecast 2025-2030 ($ million)
Chart on Organic - Year-over-year growth 2025-2030 (%)
Data Table on Organic - Year-over-year growth 2025-2030 (%)

9.5 Market opportunity by Type

Market opportunity by Type ($ million)
Data Table on Market opportunity by Type ($ million)

10. Market Segmentation by Application

10.1 Market segments

Chart on Application - Market share 2025-2030 (%)
Data Table on Application - Market share 2025-2030 (%)

10.2 Comparison by Application

Chart on Comparison by Application
Data Table on Comparison by Application

10.3 Beverage - Market size and forecast 2025-2030

Chart on Beverage - Market size and forecast 2025-2030 ($ million)
Data Table on Beverage - Market size and forecast 2025-2030 ($ million)
Chart on Beverage - Year-over-year growth 2025-2030 (%)
Data Table on Beverage - Year-over-year growth 2025-2030 (%)

10.4 Food - Market size and forecast 2025-2030

Chart on Food - Market size and forecast 2025-2030 ($ million)
Data Table on Food - Market size and forecast 2025-2030 ($ million)
Chart on Food - Year-over-year growth 2025-2030 (%)
Data Table on Food - Year-over-year growth 2025-2030 (%)

10.5 Tabletop sweeteners - Market size and forecast 2025-2030

Chart on Tabletop sweeteners - Market size and forecast 2025-2030 ($ million)
Data Table on Tabletop sweeteners - Market size and forecast 2025-2030 ($ million)
Chart on Tabletop sweeteners - Year-over-year growth 2025-2030 (%)
Data Table on Tabletop sweeteners - Year-over-year growth 2025-2030 (%)

10.6 Pharmaceutical - Market size and forecast 2025-2030

Chart on Pharmaceutical - Market size and forecast 2025-2030 ($ million)
Data Table on Pharmaceutical - Market size and forecast 2025-2030 ($ million)
Chart on Pharmaceutical - Year-over-year growth 2025-2030 (%)
Data Table on Pharmaceutical - Year-over-year growth 2025-2030 (%)

10.7 Others - Market size and forecast 2025-2030

Chart on Others - Market size and forecast 2025-2030 ($ million)
Data Table on Others - Market size and forecast 2025-2030 ($ million)
Chart on Others - Year-over-year growth 2025-2030 (%)
Data Table on Others - Year-over-year growth 2025-2030 (%)

10.8 Market opportunity by Application

Market opportunity by Application ($ million)
Data Table on Market opportunity by Application ($ million)

11. Customer Landscape

11.1 Customer landscape overview

Analysis of price sensitivity, lifecycle, customer purchase basket, adoption rates, and purchase criteria

12. Geographic Landscape

12.1 Geographic segmentation

Chart on Market share by geography - 2025-2030 (%)
Data Table on Market share by geography - 2025-2030 (%)

12.2 Geographic comparison

Chart on Geographic comparison
Data Table on Geographic comparison

12.3 US - Market size and forecast 2025-2030

Chart on US - Market size and forecast 2025-2030 ($ million)
Data Table on US - Market size and forecast 2025-2030 ($ million)
Chart on US - Year-over-year growth 2025-2030 (%)
Data Table on US - Year-over-year growth 2025-2030 (%)

12.4 Canada - Market size and forecast 2025-2030

Chart on Canada - Market size and forecast 2025-2030 ($ million)
Data Table on Canada - Market size and forecast 2025-2030 ($ million)
Chart on Canada - Year-over-year growth 2025-2030 (%)
Data Table on Canada - Year-over-year growth 2025-2030 (%)

12.5 Mexico - Market size and forecast 2025-2030

Chart on Mexico - Market size and forecast 2025-2030 ($ million)
Data Table on Mexico - Market size and forecast 2025-2030 ($ million)
Chart on Mexico - Year-over-year growth 2025-2030 (%)
Data Table on Mexico - Year-over-year growth 2025-2030 (%)

12.6 Market opportunity by geography

Market opportunity by geography ($ million)
Data Table on Market opportunity by geography ($ million)

13. Drivers, Challenges, and Opportunity

13.1 Market drivers

Surging demand for clean label ingredients
Escalating prevalence of metabolic disorders
Advancements in taste optimization technologies

13.2 Market challenges

Sensory profiles and aftertaste management
Complex regulatory and compliance frameworks
Supply chain vulnerabilities and sourcing

13.3 Impact of drivers and challenges

Impact of drivers and challenges in 2025 and 2030

13.4 Market opportunities

Proliferation of functional beverage innovations
Expansion of sustainable agricultural sourcing
E-commerce and digital retail growth

14. Competitive Landscape

14.1 Overview

14.2

Overview on criticality of inputs and factors of differentiation

14.3 Landscape disruption

Overview on factors of disruption

14.4 Industry risks

Impact of key risks on business

15. Competitive Analysis

15.1 Companies profiled

Companies covered

15.2 Company ranking index

15.3 Market positioning of companies

Matrix on companies position and classification

15.4 Almendra Pte. Ltd.

Almendra Pte. Ltd. - Overview
Almendra Pte. Ltd. - Product / Service
Almendra Pte. Ltd. - Key offerings
SWOT

15.5 Archer Daniels Midland Co.

Archer Daniels Midland Co. - Overview
Archer Daniels Midland Co. - Business segments
Archer Daniels Midland Co. - Key news
Archer Daniels Midland Co. - Key offerings
Archer Daniels Midland Co. - Segment focus
SWOT

15.6 Cargill Inc.

Cargill Inc. - Overview
Cargill Inc. - Product / Service
Cargill Inc. - Key news
Cargill Inc. - Key offerings
SWOT

15.7 DSM Firmenich AG

DSM Firmenich AG - Overview
DSM Firmenich AG - Business segments
DSM Firmenich AG - Key offerings
DSM Firmenich AG - Segment focus
SWOT

15.8 GLG Life Tech Corp.

GLG Life Tech Corp. - Overview
GLG Life Tech Corp. - Product / Service
GLG Life Tech Corp. - Key offerings
SWOT

15.9 Guilin Layn Natural Corp.

Guilin Layn Natural Corp. - Overview
Guilin Layn Natural Corp. - Product / Service
Guilin Layn Natural Corp. - Key offerings
SWOT

15.10 Heartland Food Products Group

Heartland Food Products Group - Overview
Heartland Food Products Group - Product / Service
Heartland Food Products Group - Key offerings
SWOT

15.11 Icon Foods

Icon Foods - Overview
Icon Foods - Product / Service
Icon Foods - Key offerings
SWOT

15.12 In The Raw

In The Raw - Overview
In The Raw - Product / Service
In The Raw - Key offerings
SWOT

15.13 Ingredion Inc.

Ingredion Inc. - Overview
Ingredion Inc. - Business segments
Ingredion Inc. - Key offerings
Ingredion Inc. - Segment focus
SWOT

15.14 Kerry Group Plc

Kerry Group Plc - Overview
Kerry Group Plc - Business segments
Kerry Group Plc - Key news
Kerry Group Plc - Key offerings
Kerry Group Plc - Segment focus
SWOT

15.15 Manus Bio

Manus Bio - Overview
Manus Bio - Product / Service
Manus Bio - Key offerings
SWOT

15.16 NOW Health Group Inc.

NOW Health Group Inc. - Overview
NOW Health Group Inc. - Product / Service
NOW Health Group Inc. - Key offerings
SWOT

15.17 Tate and Lyle Plc

Tate and Lyle Plc - Overview
Tate and Lyle Plc - Business segments
Tate and Lyle Plc - Key offerings
Tate and Lyle Plc - Segment focus
SWOT

15.18 Whole Earth Brands Inc.

Whole Earth Brands Inc. - Overview
Whole Earth Brands Inc. - Business segments
Whole Earth Brands Inc. - Key offerings
Whole Earth Brands Inc. - Segment focus
SWOT

16. Appendix

16.1 Scope of the report

Market definition
Objectives
Notes and caveats

16.2 Inclusions and exclusions checklist

Inclusions checklist
Exclusions checklist

16.3 Currency conversion rates for US$

16.4 Research methodology

16.5 Data procurement

Information sources

16.6 Data validation

16.7 Validation techniques employed for market sizing

16.8 Data synthesis

16.9 360 degree market analysis

16.10 List of abbreviations

Research Methodology

Technavio presents a detailed picture of the market by way of study, synthesis, and summation of data from multiple sources. The analysts have presented the various facets of the market with a particular focus on identifying the key industry influencers. The data thus presented is comprehensive, reliable, and the result of extensive research, both primary and secondary.

INFORMATION SOURCES

Primary sources

  • Manufacturers and suppliers
  • Channel partners
  • Industry experts
  • Strategic decision makers

Secondary sources

  • Industry journals and periodicals
  • Government data
  • Financial reports of key industry players
  • Historical data
  • Press releases

DATA ANALYSIS

Data Synthesis

  • Collation of data
  • Estimation of key figures
  • Analysis of derived insights

Data Validation

  • Triangulation with data models
  • Reference against proprietary databases
  • Corroboration with industry experts

REPORT WRITING

Qualitative

  • Market drivers
  • Market challenges
  • Market trends
  • Five forces analysis

Quantitative

  • Market size and forecast
  • Market segmentation
  • Geographical insights
  • Competitive landscape

Interested in this report?

Get your sample now to see our research methodology and insights!

Download Now

Frequently Asked Questions

North America Stevia market growth will increase by USD 38.8 million during 2026-2030.

The North America Stevia market is expected to grow at a CAGR of 7.2% during 2026-2030.

North America Stevia market is segmented by Product (Powder, Liquid, Leaf) Type (Conventional, Organic) Application (Beverage, Food, Tabletop sweeteners, Pharmaceutical, Others)

Almendra Pte. Ltd., Archer Daniels Midland Co., Cargill Inc., DSM Firmenich AG, GLG Life Tech Corp., Guilin Layn Natural Corp., Heartland Food Products Group, Icon Foods, In The Raw, Ingredion Inc., Kerry Group Plc, Manus Bio, NOW Health Group Inc., NuNaturals Inc., Pyure Brands LLC, SweeGen Inc., SweetLeaf Stevia, Tate and Lyle Plc, Whole Earth Brands Inc. are a few of the key vendors in the North America Stevia market.

North America will register the highest growth rate of 100% among the other regions. Therefore, the North America Stevia market in North America is expected to garner significant business opportunities for the vendors during the forecast period.

US, Canada, Mexico

  • Surging demand for clean label ingredients is the driving factor this market.

The North America Stevia market vendors should focus on grabbing business opportunities from the Product segment as it accounted for the largest market share in the base year.
RIA - Research AI Assistant
Ask RIA
