Marine Cables Market Size 2025-2029
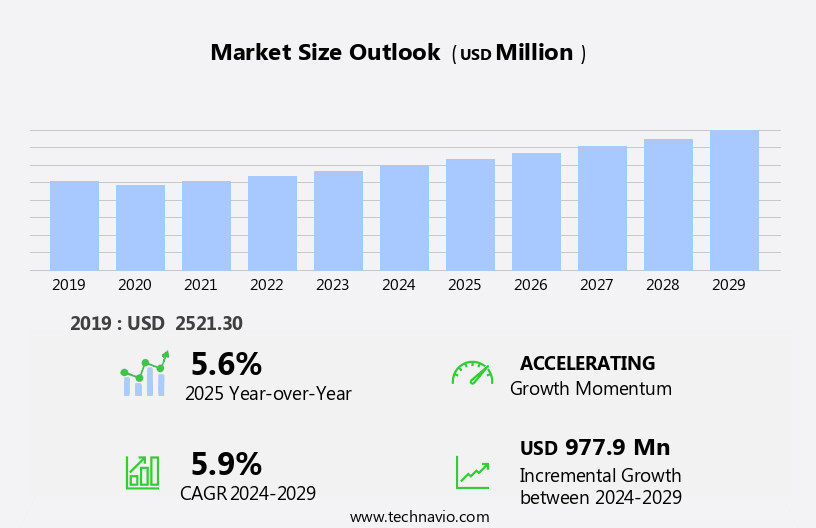
The marine cables market size is forecast to increase by USD 977.9 million, at a CAGR of 5.9% between 2024 and 2029.
- The market is experiencing significant growth due to the increasing global maritime trade. Mergers and acquisitions in the industry are driving market competition, leading to advancements in technology and product innovation. Supply chain and raw material issues, however, pose challenges to market growth. The market trend of increasing demand for high-performance cables, particularly in deep-sea applications, is expected to continue. Additionally, the focus on energy efficiency and cost reduction is influencing the market, with manufacturers investing in research and development to create more efficient and cost-effective solutions. Overall, the market is expected to witness steady growth In the coming years, with key factors such as global maritime trade expansion, technological advancements, and supply chain optimization shaping market dynamics.
What will be the Size of the Market During the Forecast Period?
- The market encompasses the production and deployment of specialized cables used for various applications within the marine and offshore industries. This market exhibits strong growth due to the increasing demand for sustainable energy solutions, inter-country connections, and grid integration. High-voltage DC technology, energy efficiency, and smart grid are key trends driving market expansion. HVDC technology enables efficient and long-distance power transmission, while digital twin technology facilitates efficient infrastructure management and maintenance. Marine fiberplay a crucial role in the energy transition, providing essential infrastructure for offshore wind farms, ocean energy, and inter-country connections. Project financing, farm development, and engineering are integral aspects of the market, with a strong focus on protection, reliability, and environmental impact assessment.
- The market also caters to the needs of the power grid modernization, with investment in marine construction, intervention, inspection, data acquisition, and maintenance services. Laying technology, jointing equipment, routing, fiber optic installation, and laying vessels are essential components of the market. Robotics and automation are increasingly being adopted for laying services and inspection, enhancing efficiency and reducing environmental impact. The market is further fueled by the growing demand for energy storage, energy efficiency, and the integration of renewable energy sources into the power grid. Overall, the market is a dynamic and evolving sector, offering significant opportunities for innovation and growth.
How is this Marine Cables Industry segmented and which is the largest segment?
The marine cables industry research report provides comprehensive data (region-wise segment analysis), with forecasts and estimates in "USD million" for the period 2025-2029, as well as historical data from 2019-2023 for the following segments.
- Type
- Power cables
- Control cables
- Communication cables
- Instrument cables
- Material
- Copper
- Aluminum
- Geography
- APAC
- China
- Japan
- South Korea
- Europe
- Germany
- France
- Italy
- North America
- Middle East and Africa
- South America
- APAC
By Type Insights
- The power cables segment is estimated to witness significant growth during the forecast period.
The market primarily focuses on power cables, serving vital functions on marine vessels, including high-voltage systems for propulsion and power distribution, and low-voltage systems for lighting and auxiliary equipment. High-voltage power cables are integral to power distribution systems on ships and submarines, ensuring efficient transmission of electrical power from the main source to various vessel components. They are also crucial for electric propulsion systems, which are increasingly adopted in hybrid and fully electric vessels. Additionally, marine cables facilitate submarine deployments, deep-water drilling, and underwater installation of infrastructure such as fiber optics for data traffic, submarine communications, and telecom applications.
The market is influenced by factors like capacity expansion, legal frameworks, installation and commissioning, and sustainability considerations. Key players offer a range of marine cables, including protective coatings, reinforcing materials, and installation equipment. The market targets various sectors, including energy, internet services, financial transactions, and power transmission, contributing to energy security and the digital economy.
Get a glance at the Marine Cables Industry report of share of various segments Request Free Sample
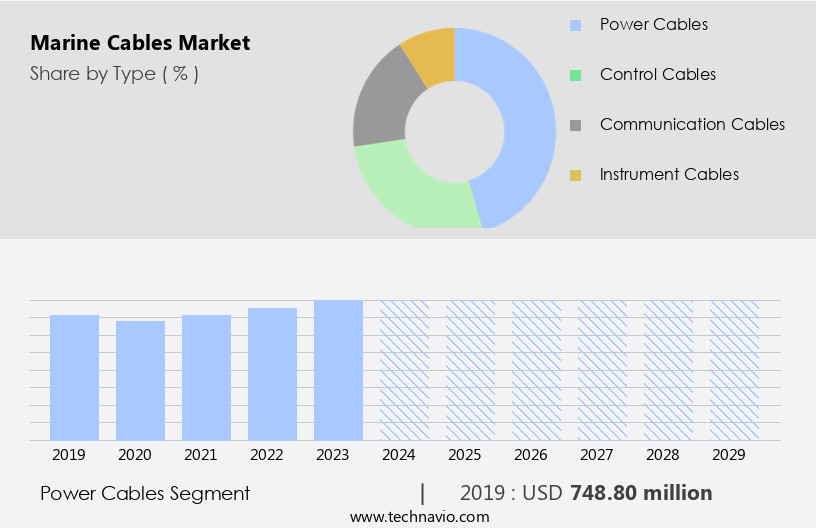
The power cables segment was valued at USD 748.80 million in 2019 and showed a gradual increase during the forecast period.
Regional Analysis
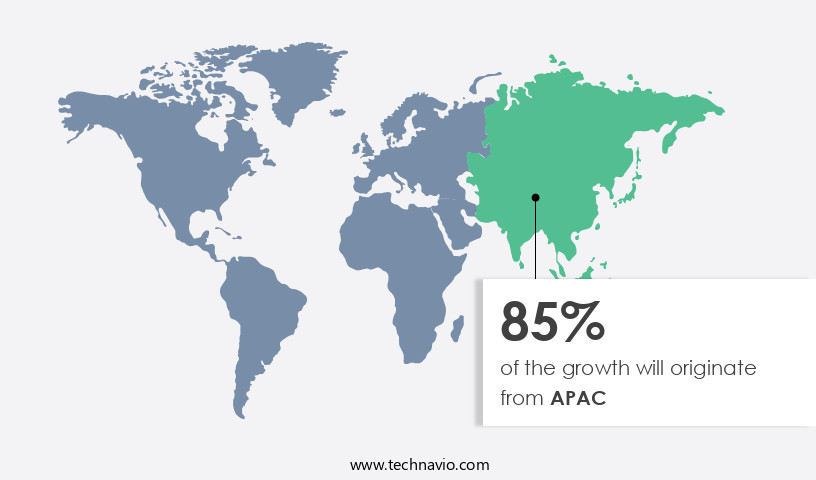
- APAC is estimated to contribute 85% to the growth of the global market during the forecast period.
Technavio's analysts have elaborately explained the regional trends and drivers that shape the market during the forecast period.
For more insights on the market share of various regions, Request Free Sample
The Asia-Pacific (APAC) region leads The market, fueled by thriving shipbuilding industries in countries like China, South Korea, and Japan. China's shipbuilding sector has experienced remarkable growth, constructing 25.02 million deadweight tons (DWT) of ships In the first half of 2024, an 18.4% increase from the previous year. Marine cables are essential for various applications, including medium voltage power transmission, submarine deployments, and vessel communications. APAC's marine cable market growth is further driven by increasing demand for data traffic, capacity expansion, and infrastructure development for island connections and energy farms.
In addition, the market encompasses both wet plant products, such as submarine communications and fiber optics, and dry plant products, including power feed equipment and protective coatings. Additionally, the integration of high voltages, inter-arrays, and HVDC submarine power systems is crucial for enhancing energy security and power transmission efficiency. Maintenance costs, digital economy applications, and the role of marine cables in deep-water drilling and telecom operations are significant factors influencing market growth.
Market Dynamics
Our researchers analyzed the data with 2024 as the base year, along with the key drivers, trends, and challenges. A holistic analysis of drivers will help companies refine their marketing strategies to gain a competitive advantage.
What are the key market drivers leading to the rise In the adoption of the Marine Cables Industry?
Growth in global maritime trade is the key driver of the market.
- The market experiences significant growth due to the increasing volume of maritime trade. In addition, the deployment of submarine communication equipment, high-voltage power cables for inter-arrays and island connections, and fiber optics for submarine communications and data transmission are key factors driving market growth. Furthermore, the expansion of energy farms, deep-water drilling, and data centers necessitates the use of marine cables for power feed equipment and infrastructure protection.
- The digital economy, including Internet services, financial transactions, and the Internet of Things, also contributes to market growth. Maintenance costs for marine cables and the need for installation and commissioning equipment, protective coatings, and reinforcing materials are ongoing challenges for market participants.
What are the market trends shaping the Marine Cables Industry?
Mergers and acquisitions is the upcoming market trend.
- The market is experiencing significant growth, with companies focusing on mergers and acquisitions to expand their market reach and enhance product offerings. The market is witnessing increased demand due to various factors, such as the growing need for wet plant products for oil and gas exploration, the deployment of submarine equipment for medium and high voltages in vessels, and the expansion of submarine communications for data traffic and capacity. Additionally, the legal framework for submarine power infrastructure, including HVDC submarine power, is driving the market's growth.
- The market also caters to various applications, including island connections, construction, and inter-arrays, as well as communication applications such as submarine communications and fiber optics. Furthermore, the digitization trend is fueling the demand for marine cables in deep-water drilling, energy, telecom, power transmission, energy security, generation, streaming, and the Internet of Things. Installation and commissioning, maintenance costs, and the use of protective coatings and reinforcing materials are crucial factors influencing the market's dynamics. The market also encompasses onshore equipment, such as beach burying equipment and power feed equipment, and the integration of marine cables with data centers and data transmission systems.
What challenges does the Marine Cables Industry face during its growth?
Supply chain and raw material issues is a key challenge affecting the industry growth.
- The market encounters challenges in maintaining a consistent supply chain due to the reliance on raw materials such as copper, aluminum, and specialized polymers for insulation. Fluctuations in availability and pricing of these essential elements significantly impact the cost and delivery timelines of marine cables, leading to market instability.
- The change in raw material pricing can affect the production and deployment of various underwater applications, including wet plant products, medium and high voltage cables for vessels, submarine deployment equipment, inter-arrays, island connections, and submarine communications for data traffic, capacity, infrastructure, energy, internet traffic, telecom, power transmission, energy security, generation, streaming, and various communication applications such as HVDC submarine power, fiber optics, deep-water drilling, and digital economy services.
- Additionally, the market requires onshore equipment, installation and commissioning, protective coatings, reinforcing materials, data centers, data transmission, integration, maintenance costs, beach burying equipment, financial transactions, energy consumption, internet browsing, and power feed equipment for sustainability and the Internet of Things.
Exclusive Customer Landscape
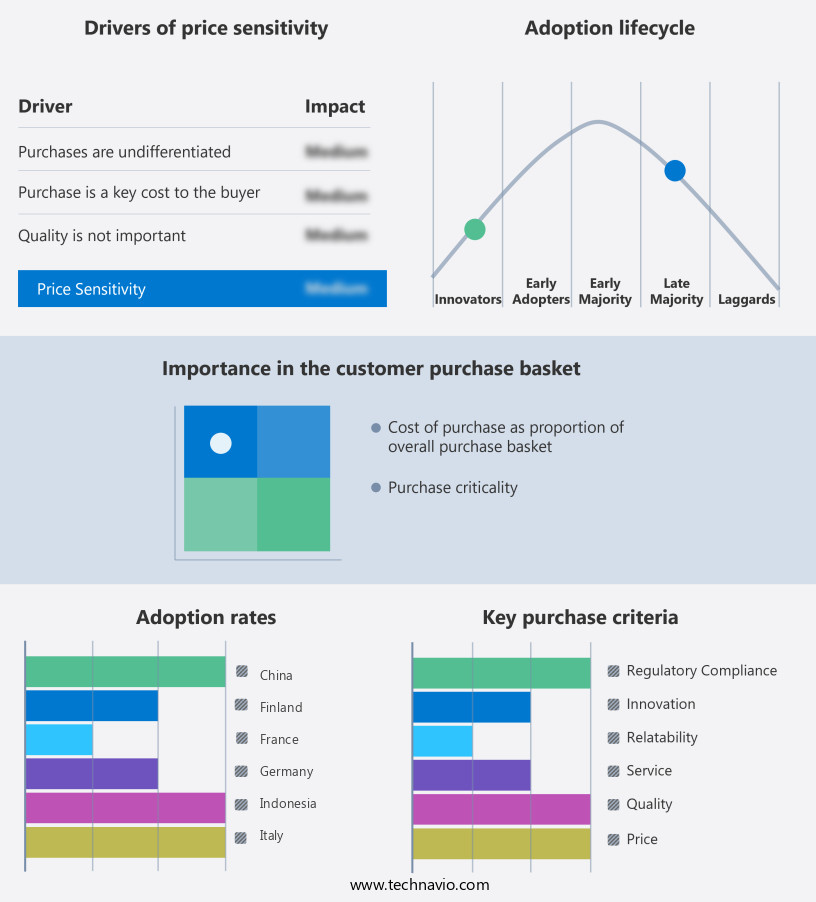
The market forecasting report includes the adoption lifecycle of the market, covering from the innovator's stage to the laggard's stage. It focuses on adoption rates in different regions based on penetration. Furthermore, the market report also includes key purchase criteria and drivers of price sensitivity to help companies evaluate and develop their market growth analysis strategies.
Customer Landscape
Key Companies & Market Insights
Companies are implementing various strategies, such as strategic alliances, market forecast, partnerships, mergers and acquisitions, geographical expansion, and product/service launches, to enhance their presence In the industry.
Amphenol TPC - The company offers marine cables such as Super-Trex 600 Volt Welding Cable, Trex-Onics Overall Shielded Continuous Flex Multi-Conductor Cable, Super-Trex Ultra-Gard Portable Cord, and others.
The industry research and growth report includes detailed analyses of the competitive landscape of the market and information about key companies, including:
- Anixter
- Batt Cables Ltd.
- Cable Solutions Worldwide
- Caledonian Cables
- Cleveland Cable Co.
- Eland Cables
- Firstflex
- Ningbo Grand Ocean Marine Co. Ltd.
- Hengtong Group Co. Ltd.
- JDR Cable Systems Ltd.
- Jiangsu Honest Cable Co. Ltd.
- KEI Industries Ltd.
- LS Cable and System Ltd.
- Nexans SA
- Prysmian S.p.A
- Southwire Co. LLC
- Sumitomo Electric Industries Ltd.
- Teledyne Marine Technologies Inc.
- Top Cable
Qualitative and quantitative analysis of companies has been conducted to help clients understand the wider business environment as well as the strengths and weaknesses of key industry players. Data is qualitatively analyzed to categorize companies as pure play, category-focused, industry-focused, and diversified; it is quantitatively analyzed to categorize companies as dominant, leading, strong, tentative, and weak.
Research Analyst Overview
The market encompasses a diverse range of products designed for various applications In the realm of power transmission and telecommunications. Two primary categories of marine cables are medium voltage and high voltage cables. Medium voltage cables are utilized for power distribution within vessels and for inter-array connections in offshore wind farms. High voltage cables, on the other hand, are employed for submarine power transmission and island connections. The demand for marine cables is driven by several factors. The increasing capacity of data traffic and the need for reliable submarine communications have fueled growth In the telecom sector. Energy security and the expansion of renewable energy sources, such as wind and solar, have boosted the market for power transmission cables.
Additionally, digitization and the digital economy have led to an uptick in internet traffic, necessitating the deployment of fiber optic cables. The infrastructure required for the installation and commissioning of marine cables is extensive. Submarine deployment equipment, including burial machines and beach burying equipment, are essential for laying and protecting the cables. The legal framework governing the installation and operation of marine cables varies from region to region, adding complexity to the process. The construction and installation of marine cables involve significant costs. These costs include the acquisition of installation equipment, protective coatings, and reinforcing materials. Maintenance costs are also a consideration, particularly for power transmission cables, which require regular inspection and maintenance to ensure energy efficiency and reliability.
Further, the market is characterized by continuous innovation. New technologies, such as high-voltage direct current (HVDC) submarine power and underwater installation equipment, are transforming the industry. The integration of onshore equipment and the development of new protective coatings and reinforcing materials are also driving advancements. The market for marine cables is diverse and dynamic. It includes applications in power transmission, telecommunications, and energy generation. The increasing demand for sustainable energy sources and the digitization of various industries are expected to continue driving growth In the market. Additionally, the Internet of Things (IoT) and social media interactions are contributing to the growing need for reliable and high-speed Internet services.
|
Market Scope |
|
|
Report Coverage |
Details |
|
Page number |
201 |
|
Base year |
2024 |
|
Historic period |
2019-2023 |
|
Forecast period |
2025-2029 |
|
Growth momentum & CAGR |
Accelerate at a CAGR of 5.9% |
|
Market Growth 2025-2029 |
USD 977.9 million |
|
Market structure |
Fragmented |
|
YoY growth 2024-2025(%) |
5.6 |
|
Key countries |
China, South Korea, Japan, Italy, France, Germany, Finland, Russia, Philippines, and Indonesia |
|
Competitive landscape |
Leading Companies, Market Positioning of Companies, Competitive Strategies, and Industry Risks |
What are the Key Data Covered in this Market Research and Growth Report?
- CAGR of the Marine Cables industry during the forecast period
- Detailed information on factors that will drive the market growth and forecasting between 2025 and 2029
- Precise estimation of the size of the market and its contribution of the industry in focus to the parent market
- Accurate predictions about upcoming growth and trends and changes in consumer behaviour
- Growth of the market across APAC, Europe, North America, Middle East and Africa, and South America
- Thorough analysis of the market's competitive landscape and detailed information about companies
- Comprehensive analysis of factors that will challenge the market growth of industry companies
We can help! Our analysts can customize this marine cables market research report to meet your requirements.


