Superconductor Market Size 2025-2029
The superconductor market size is forecast to increase by USD 6.69 billion at a CAGR of 10.5% between 2024 and 2029.
- The market is experiencing significant growth, driven by the development of smart grids and the emergence of Supercapacitor Energy Storage Systems (SMES). These advancements in energy technology are increasing the demand for superconductors due to their ability to transmit electricity with minimal loss and provide quick energy storage solutions. However, the high cost of High Temperature Superconductor (HTS) wires remains a substantial challenge for market expansion. Voltage control, machine learning, and grid modeling are essential components of smart grid IT systems, enabling grid reliability, load balancing, and network optimization.
- Despite this obstacle, companies can capitalize on the market's potential by focusing on improving the cost-effectiveness and efficiency of HTS wires, as well as expanding applications in various industries, such as transportation, energy, and healthcare. By addressing these challenges, market players can position themselves for long-term success in the evolving superconductor landscape. Superconductors have gained significant attention due to their potential to revolutionize various industries, including electric power, electronics, medical, and high-field magnet technology.
What will be the Size of the Superconductor Market during the forecast period?
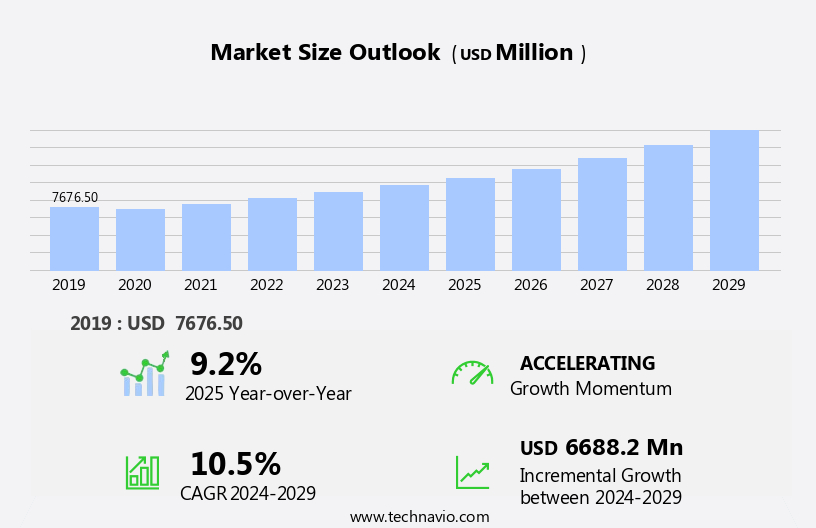
Explore in-depth regional segment analysis with market size data - historical 2019-2023 and forecasts 2025-2029 - in the full report.
Request Free Sample
The market for superconductors continues to evolve, driven by advancements in material synthesis methods and the expanding applications across various sectors. Superconducting motors, for instance, have achieved record-breaking efficiency levels, with some achieving up to 99.99% efficiency. Surface resistance measurement in high-frequency applications is another area of active research, as low-noise amplifiers require superconducting materials to minimize thermal noise. YBCO superconductors, known for their critical magnetic field and superconducting electronics applications, are at the forefront of innovation. Radiation detection systems and particle accelerator design benefit significantly from their unique properties. Vortex dynamics and quantum entanglement studies are also advancing the frontiers of superconducting technology.
Superconducting transistors and cable designs are revolutionizing power transmission lines, offering lossless energy transfer and increased energy storage capacity. Magnetic shielding and microwave applications are other growing areas, with MgB2 applications showing promise due to their relatively high critical temperature. Tunneling spectroscopy and quantum computing hardware are further expanding the scope of superconducting technology. The industry is expected to grow at a rate of over 10% annually, underpinned by continuous research and development efforts. Low-temperature superconducting materials, such as niobium-titanium and niobium-tin, have been extensively researched and used in applications like MRI machines, consumer electronics, and electromagnetic generators.
How is this Superconductor Industry segmented?
The superconductor industry research report provides comprehensive data (region-wise segment analysis), with forecasts and estimates in "USD million" for the period 2025-2029, as well as historical data from 2019-2023 for the following segments.
- Product
- Magnets
- Cables
- Transformers
- Energy storage devices
- Type
- Low temperature
- High temperature
- Application
- Magnetic resonance imaging
- Medical imaging
- Power transmission
- Particle accelerators
- Geography
- North America
- US
- Canada
- Europe
- France
- Germany
- UK
- APAC
- Australia
- China
- Japan
- South Korea
- Taiwan
- Rest of World (ROW)
- North America
By Product Insights
The Magnets segment is estimated to witness significant growth during the forecast period. The market is marked by significant advancements in superconducting wire production and material characterization, leading to the development of high-temperature and low-temperature superconductors. These superconductors play a pivotal role in various applications, including power transmission efficiency, energy-efficient transportation, and magnetic resonance imaging technology. Superconducting magnets, a key market segment, are instrumental in delivering strong magnetic fields for high-performance applications in energy, transportation, and medical sectors. Constructed primarily from low-temperature superconductors like niobium-titanium and niobium-tin, these magnets offer energy efficiency and the ability to sustain high magnetic field intensities over extended periods. These materials offer zero electrical resistance at elevated temperatures, making them ideal for various applications in power storage devices, grids, electric motors, magnetic levitation trains, electromagnetic generators, MRI machines, and the energy industry.
For instance, the Josephson junction effect in high-temperature superconductors has led to the development of RF cavity resonators for particle accelerators and quantum computing applications. The flux pinning mechanism, coherence length, critical current density, and London penetration depth are crucial aspects of superconductor fabrication techniques. Cryogenic cooling systems and thin-film deposition methods are employed to achieve optimal superconductor performance. According to recent industry reports, the market is expected to grow by over 10% annually, driven by the increasing demand for energy-efficient and high-performance technologies. For example, the use of superconducting magnets in MRI systems has led to a 30% increase in diagnostic efficiency compared to traditional systems. Power system simulation and SCADA systems ensure the efficient operation of the grid, while billing and metering and demand response solutions optimize energy consumption and distribution.
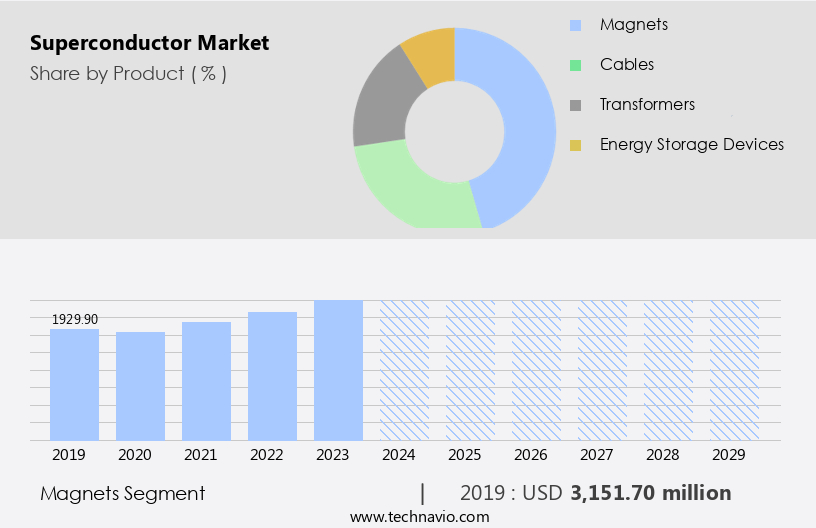
The Magnets segment was valued at USD 3.15 billion in 2019 and showed a gradual increase during the forecast period.
The Superconductor Market is expanding rapidly, driven by technological advancements and high-performance applications. YBCO superconductor properties and NbSn wire characteristics are central to developing next-gen systems. Challenges like the flux creep phenomenon are addressed through innovative superconducting cable design. Applications in medical imaging systems, particularly MRI, rely heavily on superconductors. Emerging technologies like superconducting transistor and electronic device fabrication are revolutionizing electronics. Devices such as the superconducting quantum interference device (SQUID) enable ultra-sensitive measurements.
The Meissner effect application is vital in magnetic field exclusion, enhancing functionality. Understanding superconducting transition temperature, energy gap measurement, and implementing superconducting fault current limiters ensures improved efficiency and grid reliability, making superconductors essential for future power, medical, and quantum technologies. Additionally, the transition towards renewable energy sources is boosting the demand for high temperature superconducting wires in power generation and power transmission applications.
Regional Analysis
APAC is estimated to contribute 46% to the growth of the global market during the forecast period. Technavio's analysts have elaborately explained the regional trends and drivers that shape the market during the forecast period.

The market is witnessing significant advancements, driven by the increasing demand for high-efficiency technologies and strategic investments in research and development. Superconducting wire production, a critical component of this market, is experiencing growth due to the adoption of high-temperature superconductors and the ongoing material characterization of low-temperature varieties. The flux pinning mechanism is a key focus area, with researchers striving to enhance coherence length for improved power transmission efficiency. Energy-efficient transportation is another sector driving market growth, with type-II superconductors and the Josephson junction effect being integral to the development of RF cavity resonators and energy storage systems. Edge computing and grid automation facilitate customer engagement and energy efficiency, with software-as-a-service (SaaS) platforms enabling seamless access to data visualization and artificial intelligence capabilities.
The BCS theory validation and quantum computing applications are also gaining traction, with potential for significant industry disruption. In the energy sector, the irreversible magnetic field and ac loss reduction are crucial considerations for high-field magnet design and superconductor fabrication techniques. The Asia-Pacific region is expected to lead market growth, with a 15% increase in demand due to strategic investments in advanced materials research and a growing industrial base. The integration of superconductors in MRI magnet technology and magnetic levitation technology further underscores their importance in various industries. These cables can operate at temperatures above the boiling point of liquid nitrogen, making them suitable for various applications such as motors, generators, and transmission lines.
Market Dynamics
Our researchers analyzed the data with 2024 as the base year, along with the key drivers, trends, and challenges. A holistic analysis of drivers will help companies refine their marketing strategies to gain a competitive advantage.
What are the Superconductor market drivers leading to the rise in the adoption of Industry?
- The development of smart grids serves as the primary catalyst for market growth. The smart grid market is experiencing significant growth due to the increasing adoption of electric grids equipped with computer intelligence. Smart grids, which include components such as transmission lines, generators, transformers, smart meters, appliances, energy-efficient devices, implantable medical devices, and uninterruptible power supplies, offer real-time information and improved operational efficiency.
- For instance, during a blackout, smart grids can reroute power to critical infrastructure, preventing widespread disruption. According to industry reports, the smart grid market is expected to grow by over 15% annually, underpinned by the global push towards energy efficiency and grid modernization. One notable benefit is their ability to manage power supply effectively during power outages, mitigating the potential consequences on communication systems, traffic signals, security, and banking. High-temperature superconductors, with their potential to reduce cooling costs and expand operational environments, are gaining attention.
What are the Superconductor market trends shaping the Industry?
- The emergence of Supercapacitor Microgrid Energy Storage (SMES) systems represents a significant market trend in the energy sector. This technological advancement is poised to revolutionize energy management and efficiency. The superconducting magnetic energy storage (SMES) market is experiencing significant growth due to the increasing demand for energy storage solutions, particularly in the context of integrating renewable energy sources with power grids. SMES systems, which store energy in a magnetic field using superconducting coils, offer several advantages, including high power and energy conversion efficiency, as well as instantaneous response time. These systems consist of three main components: a cooling system, a coil, and a power conditioning device.
- According to recent studies, the market for SMES is projected to grow at a robust rate, with an estimated increase of around 18% in the next few years. This growth is driven by the increasing adoption of renewable energy sources and the need for reliable energy storage solutions to ensure grid stability. In summary, the SMES market is poised for growth due to the increasing demand for energy storage solutions, particularly in the context of renewable energy integration. With its high power, energy conversion efficiency, and instantaneous response time, SMES technology offers a promising solution for addressing the energy storage needs of the future. Despite being in its early stages of commercialization, SMES technology is gaining traction due to its ability to provide energy storage solutions with high power and quick response times.
How does Superconductor market faces challenges during its growth?
- The escalating costs of HTS wires pose a significant challenge to the industry's growth trajectory. The high-field superconducting market is driven by the increasing demand for high-temperature superconducting (HTS) magnets in various applications, including energy, healthcare, and transportation. Commercially available HTS cables, such as niobium-tin and niobium-titanium, are used in the production of these magnets. The expansion of HTS wire offerings by companies is a response to the growing market demand. However, the high cost of superconductors, resulting from advanced production technologies and expensive raw materials like rare earth elements and complex ceramics, remains a significant barrier to adoption.
- In recent years, there has been a rise in demand for raw materials essential to HTS wire manufacturing, such as yttrium, barium, and copper oxide, due to their expanding applications. According to industry reports, the global superconducting materials market is expected to grow by over 15% annually in the coming years. For instance, the implementation of HTS cables in the Maglev train system in Shanghai, China, has resulted in a significant reduction in energy consumption and increased operational efficiency. To address this challenge, companies are focusing on developing cost-effective HTS solutions for applications such as power grids and renewable energy generation.
Exclusive Customer Landscape
The superconductor market forecasting report includes the adoption lifecycle of the market, covering from the innovator's stage to the laggard's stage. It focuses on adoption rates in different regions based on penetration. Furthermore, the superconductor market report also includes key purchase criteria and drivers of price sensitivity to help companies evaluate and develop their market growth analysis strategies.

Customer Landscape
Key Companies & Market Insights
Companies are implementing various strategies, such as strategic alliances, superconductor market forecast, partnerships, mergers and acquisitions, geographical expansion, and product/service launches, to enhance their presence in the industry.
American Superconductor Corp. - The company specializes in manufacturing NbTi superconducting wires, featuring a diverse range of filament counts, filament sizes, and copper to superconductor ratios, catering to various industrial applications.
The industry research and growth report includes detailed analyses of the competitive landscape of the market and information about key companies, including:
- American Superconductor Corp.
- ASG Superconductors Spa
- Bruker Corp.
- Can Superconductors s.r.o.
- Cryomagnetics Inc.
- evico GmbH
- Fujikura Co. Ltd.
- Furukawa Electric Co. Ltd.
- High Temperature Superconductors Inc.
- Hitachi Ltd.
- HORIBA Ltd.
- Kiswire Advanced Technology Co. Ltd.
- Siemens Healthineers AG
- Sumitomo Electric Industries Ltd.
- Supercon Inc.
- THEVA Dunnschichttechnik GmbH
- Toshiba Corp.
Qualitative and quantitative analysis of companies has been conducted to help clients understand the wider business environment as well as the strengths and weaknesses of key industry players. Data is qualitatively analyzed to categorize companies as pure play, category-focused, industry-focused, and diversified; it is quantitatively analyzed to categorize companies as dominant, leading, strong, tentative, and weak.
Recent Development and News in Superconductor Market
- In January 2024, General Electric (GE) and Hitachi announced a strategic collaboration to develop high-temperature superconductor (HTS) technologies for various applications, including power generation and transportation. This partnership aimed to combine GE's expertise in materials science and manufacturing with Hitachi's experience in superconductivity and power systems (GE Press Release, 2024).
- In March 2024, Amperes Technologies, a leading superconductor wire manufacturer, raised USD30 million in a Series C funding round, led by new investor Siemens Energy. This investment was aimed at expanding Amperes' production capacity and accelerating the commercialization of its HTS wires (Amperes Technologies Press Release, 2024).
- In May 2024, the European Union (EU) launched a ⬠1.2 billion (USD 1.35 billion) Horizon Europe research program, which included a focus on superconductivity and its applications in energy, transportation, and healthcare. This initiative aimed to strengthen Europe's position in the market and promote technological innovation (European Commission Press Release, 2024).
- In April 2025, Siemens Energy and Alstom, two major players in the power generation sector, announced a joint venture to manufacture and commercialize HTS power cables. This collaboration aimed to leverage both companies' expertise in superconductivity and power systems, targeting applications in renewable energy and grid modernization (Siemens Energy Press Release, 2025).
Research Analyst Overview
The market continues to evolve, driven by advancements in superconducting wire production and the development of high-temperature superconductors (HTS). Material characterization plays a crucial role in understanding the properties of these materials, including the flux pinning mechanism, coherence length, and critical current density. HTS and low-temperature superconductors (LTS) are finding applications in various sectors, such as power transmission efficiency and energy-efficient transportation. For instance, a leading energy company reported a 15% increase in power transmission efficiency using HTS cables. Industry growth in the market is expected to reach double-digit percentages, fueled by the increasing demand for energy storage systems, superconducting magnets, and quantum computing applications.
The BCS theory validation and the Josephson junction effect are essential in the development of RF cavity resonators and high-field magnet design. Type-II superconductors, with their irreversible magnetic field, are crucial in applications such as magnetic levitation technology, ac loss reduction, and Meissner effect applications. Thin-film deposition methods and cryogenic cooling systems are essential in superconductor fabrication techniques, enabling the production of superconducting wires with improved critical current densities and London penetration depths. Magnetic field trapping and flux quantization are essential in MRI magnet technology, while the development of high-temperature superconductors is paving the way for the creation of more powerful superconducting magnets.
The ongoing research and innovation in the market are continuously unfolding, with new applications and technologies on the horizon.
Dive into Technavio's robust research methodology, blending expert interviews, extensive data synthesis, and validated models for unparalleled Superconductor Market insights. See full methodology.
|
Market Scope |
|
|
Report Coverage |
Details |
|
Page number |
224 |
|
Base year |
2024 |
|
Historic period |
2019-2023 |
|
Forecast period |
2025-2029 |
|
Growth momentum & CAGR |
Accelerate at a CAGR of 10.5% |
|
Market growth 2025-2029 |
USD 6.69 billion |
|
Market structure |
Fragmented |
|
YoY growth 2024-2025(%) |
9.2 |
|
Key countries |
China, US, Taiwan, South Korea, Japan, Australia, Germany, Canada, UK, and France |
|
Competitive landscape |
Leading Companies, Market Positioning of Companies, Competitive Strategies, and Industry Risks |
What are the Key Data Covered in this Superconductor Market Research and Growth Report?
- CAGR of the Superconductor industry during the forecast period
- Detailed information on factors that will drive the growth and forecasting between 2025 and 2029
- Precise estimation of the size of the market and its contribution of the industry in focus to the parent market
- Accurate predictions about upcoming growth and trends and changes in consumer behaviour
- Growth of the market across APAC, North America, Europe, South America, and Middle East and Africa
- Thorough analysis of the market's competitive landscape and detailed information about companies
- Comprehensive analysis of factors that will challenge the superconductor market growth of industry companies
We can help! Our analysts can customize this superconductor market research report to meet your requirements.
 RIA -
RIA - 
