Tank Level Monitoring System Market Analysis North America, Europe, APAC, South America, Middle East and Africa - US, Germany, China, France, Japan, India - Size and Forecast 2024-2028

Tank Level Monitoring System Market Analysis North America, Europe, APAC, South America, Middle East and Africa - US, Germany, China, France, Japan, India - Size and Forecast 2024-2028

Published: Jul 2024 212 Pages SKU: IRTNTR80086

Market Overview at a Glance

$266.8 Mn
Market Opportunity
5.33%
CAGR
4.96
YoY growth 2023-2024(%)

Tank Level Monitoring System Market Size 2024-2028 

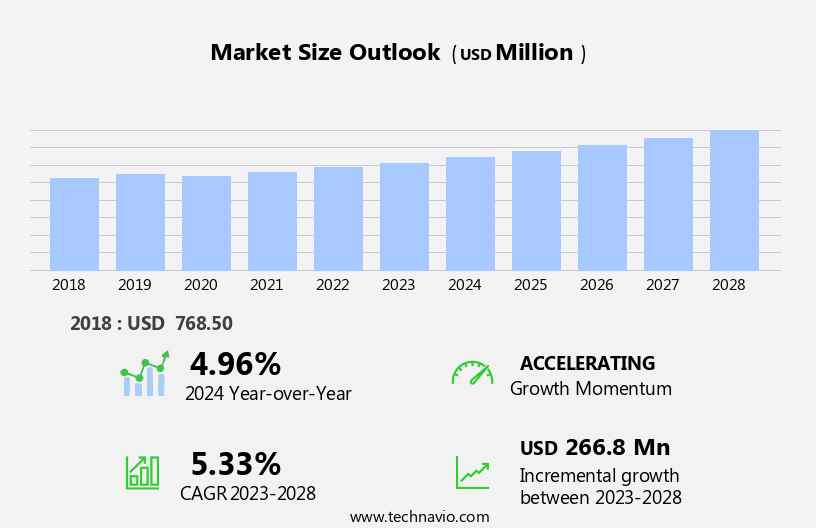
The tank level monitoring system market size is forecast to increase by USD 266.8 billion at a CAGR of 5.33% between 2023 and 2028.

  • The market is witnessing significant growth due to the increasing demand from process industries. This trend is driven by the need for real-time inventory management and the prevention of overfilling or underfilling of tanks, which can lead to operational inefficiencies and potential safety hazards. Technological advancements in tank level monitoring systems, such as the integration of IoT and AI, are also contributing to market growth. However, the high cost associated with these systems can be a challenge for smaller businesses and may limit market penetration. Despite this, the benefits of accurate and efficient tank level monitoring are compelling, making it a worthwhile investment for businesses looking to optimize their operations and improve safety.
  •  

What will be the Size of the Tank Level Monitoring System Market During the Forecast Period?

Tank Level Monitoring System Market Size

 Request Free Sample

  • The market encompasses solutions utilized in various industries, including oil and gas, transportation, power generation, mining, chemical plants, pulp and paper, steel mills, and glass manufacturing, to optimize inventory levels and ensure operational efficiency. These systems leverage wireless sensor networks to provide real-time data on tank levels, enabling businesses to make informed decisions on production, logistics, and maintenance. Data analytics and artificial intelligence (AI) technologies are increasingly integrated into tank management solutions, enabling anomaly detection, inventory optimization, and predictive maintenance. Environmental regulations drive the demand for accurate and reliable tank level monitoring systems, particularly In the mining industry and power plants.
  • The market is expected to grow significantly due to the increasing focus on automation, real-time data analysis, and regulatory compliance.

How is this Tank Level Monitoring System Industry segmented and which is the largest segment?

The tank level monitoring system industry research report provides comprehensive data (region-wise segment analysis), with forecasts and estimates in "USD million" for the period 2024-2028, as well as historical data from 2018-2022 for the following segments.

  • Application
    • Oil and gas
    • Chemical industry
    • Water and wastewater management
    • Food and beverage
    • Others
  • Product
    • Non-invasive systems
    • Invasive systems
  • Geography
    • North America
      • US
    • Europe
      • Germany
      • France
    • APAC
      • China
      • India
      • Japan
    • South America
    • Middle East and Africa

By Application Insights

  • The oil and gas segment is estimated to witness significant growth during the forecast period.

The market encompasses various industries, with the oil and gas sector holding a substantial share due to the necessity for precise and dependable monitoring of petroleum products, crude oil, LNG, and other hydrocarbon fluids. In this sector, accurate inventory management, prevention of overfills or shortages, and ensuring safety during storage and transportation are crucial. Tank level monitoring systems are integral to achieving these objectives In the intricate and high-risk oil and gas facilities. In addition to oil and gas, industries such as manufacturing, power generation, mining, chemical plants, pulp and paper, steel mills, glass manufacturing, and others employ tank level monitoring systems for inventory optimization, anomaly detection, and regulatory compliance.

Technologies like wireless IoT solutions, ultrasonic transmitters, radar transmitters, wireless sensor networks, data analytics, AI, and tank management solutions are integral to these systems. Industrial automation and Industry 4.0 further enhance their functionality. Compliance with environmental regulations is also a significant factor driving the adoption of these systems.

Tank Level Monitoring System Market Size

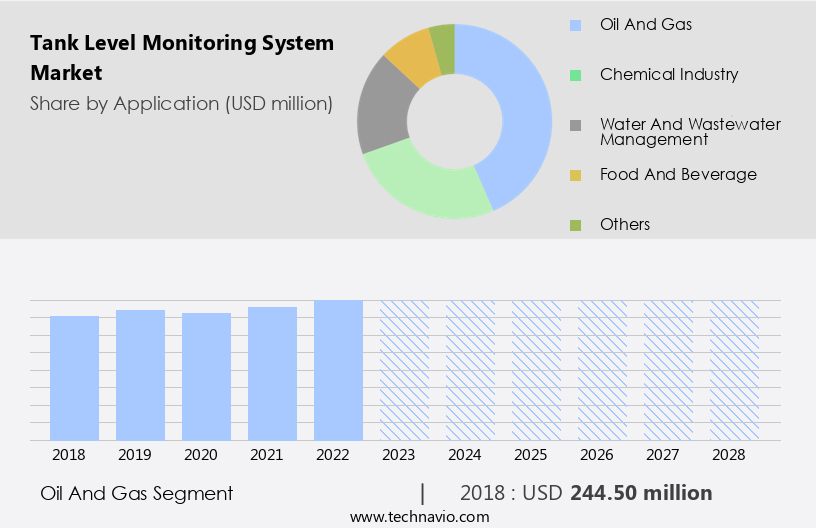
Get a glance at the  Tank Level Monitoring System Industry report of share of various segments Request Free Sample

The Oil and gas segment was valued at USD 244.50 billion in 2018 and showed a gradual increase during the forecast period.

Regional Analysis

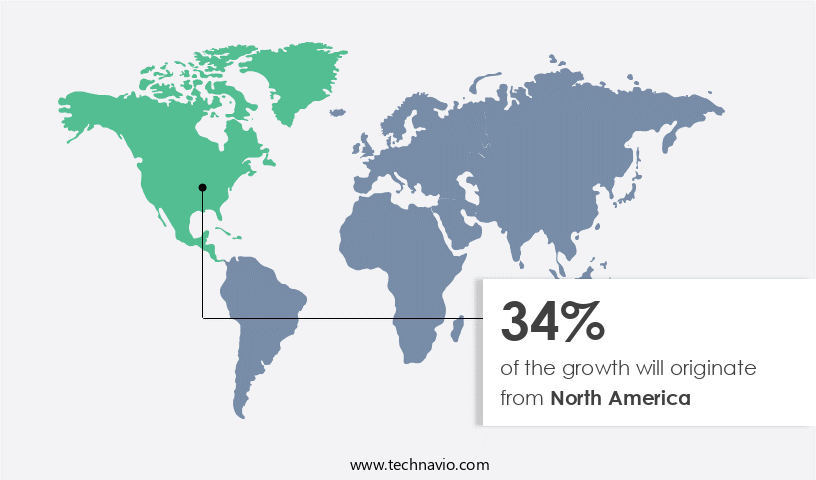
  • North America is estimated to contribute 34% to the growth of the global market during the forecast period.

Technavio's analysts have elaborately explained the regional trends and drivers that shape the market during the forecast period.

Tank Level Monitoring System Market Share by Geography

For more insights on the market share of various regions, Request Free Sample

The North American the market is experiencing significant growth due to increasing demand from sectors such as chemical and food and beverages. The US and Canada are major contributors to this expansion, with their advanced infrastructure and high technological adoption rates. The focus on optimizing fuel usage, cost reduction, and environmental regulation compliance is driving market growth In these countries. The US, being the largest market In the region, benefits from a diverse range of industries, including chemicals, food and beverages, and others. Innovative solutions, such as wireless IoT solutions, ultrasonic transmitters, radar transmitters, and wireless sensor networks, are transforming tank management systems, enabling real-time data analytics, artificial intelligence, and inventory optimization.

The mining and power generation industries are also adopting these technologies to enhance operational efficiency and ensure regulatory compliance.

Market Dynamics

Our tank level monitoring system market researchers analyzed the data with 2023 as the base year, along with the key drivers, trends, and challenges. A holistic analysis of drivers will help companies refine their marketing strategies to gain a competitive advantage.

What are the key market drivers leading to the rise In the adoption of Tank Level Monitoring System Industry?

  • The growing demand for tank level monitoring system from process industries is notably driving market growth. Tank level monitoring systems have gained significant traction in various industries, including manufacturing, oil and gas, power generation, mining, chemical plants, pulp and paper, steel mills, glass manufacturing, and wire and cable. These systems employ wireless IoT solutions, ultrasonic transmitters, and radar transmitters to ensure accurate and real-time fluid level monitoring in LNG, petrochemical, and other industrial applications. Wireless sensor networks, data analytics, and artificial intelligence (AI) are integral components of advanced tank management solutions.
  • Moreover, anomaly detection and inventory optimization are crucial features that enable environmental regulations compliance and industrial automation in Industry 4.0. The mining industry and power plants significantly benefit from tank level monitoring systems in the transportation segment. Ultrasonic sensors and IoT-powered systems provide static pressure sensing, ensuring efficient and reliable fluid level monitoring. These systems enhance safety, reduce operational costs, and contribute to the overall success of industrial processes. Thus, such factors are driving the growth of the market during the forecast period.

What are the market trends shaping the Tank Level Monitoring System Industry?

  • The technological advancements in tank level monitoring system is the key trend in the market. Tank level monitoring systems have gained significant traction in various industries, including manufacturing, oil and gas, power generation, mining, chemical plants, pulp and paper, steel mills, glass manufacturing, and wire and cable. These systems employ wireless IoT solutions, such as ultrasonic transmitters and radar transmitters, to monitor fluid levels in tanks. The power generation sector, particularly in LNG and petrochemical plants, heavily relies on tank management solutions for inventory optimization and environmental regulations compliance. Industrial automation chemical industry  and Industry 4.0 have further pushed the adoption of tank level monitoring systems.
  • Moreover, IoT-powered systems, including wireless sensor networks and data analytics, enable real-time monitoring and anomaly detection. Artificial intelligence (AI) and static pressure sensing technologies enhance the accuracy and efficiency of these systems. The mining industry and power plants have also adopted tank level monitoring systems in the transportation segment to optimize logistics and ensure safety. Ultrasonic sensors and radar transmitters play a crucial role in fluid level monitoring, while wireless sensor networks facilitate seamless data transfer and analysis. Thus, such trends will shape the growth of the market during the forecast period.

What challenges does the Tank Level Monitoring System Industry face during its growth?

  • The high cost associated with tank level monitoring system is the major challenge that affects the growth of the market. Tank level monitoring systems have gained significant traction in various industries, including manufacturing, oil and gas, power generation, mining, chemical plants, pulp and paper, steel mills, glass manufacturing, and wire and cable. These systems employ wireless IoT solutions, such as ultrasonic transmitters and radar transmitters, to monitor fluid levels in tanks. Ultrasonic sensors utilize high-frequency sound waves to measure the distance between the sensor and the fluid surface, while radar transmitters use electromagnetic waves to determine the tank's liquid level.
  • However, the transportation segment, particularly in the LNG and petrochemical industries, heavily relies on tank management solutions for inventory optimization and anomaly detection. Data analytics and artificial intelligence (AI) technologies are increasingly integrated into these systems to ensure environmental regulations are met and industrial automation is optimized, aligning with Industry 4.0 trends. Wireless sensor networks facilitate real-time monitoring, enabling timely intervention and reducing operational costs. Tank level monitoring systems are essential for industries that require static pressure sensing, such as mining, power plants, and steel mills, to maintain efficient and safe operations. IoT-powered systems provide accurate, reliable, and cost-effective solutions for fluid level monitoring, enhancing overall industrial productivity. Hence, the above factors will impede the growth of the market during the forecast period.

Exclusive Customer Landscape

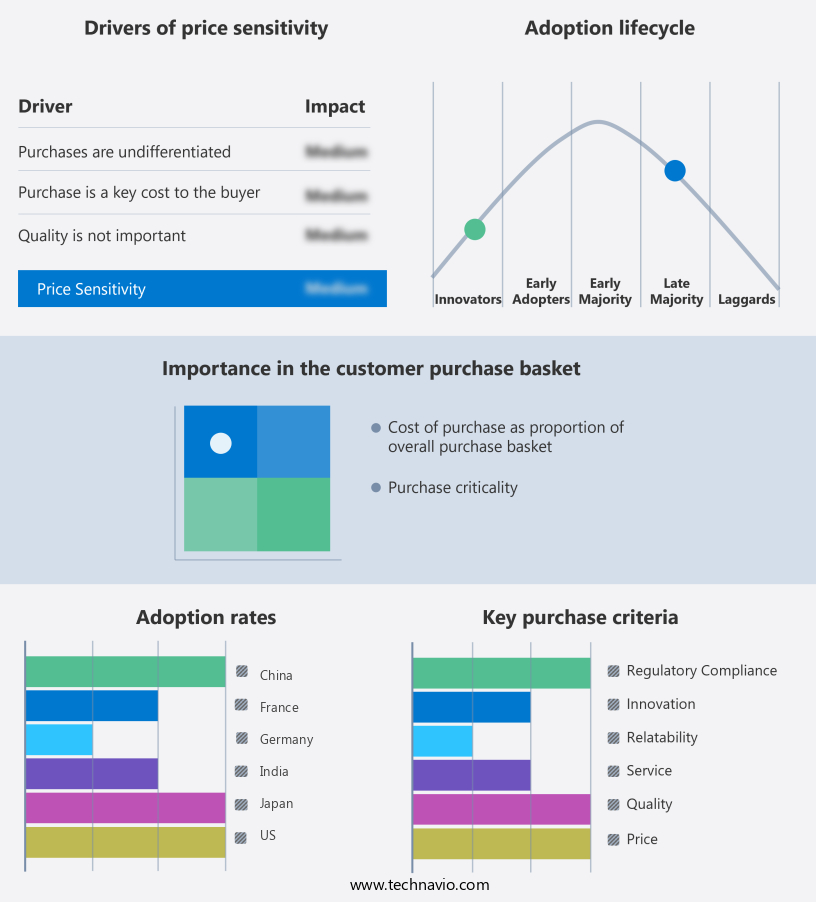
The tank level monitoring system market forecasting report includes the adoption lifecycle of the market, covering from the innovator's stage to the laggard's stage. It focuses on adoption rates in different regions based on penetration. Furthermore, the tank level monitoring system market report also includes key purchase criteria and drivers of price sensitivity to help companies evaluate and develop their market growth analysis strategies.

Tank Level Monitoring System Market Share by Geography

 Customer Landscape

Key Companies & Market Insights

Companies are implementing various strategies, such as strategic alliances, tank level monitoring system market forecast, partnerships, mergers and acquisitions, geographical expansion, and product/service launches, to enhance their presence In the industry.

ABB Ltd. - Our company specializes in providing advanced Tank Level Monitoring Systems for US industries. Solutions include Guided Wave Radar (GWR), Magnetostrictive, and Ultrasonic level transmitters and switches. These technologies ensure accurate and reliable level measurement, enhancing operational efficiency and reducing costs associated with inventory management and maintenance. GWR transmitters employ non-contact technology for measuring levels in various tank configurations, while Magnetostrictive transmitters deliver high accuracy in applications with difficult-to-measure liquids. Ultrasonic level transmitters and switches provide versatile solutions for various tank sizes and liquid types. By implementing our Tank Level Monitoring Systems, clients can optimize their inventory levels, minimize product losses, and ensure regulatory compliance.

The industry research and growth report includes detailed analyses of the competitive landscape of the market and information about key companies, including:

  • ABB Ltd.
  • AMETEK Inc.
  • Automation Products Group Inc.
  • Emerson Electric Co.
  • Endress Hauser Group Services AG
  • FAFNIR GmbH
  • Flowline, Inc
  • Fuji Electric Co. Ltd.
  • Garner Industries LLC
  • Gems Sensors Inc.
  • Graco Inc.
  • Honeywell International Inc.
  • IVEDA SOLUTIONS, INC.
  • KROHNE Messtechnik GmbH
  • L and J Technologies
  • Madison Co., Inc.
  • Omega Engineering Inc.
  • OMNTEC Mfg., Inc.
  • Rochester Sensors
  • Schneider Electric SE
  • Siemens AG
  • Tag IT Technologies
  • Tek-Trol LLC
  • Temposonics LLC
  • VEGA Grieshaber KG
  • Yokogawa Electric Corp.

Qualitative and quantitative analysis of companies has been conducted to help clients understand the wider business environment as well as the strengths and weaknesses of key industry players. Data is qualitatively analyzed to categorize companies as pure play, category-focused, industry-focused, and diversified; it is quantitatively analyzed to categorize companies as dominant, leading, strong, tentative, and weak.

Research Analyst Overview

The market encompasses a range of applications across various industries, including manufacturing, oil and gas, transportation, power generation, mining, chemical plants, pulp and paper, steel mills, glass manufacturing, and others. In these sectors, accurate and reliable tank level monitoring is crucial for efficient operations, inventory management, and ensuring regulatory compliance. In the manufacturing sector, tank level monitoring systems help optimize production processes by ensuring the timely availability of raw materials and intermediates. These systems enable real-time visibility into inventory levels, reducing the need for manual inspections and minimizing the risk of stockouts or overstocking. The oil and gas industry relies heavily on tank level monitoring systems for the safe and efficient transportation and storage of petroleum products.

Accurate and timely monitoring of fluid levels in pipelines, tanks, and terminals is essential for maintaining operational excellence and ensuring regulatory compliance with environmental regulations. In the transportation sector, tank level monitoring systems play a vital role in ensuring the safe and efficient transport of liquids, such as LNG and petrochemicals. Real-time monitoring of fluid levels helps prevent overfilling or underfilling, reducing the risk of spills and improving overall safety. Power generation industries, including power plants, utilize tank level monitoring systems to ensure the smooth operation of their cooling systems and other essential processes. Accurate and timely monitoring of fluid levels In these applications helps prevent downtime and optimize performance.

In the mining industry, tank level monitoring systems help manage the storage and transportation of various minerals and chemicals. Real-time monitoring of fluid levels in mining ponds and other storage facilities is essential for ensuring safe and efficient operations and minimizing the risk of environmental contamination. The chemical industry requires precise tank level monitoring to maintaIn the safety and quality of their products. Real-time monitoring helps prevent overfilling or underfilling, reducing the risk of spills and ensuring consistent product quality. In the pulp and paper industry, tank level monitoring systems help optimize production processes by ensuring the timely availability of raw materials and intermediates.

Real-time monitoring of fluid levels in various tanks and storage facilities helps prevent downtime and improve overall efficiency. Steel mills and glass manufacturing facilities also rely on tank level monitoring systems to optimize their production processes and ensure the availability of raw materials. Real-time monitoring helps prevent downtime and improve overall operational efficiency. The use of wireless IoT solutions, such as ultrasonic transmitters and radar transmitters, has revolutionized tank level monitoring, enabling real-time data collection and analysis. Wireless sensor networks and data analytics tools help optimize inventory levels, improve operational efficiency, and ensure regulatory compliance. Artificial intelligence (AI) and Industry 4.0

technologies are increasingly being integrated into tank level monitoring systems to enhance their capabilities. Anomaly detection and inventory optimization algorithms help identify potential issues before they become critical, reducing downtime and improving overall operational efficiency. Environmental regulations continue to drive the adoption of tank level monitoring systems across various industries. These regulations require accurate and timely monitoring of fluid levels to prevent spills and minimize the risk of environmental contamination. In conclusion, tank level monitoring systems play a crucial role in various industries, from manufacturing to oil and gas, transportation, power generation, mining, chemical plants, pulp and paper, steel mills, glass manufacturing, and beyond.

Real-time monitoring of fluid levels helps optimize production processes, improve operational efficiency, and ensure regulatory compliance. The integration of IoT solutions, AI, and Industry 4.0 technologies is driving innovation in this space, enabling more accurate and timely monitoring and analysis of fluid levels.

Tank Level Monitoring System Market Scope

Report Coverage

Details

Page number

212

Base year

2023

Historic period

2018-2022

Forecast period

2024-2028

Growth momentum & CAGR

Accelerate at a CAGR of 5.33%

Market growth 2024-2028

USD 266.8 million

Market structure

Fragmented

YoY growth 2023-2024(%)

4.96

Key countries

US, Germany, China, France, Japan, and India

Competitive landscape

Leading Companies, Market Positioning of Companies, Competitive Strategies, and Industry Risks

Request Free Sample

What are the Key Data Covered in this Tank Level Monitoring System Market Research and Growth Report?

  • CAGR of the Tank Level Monitoring System industry during the forecast period
  • Detailed information on factors that will drive the Tank Level Monitoring System growth and forecasting between 2024 and 2028
  • Precise estimation of the size of the market and its contribution of the industry in focus to the parent market
  • Accurate predictions about upcoming growth and trends and changes in consumer behaviour
  • Growth of the market across North America, Europe, APAC, South America, and Middle East and Africa
  • Thorough analysis of the market's competitive landscape and detailed information about companies
  • Comprehensive analysis of factors that will challenge the tank level monitoring system market growth of industry companies

We can help! Our analysts can customize this tank level monitoring system market research report to meet your requirements.

Get in touch

1 Executive Summary

  • 1.1 Market overview
    • Executive Summary - Chart on Market Overview
    • Executive Summary - Data Table on Market Overview
    • Executive Summary - Chart on Global Market Characteristics
    • Executive Summary - Chart on Market by Geography
    • Executive Summary - Chart on Market Segmentation by Application
    • Executive Summary - Chart on Market Segmentation by Product
    • Executive Summary - Chart on Incremental Growth
    • Executive Summary - Data Table on Incremental Growth
    • Executive Summary - Chart on Company Market Positioning

2 Technavio Analysis

  • 2.1 Analysis of price sensitivity, lifecycle, customer purchase basket, adoption rates, and purchase criteria
    • Analysis of price sensitivity, lifecycle, customer purchase basket, adoption rates, and purchase criteria
  • 2.2 Criticality of inputs and Factors of differentiation
    • Overview on criticality of inputs and factors of differentiation
  • 2.3 Factors of disruption
    • Overview on factors of disruption
  • 2.4 Impact of drivers and challenges
    • Impact of drivers and challenges in 2023 and 2028

3 Market Landscape

  • 3.1 Market ecosystem
    • Parent Market
    • Data Table on - Parent Market
  • 3.2 Market characteristics
    • Market characteristics analysis
  • 3.3 Value chain analysis
    • Value Chain Analysis

4 Market Sizing

  • 4.1 Market definition
    • Offerings of companies included in the market definition
  • 4.2 Market segment analysis
    • Market segments
  • 4.3 Market size 2023
    • 4.4 Market outlook: Forecast for 2023-2028
      • Chart on Global - Market size and forecast 2023-2028 ($ million)
      • Data Table on Global - Market size and forecast 2023-2028 ($ million)
      • Chart on Global Market: Year-over-year growth 2023-2028 (%)
      • Data Table on Global Market: Year-over-year growth 2023-2028 (%)

    5 Historic Market Size

    • 5.1 Global Tank Level Monitoring System Market 2018 - 2022
      • Historic Market Size - Data Table on Global Tank Level Monitoring System Market 2018 - 2022 ($ million)
    • 5.2 Application segment analysis 2018 - 2022
      • Historic Market Size - Application Segment 2018 - 2022 ($ million)
    • 5.3 Product segment analysis 2018 - 2022
      • Historic Market Size - Product Segment 2018 - 2022 ($ million)
    • 5.4 Geography segment analysis 2018 - 2022
      • Historic Market Size - Geography Segment 2018 - 2022 ($ million)
    • 5.5 Country segment analysis 2018 - 2022
      • Historic Market Size - Country Segment 2018 - 2022 ($ million)

    6 Additional Value/Volume Data

    • 6.1 Global tank level monitoring system market by country 2023 - 2028 ($ million)
      • Market Size (value) - Data Table on Global tank level monitoring system market by Country 2023 - 2028 ($ million)

    7 Five Forces Analysis

    • 7.1 Five forces summary
      • Five forces analysis - Comparison between 2023 and 2028
    • 7.2 Bargaining power of buyers
      • Bargaining power of buyers - Impact of key factors 2023 and 2028
    • 7.3 Bargaining power of suppliers
      • Bargaining power of suppliers - Impact of key factors in 2023 and 2028
    • 7.4 Threat of new entrants
      • Threat of new entrants - Impact of key factors in 2023 and 2028
    • 7.5 Threat of substitutes
      • Threat of substitutes - Impact of key factors in 2023 and 2028
    • 7.6 Threat of rivalry
      • Threat of rivalry - Impact of key factors in 2023 and 2028
    • 7.7 Market condition
      • Chart on Market condition - Five forces 2023 and 2028

    8 Market Segmentation by Application

    • 8.1 Market segments
      • Chart on Application - Market share 2023-2028 (%)
      • Data Table on Application - Market share 2023-2028 (%)
    • 8.2 Comparison by Application
      • Chart on Comparison by Application
      • Data Table on Comparison by Application
    • 8.3 Oil and gas - Market size and forecast 2023-2028
      • Chart on Oil and gas - Market size and forecast 2023-2028 ($ million)
      • Data Table on Oil and gas - Market size and forecast 2023-2028 ($ million)
      • Chart on Oil and gas - Year-over-year growth 2023-2028 (%)
      • Data Table on Oil and gas - Year-over-year growth 2023-2028 (%)
    • 8.4 Chemical industry - Market size and forecast 2023-2028
      • Chart on Chemical industry - Market size and forecast 2023-2028 ($ million)
      • Data Table on Chemical industry - Market size and forecast 2023-2028 ($ million)
      • Chart on Chemical industry - Year-over-year growth 2023-2028 (%)
      • Data Table on Chemical industry - Year-over-year growth 2023-2028 (%)
    • 8.5 Water and wastewater management - Market size and forecast 2023-2028
      • Chart on Water and wastewater management - Market size and forecast 2023-2028 ($ million)
      • Data Table on Water and wastewater management - Market size and forecast 2023-2028 ($ million)
      • Chart on Water and wastewater management - Year-over-year growth 2023-2028 (%)
      • Data Table on Water and wastewater management - Year-over-year growth 2023-2028 (%)
    • 8.6 Food and beverage - Market size and forecast 2023-2028
      • Chart on Food and beverage - Market size and forecast 2023-2028 ($ million)
      • Data Table on Food and beverage - Market size and forecast 2023-2028 ($ million)
      • Chart on Food and beverage - Year-over-year growth 2023-2028 (%)
      • Data Table on Food and beverage - Year-over-year growth 2023-2028 (%)
    • 8.7 Others - Market size and forecast 2023-2028
      • Chart on Others - Market size and forecast 2023-2028 ($ million)
      • Data Table on Others - Market size and forecast 2023-2028 ($ million)
      • Chart on Others - Year-over-year growth 2023-2028 (%)
      • Data Table on Others - Year-over-year growth 2023-2028 (%)
    • 8.8 Market opportunity by Application
      • Market opportunity by Application ($ million)
      • Data Table on Market opportunity by Application ($ million)

    9 Market Segmentation by Product

    • 9.1 Market segments
      • Chart on Product - Market share 2023-2028 (%)
      • Data Table on Product - Market share 2023-2028 (%)
    • 9.2 Comparison by Product
      • Chart on Comparison by Product
      • Data Table on Comparison by Product
    • 9.3 Non-invasive systems - Market size and forecast 2023-2028
      • Chart on Non-invasive systems - Market size and forecast 2023-2028 ($ million)
      • Data Table on Non-invasive systems - Market size and forecast 2023-2028 ($ million)
      • Chart on Non-invasive systems - Year-over-year growth 2023-2028 (%)
      • Data Table on Non-invasive systems - Year-over-year growth 2023-2028 (%)
    • 9.4 Invasive systems - Market size and forecast 2023-2028
      • Chart on Invasive systems - Market size and forecast 2023-2028 ($ million)
      • Data Table on Invasive systems - Market size and forecast 2023-2028 ($ million)
      • Chart on Invasive systems - Year-over-year growth 2023-2028 (%)
      • Data Table on Invasive systems - Year-over-year growth 2023-2028 (%)
    • 9.5 Market opportunity by Product
      • Market opportunity by Product ($ million)
      • Data Table on Market opportunity by Product ($ million)

    10 Customer Landscape

    • 10.1 Customer landscape overview
      • Analysis of price sensitivity, lifecycle, customer purchase basket, adoption rates, and purchase criteria

    11 Geographic Landscape

    • 11.1 Geographic segmentation
      • Chart on Market share by geography 2023-2028 (%)
      • Data Table on Market share by geography 2023-2028 (%)
    • 11.2 Geographic comparison
      • Chart on Geographic comparison
      • Data Table on Geographic comparison
    • 11.3 North America - Market size and forecast 2023-2028
      • Chart on North America - Market size and forecast 2023-2028 ($ million)
      • Data Table on North America - Market size and forecast 2023-2028 ($ million)
      • Chart on North America - Year-over-year growth 2023-2028 (%)
      • Data Table on North America - Year-over-year growth 2023-2028 (%)
    • 11.4 Europe - Market size and forecast 2023-2028
      • Chart on Europe - Market size and forecast 2023-2028 ($ million)
      • Data Table on Europe - Market size and forecast 2023-2028 ($ million)
      • Chart on Europe - Year-over-year growth 2023-2028 (%)
      • Data Table on Europe - Year-over-year growth 2023-2028 (%)
    • 11.5 APAC - Market size and forecast 2023-2028
      • Chart on APAC - Market size and forecast 2023-2028 ($ million)
      • Data Table on APAC - Market size and forecast 2023-2028 ($ million)
      • Chart on APAC - Year-over-year growth 2023-2028 (%)
      • Data Table on APAC - Year-over-year growth 2023-2028 (%)
    • 11.6 South America - Market size and forecast 2023-2028
      • Chart on South America - Market size and forecast 2023-2028 ($ million)
      • Data Table on South America - Market size and forecast 2023-2028 ($ million)
      • Chart on South America - Year-over-year growth 2023-2028 (%)
      • Data Table on South America - Year-over-year growth 2023-2028 (%)
    • 11.7 Middle East and Africa - Market size and forecast 2023-2028
      • Chart on Middle East and Africa - Market size and forecast 2023-2028 ($ million)
      • Data Table on Middle East and Africa - Market size and forecast 2023-2028 ($ million)
      • Chart on Middle East and Africa - Year-over-year growth 2023-2028 (%)
      • Data Table on Middle East and Africa - Year-over-year growth 2023-2028 (%)
    • 11.8 US - Market size and forecast 2023-2028
      • Chart on US - Market size and forecast 2023-2028 ($ million)
      • Data Table on US - Market size and forecast 2023-2028 ($ million)
      • Chart on US - Year-over-year growth 2023-2028 (%)
      • Data Table on US - Year-over-year growth 2023-2028 (%)
    • 11.9 China - Market size and forecast 2023-2028
      • Chart on China - Market size and forecast 2023-2028 ($ million)
      • Data Table on China - Market size and forecast 2023-2028 ($ million)
      • Chart on China - Year-over-year growth 2023-2028 (%)
      • Data Table on China - Year-over-year growth 2023-2028 (%)
    • 11.10 Germany - Market size and forecast 2023-2028
      • Chart on Germany - Market size and forecast 2023-2028 ($ million)
      • Data Table on Germany - Market size and forecast 2023-2028 ($ million)
      • Chart on Germany - Year-over-year growth 2023-2028 (%)
      • Data Table on Germany - Year-over-year growth 2023-2028 (%)
    • 11.11 France - Market size and forecast 2023-2028
      • Chart on France - Market size and forecast 2023-2028 ($ million)
      • Data Table on France - Market size and forecast 2023-2028 ($ million)
      • Chart on France - Year-over-year growth 2023-2028 (%)
      • Data Table on France - Year-over-year growth 2023-2028 (%)
    • 11.12 Japan - Market size and forecast 2023-2028
      • Chart on Japan - Market size and forecast 2023-2028 ($ million)
      • Data Table on Japan - Market size and forecast 2023-2028 ($ million)
      • Chart on Japan - Year-over-year growth 2023-2028 (%)
      • Data Table on Japan - Year-over-year growth 2023-2028 (%)
    • 11.13 India - Market size and forecast 2023-2028
      • Chart on India - Market size and forecast 2023-2028 ($ million)
      • Data Table on India - Market size and forecast 2023-2028 ($ million)
      • Chart on India - Year-over-year growth 2023-2028 (%)
      • Data Table on India - Year-over-year growth 2023-2028 (%)
    • 11.14 Market opportunity by geography
      • Market opportunity by geography ($ million)
      • Data Tables on Market opportunity by geography ($ million)

    12 Drivers, Challenges, and Opportunity/Restraints

    • 12.1 Market drivers
      • 12.2 Market challenges
        • 12.3 Impact of drivers and challenges
          • Impact of drivers and challenges in 2023 and 2028
        • 12.4 Market opportunities/restraints

          13 Competitive Landscape

          • 13.1 Overview
            • 13.2 Competitive Landscape
              • Overview on criticality of inputs and factors of differentiation
            • 13.3 Landscape disruption
              • Overview on factors of disruption
            • 13.4 Industry risks
              • Impact of key risks on business

            14 Competitive Analysis

            • 14.1 Companies profiled
              • Companies covered
            • 14.2 Company ranking index
              • Company ranking index
            • 14.3 Market positioning of companies
              • Matrix on companies position and classification
            • 14.4 ABB Ltd.
              • ABB Ltd. - Overview
              • ABB Ltd. - Business segments
              • ABB Ltd. - Key news
              • ABB Ltd. - Key offerings
              • ABB Ltd. - Segment focus
              • SWOT
            • 14.5 Automation Products Group Inc.
              • Automation Products Group Inc. - Overview
              • Automation Products Group Inc. - Product / Service
              • Automation Products Group Inc. - Key offerings
              • SWOT
            • 14.6 Emerson Electric Co.
              • Emerson Electric Co. - Overview
              • Emerson Electric Co. - Business segments
              • Emerson Electric Co. - Key news
              • Emerson Electric Co. - Key offerings
              • Emerson Electric Co. - Segment focus
              • SWOT
            • 14.7 Endress Hauser Group Services AG
              • Endress Hauser Group Services AG - Overview
              • Endress Hauser Group Services AG - Product / Service
              • Endress Hauser Group Services AG - Key news
              • Endress Hauser Group Services AG - Key offerings
              • SWOT
            • 14.8 Fuji Electric Co. Ltd.
              • Fuji Electric Co. Ltd. - Overview
              • Fuji Electric Co. Ltd. - Business segments
              • Fuji Electric Co. Ltd. - Key news
              • Fuji Electric Co. Ltd. - Key offerings
              • Fuji Electric Co. Ltd. - Segment focus
              • SWOT
            • 14.9 Garner Industries LLC
              • Garner Industries LLC - Overview
              • Garner Industries LLC - Product / Service
              • Garner Industries LLC - Key offerings
              • SWOT
            • 14.10 Gems Sensors Inc.
              • Gems Sensors Inc. - Overview
              • Gems Sensors Inc. - Product / Service
              • Gems Sensors Inc. - Key offerings
              • SWOT
            • 14.11 Honeywell International Inc.
              • Honeywell International Inc. - Overview
              • Honeywell International Inc. - Business segments
              • Honeywell International Inc. - Key news
              • Honeywell International Inc. - Key offerings
              • Honeywell International Inc. - Segment focus
              • SWOT
            • 14.12 KROHNE Messtechnik GmbH
              • KROHNE Messtechnik GmbH - Overview
              • KROHNE Messtechnik GmbH - Product / Service
              • KROHNE Messtechnik GmbH - Key news
              • KROHNE Messtechnik GmbH - Key offerings
              • SWOT
            • 14.13 Omega Engineering Inc.
              • Omega Engineering Inc. - Overview
              • Omega Engineering Inc. - Product / Service
              • Omega Engineering Inc. - Key offerings
              • SWOT
            • 14.14 Schneider Electric SE
              • Schneider Electric SE - Overview
              • Schneider Electric SE - Business segments
              • Schneider Electric SE - Key news
              • Schneider Electric SE - Key offerings
              • Schneider Electric SE - Segment focus
              • SWOT
            • 14.15 Siemens AG
              • Siemens AG - Overview
              • Siemens AG - Business segments
              • Siemens AG - Key news
              • Siemens AG - Key offerings
              • Siemens AG - Segment focus
              • SWOT
            • 14.16 Tek-Trol LLC
              • Tek-Trol LLC - Overview
              • Tek-Trol LLC - Product / Service
              • Tek-Trol LLC - Key offerings
              • SWOT
            • 14.17 VEGA Grieshaber KG
              • VEGA Grieshaber KG - Overview
              • VEGA Grieshaber KG - Product / Service
              • VEGA Grieshaber KG - Key offerings
              • SWOT
            • 14.18 Yokogawa Electric Corp.
              • Yokogawa Electric Corp. - Overview
              • Yokogawa Electric Corp. - Business segments
              • Yokogawa Electric Corp. - Key news
              • Yokogawa Electric Corp. - Key offerings
              • Yokogawa Electric Corp. - Segment focus
              • SWOT

            15 Appendix

            • 15.1 Scope of the report
              • 15.2 Inclusions and exclusions checklist
                • Inclusions checklist
                • Exclusions checklist
              • 15.3 Currency conversion rates for US$
                • Currency conversion rates for US$
              • 15.4 Research methodology
                • Research methodology
              • 15.5 Data procurement
                • Information sources
              • 15.6 Data validation
                • Data validation
              • 15.7 Validation techniques employed for market sizing
                • Validation techniques employed for market sizing
              • 15.8 Data synthesis
                • Data synthesis
              • 360 degree market analysis
                • 360 degree market analysis
              • 15.10 List of abbreviations
                • List of abbreviations

              Research Methodology

              Technavio presents a detailed picture of the market by way of study, synthesis, and summation of data from multiple sources. The analysts have presented the various facets of the market with a particular focus on identifying the key industry influencers. The data thus presented is comprehensive, reliable, and the result of extensive research, both primary and secondary.

              INFORMATION SOURCES

              Primary sources

              • Manufacturers and suppliers
              • Channel partners
              • Industry experts
              • Strategic decision makers

              Secondary sources

              • Industry journals and periodicals
              • Government data
              • Financial reports of key industry players
              • Historical data
              • Press releases

              DATA ANALYSIS

              Data Synthesis

              • Collation of data
              • Estimation of key figures
              • Analysis of derived insights

              Data Validation

              • Triangulation with data models
              • Reference against proprietary databases
              • Corroboration with industry experts

              REPORT WRITING

              Qualitative

              • Market drivers
              • Market challenges
              • Market trends
              • Five forces analysis

              Quantitative

              • Market size and forecast
              • Market segmentation
              • Geographical insights
              • Competitive landscape

              Interested in this report?

              Get your sample now to see our research methodology and insights!

              Download Now

              Frequently Asked Questions

              Tank Level Monitoring System market growth will increase by $ 266.8 mn during 2024-2028 .

              The Tank Level Monitoring System market is expected to grow at a CAGR of 5.33% during 2024-2028 .

              Tank Level Monitoring System market is segmented by Application( Oil and gas, Chemical industry, Water and wastewater management, Food and beverage, Others) Product( Non-invasive systems, Invasive systems)

              ABB Ltd., AMETEK Inc., Automation Products Group Inc., Emerson Electric Co., Endress Hauser Group Services AG, FAFNIR GmbH, Flowline, Inc, Fuji Electric Co. Ltd., Garner Industries LLC, Gems Sensors Inc., Graco Inc., Honeywell International Inc., IVEDA SOLUTIONS, INC., KROHNE Messtechnik GmbH, L and J Technologies, Madison Co., Inc., Omega Engineering Inc., OMNTEC Mfg., Inc., Rochester Sensors, Schneider Electric SE, Siemens AG, Tag IT Technologies, Tek-Trol LLC, Temposonics LLC, VEGA Grieshaber KG, Yokogawa Electric Corp. are a few of the key vendors in the Tank Level Monitoring System market.

              North America will register the highest growth rate of 34% among the other regions. Therefore, the Tank Level Monitoring System market in North America is expected to garner significant business opportunities for the vendors during the forecast period.

              US, Germany, China, France, Japan, India

              • Growing demand for tank level monitoring system from process industries is the driving factor this market.

              The Tank Level Monitoring System market vendors should focus on grabbing business opportunities from the Oil and gas segment as it accounted for the largest market share in the base year.