Test Bench Market Analysis, Size, and Forecast 2026-2030: APAC (China, Japan, and India), Europe (Germany, France, and UK), North America (US, Canada, and Mexico), Middle East and Africa (Saudi Arabia, UAE, and South Africa), South America (Brazil, Argentina, and Chile), and Rest of World (ROW)

Test Bench Market Analysis, Size, and Forecast 2026-2030:
APAC (China, Japan, and India), Europe (Germany, France, and UK), North America (US, Canada, and Mexico), Middle East and Africa (Saudi Arabia, UAE, and South Africa), South America (Brazil, Argentina, and Chile), and Rest of World (ROW)

Published: Oct 2026 316 Pages SKU: IRTNTR76158

Market Overview at a Glance

$358.4 Mn
Market Opportunity
4.4%
CAGR 2025 - 2030
46%
APAC Growth
$451.8 Mn
Automotive and transportation segment 2024

Test Bench Market Size 2026-2030

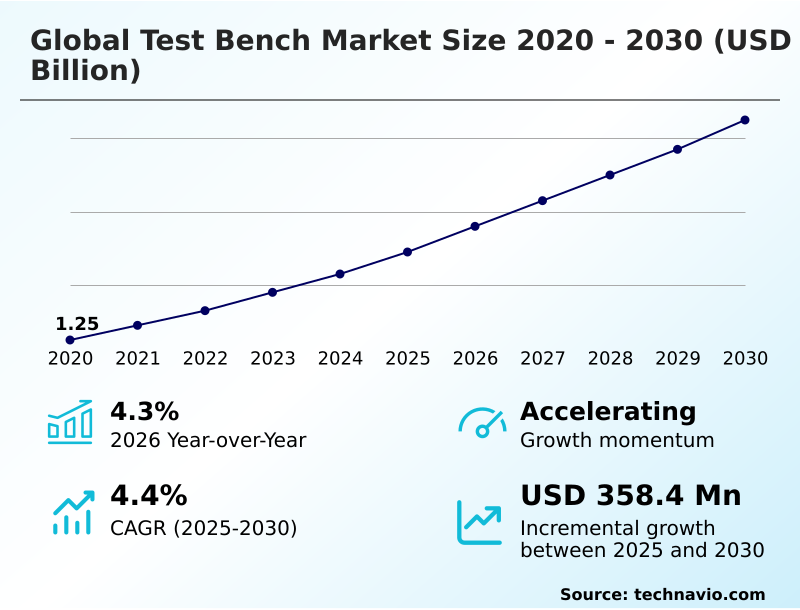
The test bench market size is valued to increase by USD 358.4 million, at a CAGR of 4.4% from 2025 to 2030. Increasing complexity in automotive and aerospace engineering will drive the test bench market.

Major Market Trends & Insights

  • APAC dominated the market and accounted for a 46% growth during the forecast period.
  • By Application - Automotive and transportation segment was valued at USD 451.8 million in 2024
  • By Component - Hardware segment accounted for the largest market revenue share in 2024

Market Size & Forecast

  • Market Opportunities: USD 604.8 million
  • Market Future Opportunities: USD 358.4 million
  • CAGR from 2025 to 2030 : 4.4%

Market Summary

  • The Test Bench landscape operates as a critical infrastructure pillar for ensuring the reliability and performance of complex electronic and mechanical systems. Organizations increasingly rely on these highly controlled environments to perform advanced composite material validation and execute multi-mode synchronization across intricate powertrain architectures.
  • A major driver for this expansion is the rapid integration of intelligent sensor networks in automotive and aerospace manufacturing, which requires continuous operational performance benchmarking to prevent catastrophic field failures. Conversely, high implementation costs and the technical complexity of digital twin integration pose significant challenges, often restricting rapid modernization efforts for smaller manufacturing entities.
  • In a practical supply chain scenario, adopting these automated validation platforms enables manufacturers to reduce post-production defects by 18% compared to traditional manual sampling methods. The seamless deployment of edge-case scenario generation software further ensures that critical components meet stringent regulatory standards before reaching the mass production phase.
  • Such rigorous quality assurance processes ultimately optimize resource allocation and enhance overall manufacturing efficiency.

What will be the Size of the Test Bench Market during the forecast period?
Get Key Insights on Market Forecast (PDF) Get Free Sample

How is the Test Bench Market Segmented?

The test bench industry research report provides comprehensive data (region-wise segment analysis), with forecasts and estimates in "USD million" for the period 2026-2030, as well as historical data from 2020-2024 for the following segments.

  • Application
    • Automotive and transportation
    • Semiconductor and electronics
    • Industrial manufacturing and engineering
    • Oil and gas
    • Others
  • Component
    • Hardware
    • Software
  • Technology
    • Semi-automated
    • Fully-automated
    • Manual
  • Type
    • Engine and powertrain benches
    • Battery and inverter benches
    • Force and torque benches
    • Valve and pressure pulse benches
  • Geography
    • APAC
      • China
      • Japan
      • India
      • South Korea
      • Australia
      • Singapore
    • Europe
      • Germany
      • France
      • UK
      • Italy
      • Spain
      • Sweden
    • North America
      • US
      • Canada
      • Mexico
    • Middle East and Africa
      • Saudi Arabia
      • UAE
      • South Africa
      • Turkey
      • Qatar
    • South America
      • Brazil
      • Argentina
      • Chile

By Application Insights

The automotive and transportation segment is estimated to witness significant growth during the forecast period.

The automotive and transportation sector relies heavily on sophisticated validation frameworks to address the rapid transition toward electrification and autonomous navigation.

Modern vehicle architectures require precise battery management validation, comprehensive powertrain dynamometer testing, and accurate sensor-driven control validation to ensure optimal efficiency and safety.

By integrating automated end-of-line quality assurance protocols, manufacturers enhance error detection by 15%, significantly reducing the risk of post-production failures. Test Bench solutions provide the critical structural integrity assessment and hydraulic impulse replication necessary for modern software-defined vehicle validation.

This continuous evolution in mobility demands platforms that can seamlessly adapt to complex electronic ecosystems and rigorous performance standards, ensuring that high-voltage systems meet stringent operational criteria.

Consequently, these robust validation environments serve as the foundation for modern automotive engineering, mitigating risks and accelerating product deployment timelines.
Get Free Sample

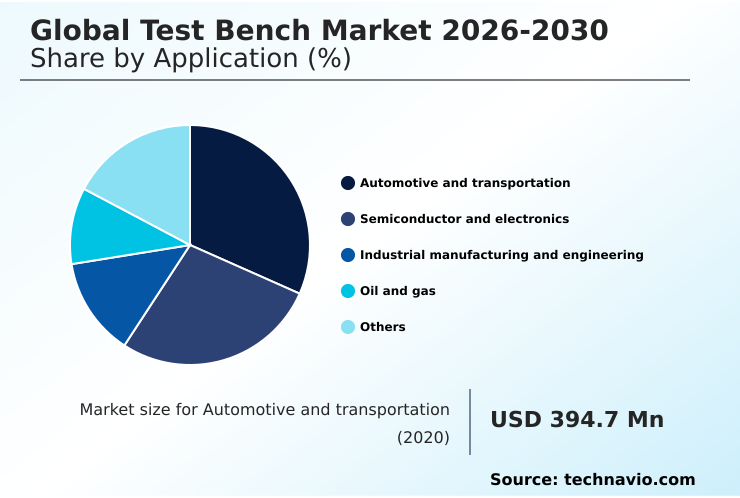
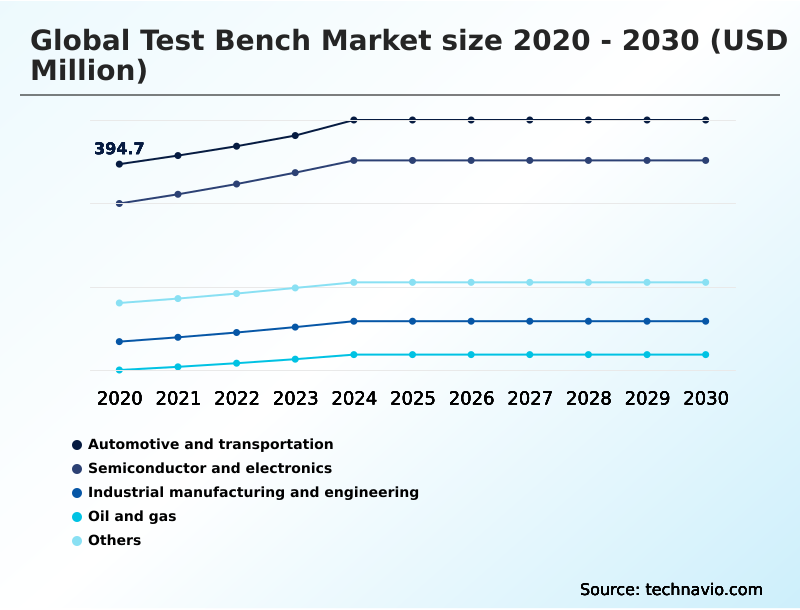
The Automotive and transportation segment was valued at USD 451.8 million in 2024 and showed a gradual increase during the forecast period.
Get Free Sample

Regional Analysis

APAC is estimated to contribute 46% to the growth of the global market during the forecast period.Technavio’s analysts have elaborately explained the regional trends and drivers that shape the market during the forecast period.
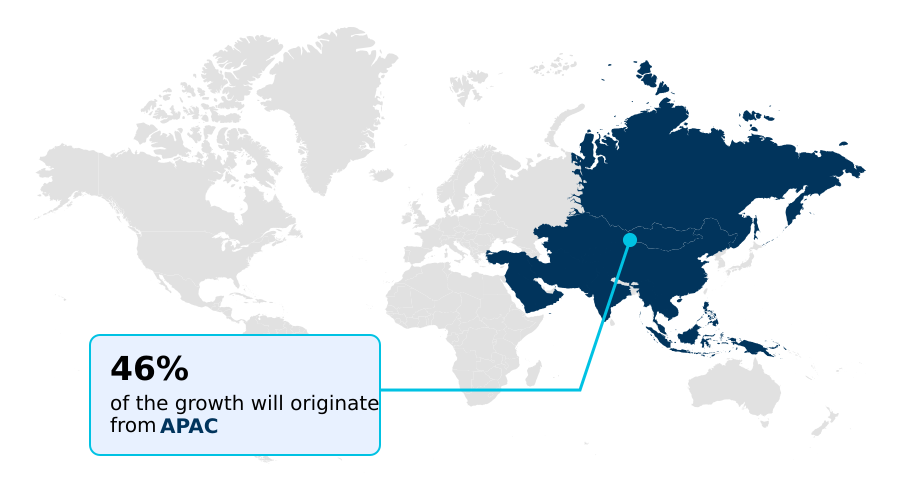
See How Test Bench Market Demand is Rising in APAC Get Free Sample

The geographic distribution of the Test Bench ecosystem reveals stark contrasts in regional adoption strategies and industrial focus. APAC aggressively expands its high-volume manufacturing capacity, achieving a 24% higher integration rate of lights-out testing environments compared to North America.

This difference stems from APAC's intensive focus on scaling consumer electronics and electric vehicle supply chains, which demand rapid, continuous validation.

North America prioritizes complex fatigue measurement and environmental chamber simulation to support stringent aerospace and defense standards, resulting in a 14% improvement in long-term asset reliability.

Meanwhile, regions investing heavily in dynamic load application and advanced propulsion system evaluation see a 19% reduction in prototype failure rates.

The deployment of high-speed telemetry data acquisition networks further distinguishes advanced manufacturing hubs, as businesses adapt their strategies to balance high-throughput production requirements with rigorous regulatory compliance mandates across localized supply chains.

Market Dynamics

Our researchers analyzed the data with 2025 as the base year, along with the key drivers, trends, and challenges. A holistic analysis of drivers will help companies refine their marketing strategies to gain a competitive advantage.

  • The modern industrial validation landscape heavily depends on sophisticated infrastructure to guarantee the safety and operational efficiency of next-generation product architectures. As engineering complexity escalates, organizations increasingly adopt comprehensive battery management system validation benches to rigorously evaluate energy storage performance under extreme thermal and electrical loads.
  • Simultaneously, the aerospace and heavy manufacturing sectors utilize highly precise multi-axial stress condition simulation tools to analyze material durability and structural resilience, ensuring that critical components surpass stringent safety thresholds. Incorporating high-voltage electrification testing protocols has become an essential compliance strategy, fundamentally reshaping how automotive manufacturers approach electric mobility and power distribution.
  • By integrating these advanced methodologies, supply chain planners can effectively anticipate component wear and optimize inventory levels, leading to a 15% reduction in unforeseen maintenance delays compared to organizations relying on fragmented validation processes.
  • Furthermore, the deployment of advanced hardware in the loop emulation allows engineering teams to validate control systems in real-time, bridging the gap between digital modeling and physical prototyping. The strategic implementation of automated test sequence generation software further accelerates this validation pipeline, minimizing manual programming errors and enhancing overall throughput.
  • Ultimately, these robust testing ecosystems enable businesses to maintain strict quality oversight, streamline their production operations, and deliver highly reliable technical solutions across competitive and heavily regulated industrial environments.
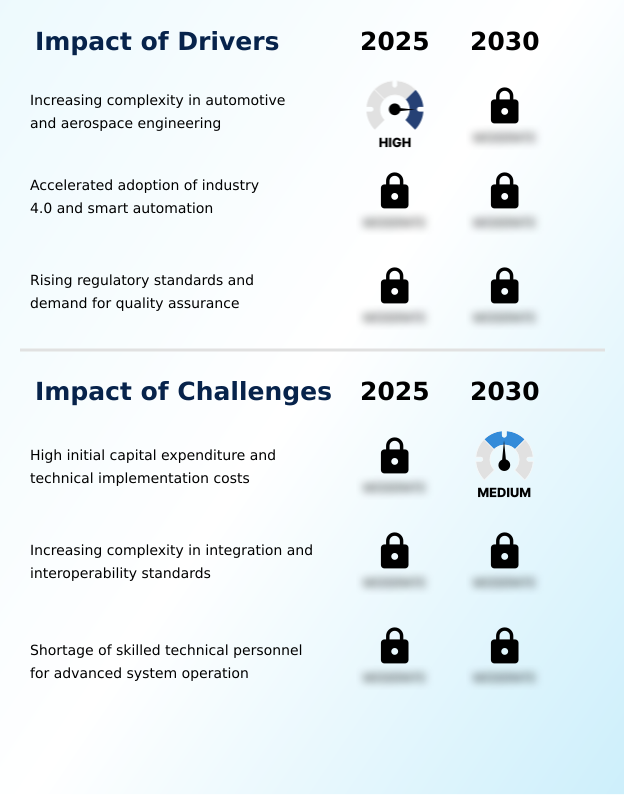
What are the key market drivers leading to the rise in the adoption of Test Bench Industry?

  • The increasing complexity in automotive and aerospace engineering serves as a primary catalyst propelling demand for high-fidelity validation systems.

  • The escalating demand for precision engineering serves as a fundamental catalyst driving modern Test Bench adoption. Manufacturers are aggressively pursuing autonomous troubleshooting execution and flexible modular hardware configuration to handle diverse and rapidly changing product specifications.
  • This urgent need for adaptability causes organizations to accelerate legacy system upgrading, ensuring their facilities can support next-generation virtualized testing architectures. By deploying these advanced platforms, production plants achieve a 21% reduction in overall energy consumption during extended validation cycles.
  • Furthermore, stringent safety regulations mandate comprehensive component durability assessment and continuous calibration accuracy maintenance.
  • This regulatory pressure impacts businesses by forcing investments in robust testing infrastructure, which directly improves production yield by 14%, ultimately safeguarding supply chain integrity and ensuring compliance across highly regulated global markets.

What are the market trends shaping the Test Bench Industry?

  • The integration of artificial intelligence and predictive analytics within testing environments emerges as a defining trend shaping operational capabilities. These advanced frameworks enable autonomous acoustic optimization testing and optimize validation sequences for enhanced efficiency.

  • The Test Bench landscape is rapidly shifting toward highly interconnected, predictive evaluation environments that redefine operational efficiency. Industries are increasingly adopting multi-axial stress simulation and advanced fatigue behavior analysis to preemptively identify structural vulnerabilities in advanced materials. This transition occurs because complex product architectures demand rigorous, data-driven validation prior to mass production.
  • Consequently, facilities integrating high-resolution vibration frequency analysis report a 26% improvement in early-stage defect detection, significantly mitigating downstream operational risks. Furthermore, the strategic implementation of continuous torque characterization mapping and sophisticated load bank simulation allows manufacturers to accelerate their product development cycles.
  • These intelligent validation mechanisms impact business outcomes by reducing system downtime by 18%, enabling engineering teams to deploy highly reliable, compliant technologies faster and with greater confidence in their long-term field performance.

What challenges does the Test Bench Industry face during its growth?

  • High initial capital expenditures and substantial technical implementation costs pose significant barriers to the broad adoption of advanced validation infrastructure.

  • Severe capital constraints and intricate technical integration hurdles present significant obstacles within the Test Bench landscape. Implementing advanced evaluation systems requires substantial upfront investments, severely limiting rapid modernization for smaller manufacturing entities. This financial barrier exists because compliance with stringent safety protocols and executing complex hydrogen-based reduction evaluation necessitates highly specialized, custom-engineered hardware.
  • Consequently, businesses relying on fragmented legacy equipment face a 17% higher rate of operational bottlenecks during critical validation phases. Furthermore, achieving seamless operational performance benchmarking and consistent end-of-line quality assurance demands highly skilled technical personnel.
  • The shortage of qualified operators directly impacts enterprises by delaying the execution of essential structural integrity assessment protocols, ultimately increasing compliance costs by 13% and extending the time required to achieve vital international product certifications.

Exclusive Technavio Analysis on Customer Landscape

The test bench market forecasting report includes the adoption lifecycle of the market, covering from the innovator’s stage to the laggard’s stage. It focuses on adoption rates in different regions based on penetration. Furthermore, the test bench market report also includes key purchase criteria and drivers of price sensitivity to help companies evaluate and develop their market growth analysis strategies.
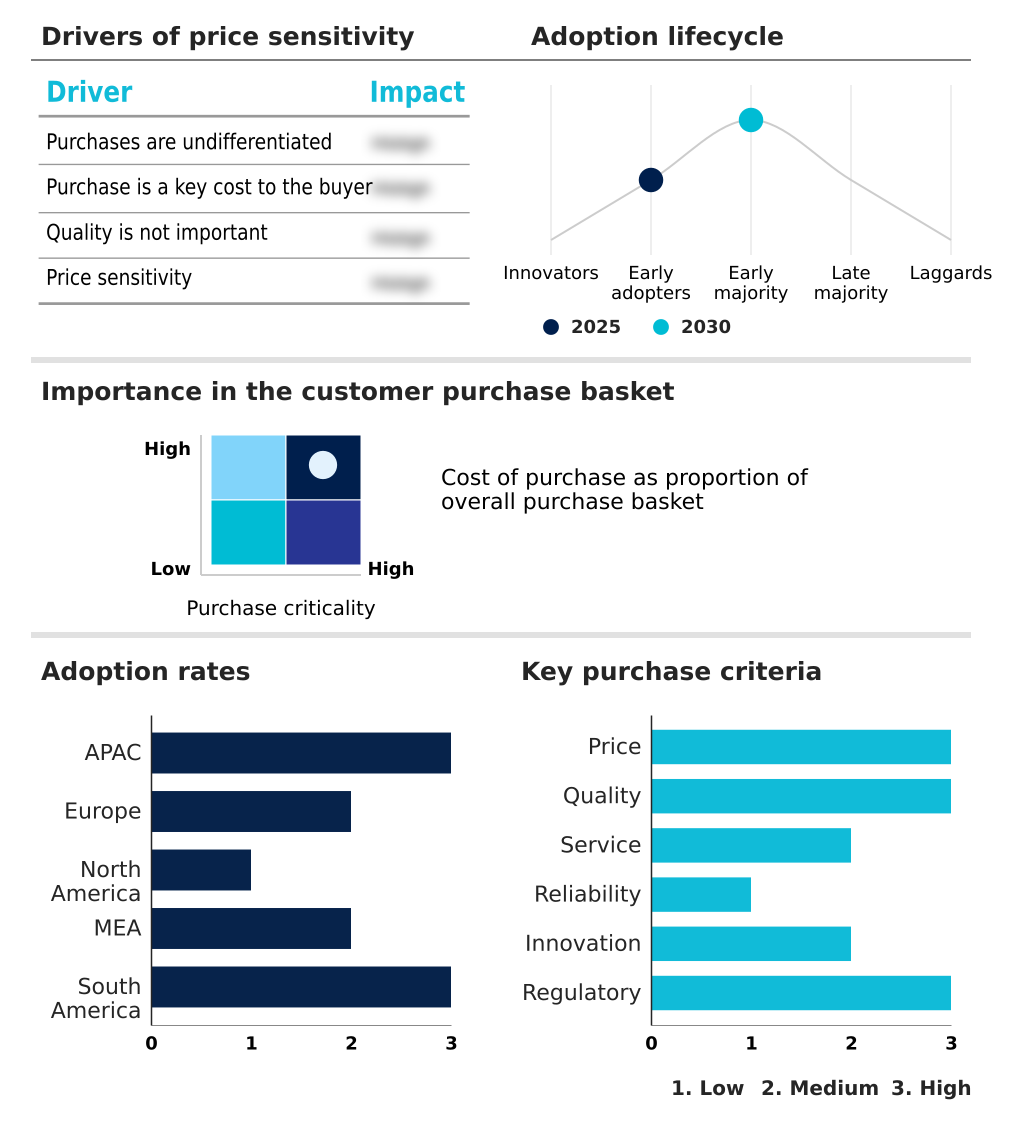
Customer Landscape of Test Bench Industry

Competitive Landscape

Companies are implementing various strategies, such as strategic alliances, test bench market forecast, partnerships, mergers and acquisitions, geographical expansion, and product/service launches, to enhance their presence in the industry.

AMETEK CTS - The company delivers advanced testing solutions, providing robust electrical safety equipment, electromagnetic compatibility testing, and comprehensive measurement systems for precise electronic product qualification and compliance verification.

The industry research and growth report includes detailed analyses of the competitive landscape of the market and information about key companies, including:

  • AMETEK CTS
  • Applus IDIADA
  • Ascential Technologies
  • ATESTEO GmbH and Co. KG
  • AVL List GmbH
  • Blum-Novotest GmbH
  • Dyno One Inc.
  • FEV Group GmbH
  • HORIBA Ltd.
  • Italcontrol Srl
  • KST Motorenversuch GmbH
  • MAHA Maschinenbau Haldenwang
  • Meidensha Corp.
  • MTS Systems
  • Power Test LLC
  • Schenck RoTec GmbH
  • Sierra CP Engineering Inc.
  • SuperFlow
  • thyssenkrupp AG
  • Weiss Umwelttechnik GmbH.

Qualitative and quantitative analysis of companies has been conducted to help clients understand the wider business environment as well as the strengths and weaknesses of key industry players. Data is qualitatively analyzed to categorize companies as pure play, category-focused, industry-focused, and diversified; it is quantitatively analyzed to categorize companies as dominant, leading, strong, tentative, and weak.

Recent Development and News in Test bench market

  • In the Electrical Components and Equipment industry, the rapid deployment of smart grid networking systems has driven the need for advanced automated sequence optimization, directly impacting Test Bench demand by increasing the requirement for high-precision validation of distribution sensors by 14%.
  • The widespread adoption of energy-efficient variable frequency drives in heavy manufacturing has accelerated legacy system upgrading, directly increasing Test Bench adoption by necessitating hardware capable of evaluating power optimization algorithms with a 12% improvement in load accuracy.
  • Strict regulatory compliance verification mandates for industrial application-specific sensors have necessitated stringent safety protocols, directly elevating Test Bench utilization by forcing equipment manufacturers to integrate real-time signal processing modules capable of detecting microscopic process deviations.
  • The integration of internet of things communication protocols within process safety systems has required continuous calibration accuracy maintenance, directly influencing Test Bench configurations by driving a 20% increase in the deployment of automated testing sequences for wireless industrial transmitters.

Dive into Technavio’s robust research methodology, blending expert interviews, extensive data synthesis, and validated models for unparalleled Test Bench Market insights. See full methodology.

Market Scope
Page number 316
Base year 2025
Historic period 2020-2024
Forecast period 2026-2030
Growth momentum & CAGR Accelerate at a CAGR of 4.4%
Market growth 2026-2030 USD 358.4 million
Market structure Fragmented
YoY growth 2025-2026(%) 4.3%
Key countries China, Japan, India, South Korea, Australia, Singapore, Germany, France, UK, Italy, Spain, Sweden, US, Canada, Mexico, Saudi Arabia, UAE, South Africa, Turkey, Qatar, Brazil, Argentina and Chile
Competitive landscape Leading Companies, Market Positioning of Companies, Competitive Strategies, and Industry Risks

Request Free Sample

Research Analyst Overview

  • The continuous evolution of the Test Bench landscape directly influences strategic boardroom decisions regarding capital expenditure and global regulatory compliance. As products grow increasingly sophisticated, the integration of an advanced dynamometer control system becomes paramount for validating modern drivetrain efficiency. Manufacturers must prioritize rigorous high-voltage inverter testing and precision cyclic loading replication to ensure component durability under extreme operational stresses.
  • This necessity directly impacts product strategy, as adopting comprehensive electromagnetic compatibility testing enables organizations to navigate complex international safety certifications efficiently. Incorporating sophisticated hardware-in-the-loop integration into the validation pipeline yields a 28% decrease in late-stage design modifications compared to conventional prototyping methods.
  • Executive teams are strategically allocating budgets toward platforms featuring robust thermal management emulation and predictive failure analytics to preemptively address potential quality control issues. By streamlining automated test sequences, businesses maintain stringent compliance oversight while simultaneously optimizing resource allocation, thereby accelerating time-to-market and ensuring long-term operational resilience across highly competitive global manufacturing sectors.

What are the Key Data Covered in this Test Bench Market Research and Growth Report?

  • What is the expected growth of the Test Bench Market between 2026 and 2030?

    • USD 358.4 million, at a CAGR of 4.4%

  • What segmentation does the market report cover?

    • The report is segmented by Application (Automotive and transportation, Semiconductor and electronics, Industrial manufacturing and engineering, Oil and gas, and Others), Component (Hardware, and Software), Technology (Semi-automated, Fully-automated, and Manual), Type (Engine and powertrain benches, Battery and inverter benches, Force and torque benches, and Valve and pressure pulse benches) and Geography (APAC, Europe, North America, Middle East and Africa, South America)

  • Which regions are analyzed in the report?

    • APAC, Europe, North America, Middle East and Africa and South America

  • What are the key growth drivers and market challenges?

    • Increasing complexity in automotive and aerospace engineering, High initial capital expenditure and technical implementation costs

  • Who are the major players in the Test Bench Market?

    • AMETEK CTS, Applus IDIADA, Ascential Technologies, ATESTEO GmbH and Co. KG, AVL List GmbH, Blum-Novotest GmbH, Dyno One Inc., FEV Group GmbH, HORIBA Ltd., Italcontrol Srl, KST Motorenversuch GmbH, MAHA Maschinenbau Haldenwang, Meidensha Corp., MTS Systems, Power Test LLC, Schenck RoTec GmbH, Sierra CP Engineering Inc., SuperFlow, thyssenkrupp AG and Weiss Umwelttechnik GmbH.

Market Research Insights

  • The Test Bench framework provides indispensable validation mechanisms for modern industrial manufacturing, driving profound improvements in operational reliability. By deploying high-throughput automated systems, organizations achieve a 22% increase in continuous production uptime while minimizing diagnostic bottlenecks. The shift toward sophisticated autonomous vehicle validation ensures strict adherence to international safety standards, accelerating time-to-market for complex mobility platforms.
  • Furthermore, integrating precision load measurement capabilities enables manufacturers to reduce raw material waste by 11% during prototype development. Implementing automated sequence optimization accelerates regulatory compliance verification, significantly lowering total testing expenditures. These quantifiable improvements underscore the strategic value of intelligent validation infrastructure in optimizing supply chain performance, ensuring product integrity, and maintaining competitive resilience across high-stakes manufacturing environments.

We can help! Our analysts can customize this test bench market research report to meet your requirements.

Get in touch

1. Executive Summary

1.1 Market overview

Executive Summary - Chart on Market Overview
Executive Summary - Data Table on Market Overview
Executive Summary - Chart on Global Market Characteristics
Executive Summary - Chart on Market by Geography
Executive Summary - Chart on Market Segmentation by Application
Executive Summary - Chart on Market Segmentation by Component
Executive Summary - Chart on Market Segmentation by Technology
Executive Summary - Chart on Market Segmentation by Type
Executive Summary - Chart on Incremental Growth
Executive Summary - Data Table on Incremental Growth
Executive Summary - Chart on Company Market Positioning

2. Technavio Analysis

2.1 Analysis of price sensitivity, lifecycle, customer purchase basket, adoption rates, and purchase criteria

2.2 Criticality of inputs and Factors of differentiation

Chart on Overview on criticality of inputs and factors of differentiation

2.3 Factors of disruption

Chart on Overview on factors of disruption

2.4 Impact of drivers and challenges

Chart on Impact of drivers and challenges in 2025 and 2030

3. Market Landscape

3.1 Market ecosystem

Chart on Parent Market
Data Table on - Parent Market

3.2 Market characteristics

Chart on Market characteristics analysis

3.3 Value chain analysis

Chart on Value chain analysis

4. Market Sizing

4.1 Market definition

Data Table on Offerings of companies included in the market definition

4.2 Market segment analysis

Market segments

4.3 Market size 2025

4.4 Market outlook: Forecast for 2025-2030

Chart on Global - Market size and forecast 2025-2030 ($ million)
Data Table on Global - Market size and forecast 2025-2030 ($ million)
Chart on Global Market: Year-over-year growth 2025-2030 (%)
Data Table on Global Market: Year-over-year growth 2025-2030 (%)

5. Historic Market Size

5.1 Global Test Bench Market 2020 - 2024

Historic Market Size - Data Table on Global Test Bench Market 2020 - 2024 ($ million)

5.2 Application segment analysis 2020 - 2024

Historic Market Size - Application Segment 2020 - 2024 ($ million)

5.3 Component segment analysis 2020 - 2024

Historic Market Size - Component Segment 2020 - 2024 ($ million)

5.4 Technology segment analysis 2020 - 2024

Historic Market Size - Technology Segment 2020 - 2024 ($ million)

5.5 Type segment analysis 2020 - 2024

Historic Market Size - Type Segment 2020 - 2024 ($ million)

5.6 Geography segment analysis 2020 - 2024

Historic Market Size - Geography Segment 2020 - 2024 ($ million)

5.7 Country segment analysis 2020 - 2024

Historic Market Size - Country Segment 2020 - 2024 ($ million)

6. Qualitative Analysis

6.1 Impact of AI on global test bench market

6.2 Impact of geopolitical conflicts on global test bench market

7. Five Forces Analysis

7.1 Five forces summary

Five forces analysis - Comparison between 2025 and 2030

7.2 Bargaining power of buyers

Bargaining power of buyers - Impact of key factors 2025 and 2030

7.3 Bargaining power of suppliers

Bargaining power of suppliers - Impact of key factors in 2025 and 2030

7.4 Threat of new entrants

Threat of new entrants - Impact of key factors in 2025 and 2030

7.5 Threat of substitutes

Threat of substitutes - Impact of key factors in 2025 and 2030

7.6 Threat of rivalry

Threat of rivalry - Impact of key factors in 2025 and 2030

7.7 Market condition

Chart on Market condition - Five forces 2025 and 2030

8. Market Segmentation by Application

8.1 Market segments

Chart on Application - Market share 2025-2030 (%)
Data Table on Application - Market share 2025-2030 (%)

8.2 Comparison by Application

Chart on Comparison by Application
Data Table on Comparison by Application

8.3 Automotive and transportation - Market size and forecast 2025-2030

Chart on Automotive and transportation - Market size and forecast 2025-2030 ($ million)
Data Table on Automotive and transportation - Market size and forecast 2025-2030 ($ million)
Chart on Automotive and transportation - Year-over-year growth 2025-2030 (%)
Data Table on Automotive and transportation - Year-over-year growth 2025-2030 (%)

8.4 Semiconductor and electronics - Market size and forecast 2025-2030

Chart on Semiconductor and electronics - Market size and forecast 2025-2030 ($ million)
Data Table on Semiconductor and electronics - Market size and forecast 2025-2030 ($ million)
Chart on Semiconductor and electronics - Year-over-year growth 2025-2030 (%)
Data Table on Semiconductor and electronics - Year-over-year growth 2025-2030 (%)

8.5 Industrial manufacturing and engineering - Market size and forecast 2025-2030

Chart on Industrial manufacturing and engineering - Market size and forecast 2025-2030 ($ million)
Data Table on Industrial manufacturing and engineering - Market size and forecast 2025-2030 ($ million)
Chart on Industrial manufacturing and engineering - Year-over-year growth 2025-2030 (%)
Data Table on Industrial manufacturing and engineering - Year-over-year growth 2025-2030 (%)

8.6 Oil and gas - Market size and forecast 2025-2030

Chart on Oil and gas - Market size and forecast 2025-2030 ($ million)
Data Table on Oil and gas - Market size and forecast 2025-2030 ($ million)
Chart on Oil and gas - Year-over-year growth 2025-2030 (%)
Data Table on Oil and gas - Year-over-year growth 2025-2030 (%)

8.7 Others - Market size and forecast 2025-2030

Chart on Others - Market size and forecast 2025-2030 ($ million)
Data Table on Others - Market size and forecast 2025-2030 ($ million)
Chart on Others - Year-over-year growth 2025-2030 (%)
Data Table on Others - Year-over-year growth 2025-2030 (%)

8.8 Market opportunity by Application

Market opportunity by Application ($ million)
Data Table on Market opportunity by Application ($ million)

9. Market Segmentation by Component

9.1 Market segments

Chart on Component - Market share 2025-2030 (%)
Data Table on Component - Market share 2025-2030 (%)

9.2 Comparison by Component

Chart on Comparison by Component
Data Table on Comparison by Component

9.3 Hardware - Market size and forecast 2025-2030

Chart on Hardware - Market size and forecast 2025-2030 ($ million)
Data Table on Hardware - Market size and forecast 2025-2030 ($ million)
Chart on Hardware - Year-over-year growth 2025-2030 (%)
Data Table on Hardware - Year-over-year growth 2025-2030 (%)

9.4 Software - Market size and forecast 2025-2030

Chart on Software - Market size and forecast 2025-2030 ($ million)
Data Table on Software - Market size and forecast 2025-2030 ($ million)
Chart on Software - Year-over-year growth 2025-2030 (%)
Data Table on Software - Year-over-year growth 2025-2030 (%)

9.5 Market opportunity by Component

Market opportunity by Component ($ million)
Data Table on Market opportunity by Component ($ million)

10. Market Segmentation by Technology

10.1 Market segments

Chart on Technology - Market share 2025-2030 (%)
Data Table on Technology - Market share 2025-2030 (%)

10.2 Comparison by Technology

Chart on Comparison by Technology
Data Table on Comparison by Technology

10.3 Semi-automated - Market size and forecast 2025-2030

Chart on Semi-automated - Market size and forecast 2025-2030 ($ million)
Data Table on Semi-automated - Market size and forecast 2025-2030 ($ million)
Chart on Semi-automated - Year-over-year growth 2025-2030 (%)
Data Table on Semi-automated - Year-over-year growth 2025-2030 (%)

10.4 Fully-automated - Market size and forecast 2025-2030

Chart on Fully-automated - Market size and forecast 2025-2030 ($ million)
Data Table on Fully-automated - Market size and forecast 2025-2030 ($ million)
Chart on Fully-automated - Year-over-year growth 2025-2030 (%)
Data Table on Fully-automated - Year-over-year growth 2025-2030 (%)

10.5 Manual - Market size and forecast 2025-2030

Chart on Manual - Market size and forecast 2025-2030 ($ million)
Data Table on Manual - Market size and forecast 2025-2030 ($ million)
Chart on Manual - Year-over-year growth 2025-2030 (%)
Data Table on Manual - Year-over-year growth 2025-2030 (%)

10.6 Market opportunity by Technology

Market opportunity by Technology ($ million)
Data Table on Market opportunity by Technology ($ million)

11. Market Segmentation by Type

11.1 Market segments

Chart on Type - Market share 2025-2030 (%)
Data Table on Type - Market share 2025-2030 (%)

11.2 Comparison by Type

Chart on Comparison by Type
Data Table on Comparison by Type

11.3 Engine and powertrain benches - Market size and forecast 2025-2030

Chart on Engine and powertrain benches - Market size and forecast 2025-2030 ($ million)
Data Table on Engine and powertrain benches - Market size and forecast 2025-2030 ($ million)
Chart on Engine and powertrain benches - Year-over-year growth 2025-2030 (%)
Data Table on Engine and powertrain benches - Year-over-year growth 2025-2030 (%)

11.4 Battery and inverter benches - Market size and forecast 2025-2030

Chart on Battery and inverter benches - Market size and forecast 2025-2030 ($ million)
Data Table on Battery and inverter benches - Market size and forecast 2025-2030 ($ million)
Chart on Battery and inverter benches - Year-over-year growth 2025-2030 (%)
Data Table on Battery and inverter benches - Year-over-year growth 2025-2030 (%)

11.5 Force and torque benches - Market size and forecast 2025-2030

Chart on Force and torque benches - Market size and forecast 2025-2030 ($ million)
Data Table on Force and torque benches - Market size and forecast 2025-2030 ($ million)
Chart on Force and torque benches - Year-over-year growth 2025-2030 (%)
Data Table on Force and torque benches - Year-over-year growth 2025-2030 (%)

11.6 Valve and pressure pulse benches - Market size and forecast 2025-2030

Chart on Valve and pressure pulse benches - Market size and forecast 2025-2030 ($ million)
Data Table on Valve and pressure pulse benches - Market size and forecast 2025-2030 ($ million)
Chart on Valve and pressure pulse benches - Year-over-year growth 2025-2030 (%)
Data Table on Valve and pressure pulse benches - Year-over-year growth 2025-2030 (%)

11.7 Market opportunity by Type

Market opportunity by Type ($ million)
Data Table on Market opportunity by Type ($ million)

12. Customer Landscape

12.1 Customer landscape overview

Analysis of price sensitivity, lifecycle, customer purchase basket, adoption rates, and purchase criteria

13. Geographic Landscape

13.1 Geographic segmentation

Chart on Market share by geography 2025-2030 (%)
Data Table on Market share by geography 2025-2030 (%)

13.2 Geographic comparison

Chart on Geographic comparison
Data Table on Geographic comparison

13.3 APAC - Market size and forecast 2025-2030

Chart on APAC - Market size and forecast 2025-2030 ($ million)
Data Table on APAC - Market size and forecast 2025-2030 ($ million)
Chart on APAC - Year-over-year growth 2025-2030 (%)
Data Table on APAC - Year-over-year growth 2025-2030 (%)
Chart on Regional Comparison - APAC
Data Table on Regional Comparison - APAC

13.3.1 China - Market size and forecast 2025-2030

Chart on China - Market size and forecast 2025-2030 ($ million)
Data Table on China - Market size and forecast 2025-2030 ($ million)
Chart on China - Year-over-year growth 2025-2030 (%)
Data Table on China - Year-over-year growth 2025-2030 (%)

13.3.2 Japan - Market size and forecast 2025-2030

Chart on Japan - Market size and forecast 2025-2030 ($ million)
Data Table on Japan - Market size and forecast 2025-2030 ($ million)
Chart on Japan - Year-over-year growth 2025-2030 (%)
Data Table on Japan - Year-over-year growth 2025-2030 (%)

13.3.3 India - Market size and forecast 2025-2030

Chart on India - Market size and forecast 2025-2030 ($ million)
Data Table on India - Market size and forecast 2025-2030 ($ million)
Chart on India - Year-over-year growth 2025-2030 (%)
Data Table on India - Year-over-year growth 2025-2030 (%)

13.3.4 South Korea - Market size and forecast 2025-2030

Chart on South Korea - Market size and forecast 2025-2030 ($ million)
Data Table on South Korea - Market size and forecast 2025-2030 ($ million)
Chart on South Korea - Year-over-year growth 2025-2030 (%)
Data Table on South Korea - Year-over-year growth 2025-2030 (%)

13.3.5 Australia - Market size and forecast 2025-2030

Chart on Australia - Market size and forecast 2025-2030 ($ million)
Data Table on Australia - Market size and forecast 2025-2030 ($ million)
Chart on Australia - Year-over-year growth 2025-2030 (%)
Data Table on Australia - Year-over-year growth 2025-2030 (%)

13.3.6 Singapore - Market size and forecast 2025-2030

Chart on Singapore - Market size and forecast 2025-2030 ($ million)
Data Table on Singapore - Market size and forecast 2025-2030 ($ million)
Chart on Singapore - Year-over-year growth 2025-2030 (%)
Data Table on Singapore - Year-over-year growth 2025-2030 (%)

13.4 Europe - Market size and forecast 2025-2030

Chart on Europe - Market size and forecast 2025-2030 ($ million)
Data Table on Europe - Market size and forecast 2025-2030 ($ million)
Chart on Europe - Year-over-year growth 2025-2030 (%)
Data Table on Europe - Year-over-year growth 2025-2030 (%)
Chart on Regional Comparison - Europe
Data Table on Regional Comparison - Europe

13.4.1 Germany - Market size and forecast 2025-2030

Chart on Germany - Market size and forecast 2025-2030 ($ million)
Data Table on Germany - Market size and forecast 2025-2030 ($ million)
Chart on Germany - Year-over-year growth 2025-2030 (%)
Data Table on Germany - Year-over-year growth 2025-2030 (%)

13.4.2 France - Market size and forecast 2025-2030

Chart on France - Market size and forecast 2025-2030 ($ million)
Data Table on France - Market size and forecast 2025-2030 ($ million)
Chart on France - Year-over-year growth 2025-2030 (%)
Data Table on France - Year-over-year growth 2025-2030 (%)

13.4.3 UK - Market size and forecast 2025-2030

Chart on UK - Market size and forecast 2025-2030 ($ million)
Data Table on UK - Market size and forecast 2025-2030 ($ million)
Chart on UK - Year-over-year growth 2025-2030 (%)
Data Table on UK - Year-over-year growth 2025-2030 (%)

13.4.4 Italy - Market size and forecast 2025-2030

Chart on Italy - Market size and forecast 2025-2030 ($ million)
Data Table on Italy - Market size and forecast 2025-2030 ($ million)
Chart on Italy - Year-over-year growth 2025-2030 (%)
Data Table on Italy - Year-over-year growth 2025-2030 (%)

13.4.5 Spain - Market size and forecast 2025-2030

Chart on Spain - Market size and forecast 2025-2030 ($ million)
Data Table on Spain - Market size and forecast 2025-2030 ($ million)
Chart on Spain - Year-over-year growth 2025-2030 (%)
Data Table on Spain - Year-over-year growth 2025-2030 (%)

13.4.6 Sweden - Market size and forecast 2025-2030

Chart on Sweden - Market size and forecast 2025-2030 ($ million)
Data Table on Sweden - Market size and forecast 2025-2030 ($ million)
Chart on Sweden - Year-over-year growth 2025-2030 (%)
Data Table on Sweden - Year-over-year growth 2025-2030 (%)

13.5 North America - Market size and forecast 2025-2030

Chart on North America - Market size and forecast 2025-2030 ($ million)
Data Table on North America - Market size and forecast 2025-2030 ($ million)
Chart on North America - Year-over-year growth 2025-2030 (%)
Data Table on North America - Year-over-year growth 2025-2030 (%)
Chart on Regional Comparison - North America
Data Table on Regional Comparison - North America

13.5.1 US - Market size and forecast 2025-2030

Chart on US - Market size and forecast 2025-2030 ($ million)
Data Table on US - Market size and forecast 2025-2030 ($ million)
Chart on US - Year-over-year growth 2025-2030 (%)
Data Table on US - Year-over-year growth 2025-2030 (%)

13.5.2 Canada - Market size and forecast 2025-2030

Chart on Canada - Market size and forecast 2025-2030 ($ million)
Data Table on Canada - Market size and forecast 2025-2030 ($ million)
Chart on Canada - Year-over-year growth 2025-2030 (%)
Data Table on Canada - Year-over-year growth 2025-2030 (%)

13.5.3 Mexico - Market size and forecast 2025-2030

Chart on Mexico - Market size and forecast 2025-2030 ($ million)
Data Table on Mexico - Market size and forecast 2025-2030 ($ million)
Chart on Mexico - Year-over-year growth 2025-2030 (%)
Data Table on Mexico - Year-over-year growth 2025-2030 (%)

13.6 Middle East and Africa - Market size and forecast 2025-2030

Chart on Middle East and Africa - Market size and forecast 2025-2030 ($ million)
Data Table on Middle East and Africa - Market size and forecast 2025-2030 ($ million)
Chart on Middle East and Africa - Year-over-year growth 2025-2030 (%)
Data Table on Middle East and Africa - Year-over-year growth 2025-2030 (%)
Chart on Regional Comparison - Middle East and Africa
Data Table on Regional Comparison - Middle East and Africa

13.6.1 Saudi Arabia - Market size and forecast 2025-2030

Chart on Saudi Arabia - Market size and forecast 2025-2030 ($ million)
Data Table on Saudi Arabia - Market size and forecast 2025-2030 ($ million)
Chart on Saudi Arabia - Year-over-year growth 2025-2030 (%)
Data Table on Saudi Arabia - Year-over-year growth 2025-2030 (%)

13.6.2 UAE - Market size and forecast 2025-2030

Chart on UAE - Market size and forecast 2025-2030 ($ million)
Data Table on UAE - Market size and forecast 2025-2030 ($ million)
Chart on UAE - Year-over-year growth 2025-2030 (%)
Data Table on UAE - Year-over-year growth 2025-2030 (%)

13.6.3 South Africa - Market size and forecast 2025-2030

Chart on South Africa - Market size and forecast 2025-2030 ($ million)
Data Table on South Africa - Market size and forecast 2025-2030 ($ million)
Chart on South Africa - Year-over-year growth 2025-2030 (%)
Data Table on South Africa - Year-over-year growth 2025-2030 (%)

13.6.4 Turkey - Market size and forecast 2025-2030

Chart on Turkey - Market size and forecast 2025-2030 ($ million)
Data Table on Turkey - Market size and forecast 2025-2030 ($ million)
Chart on Turkey - Year-over-year growth 2025-2030 (%)
Data Table on Turkey - Year-over-year growth 2025-2030 (%)

13.6.5 Qatar - Market size and forecast 2025-2030

Chart on Qatar - Market size and forecast 2025-2030 ($ million)
Data Table on Qatar - Market size and forecast 2025-2030 ($ million)
Chart on Qatar - Year-over-year growth 2025-2030 (%)
Data Table on Qatar - Year-over-year growth 2025-2030 (%)

13.7 South America - Market size and forecast 2025-2030

Chart on South America - Market size and forecast 2025-2030 ($ million)
Data Table on South America - Market size and forecast 2025-2030 ($ million)
Chart on South America - Year-over-year growth 2025-2030 (%)
Data Table on South America - Year-over-year growth 2025-2030 (%)
Chart on Regional Comparison - South America
Data Table on Regional Comparison - South America

13.7.1 Brazil - Market size and forecast 2025-2030

Chart on Brazil - Market size and forecast 2025-2030 ($ million)
Data Table on Brazil - Market size and forecast 2025-2030 ($ million)
Chart on Brazil - Year-over-year growth 2025-2030 (%)
Data Table on Brazil - Year-over-year growth 2025-2030 (%)

13.7.2 Argentina - Market size and forecast 2025-2030

Chart on Argentina - Market size and forecast 2025-2030 ($ million)
Data Table on Argentina - Market size and forecast 2025-2030 ($ million)
Chart on Argentina - Year-over-year growth 2025-2030 (%)
Data Table on Argentina - Year-over-year growth 2025-2030 (%)

13.7.3 Chile - Market size and forecast 2025-2030

Chart on Chile - Market size and forecast 2025-2030 ($ million)
Data Table on Chile - Market size and forecast 2025-2030 ($ million)
Chart on Chile - Year-over-year growth 2025-2030 (%)
Data Table on Chile - Year-over-year growth 2025-2030 (%)

13.8 Market opportunity by geography

Market opportunity by geography ($ million)
Data Tables on Market opportunity by geography ($ million)

14. Drivers, Challenges, and Opportunity

14.1 Market drivers

Increasing complexity in automotive and aerospace engineering
Accelerated adoption of industry 4.0 and smart automation
Rising regulatory standards and demand for quality assurance

14.2 Market challenges

High initial capital expenditure and technical implementation costs
Increasing complexity in integration and interoperability standards
Shortage of skilled technical personnel for advanced system operation

14.3 Impact of drivers and challenges

Impact of drivers and challenges in 2025 and 2030

14.4 Market opportunities

Integration of AI and predictive analytics in testing environments
Rise of digital twin simulation and virtualized testing architectures
Standardization of high-voltage and electrification testing protocols

15. Competitive Landscape

15.1 Overview

15.2

Overview on criticality of inputs and factors of differentiation

15.3 Landscape disruption

Overview on factors of disruption

15.4 Industry risks

Impact of key risks on business

16. Competitive Analysis

16.1 Companies profiled

Companies covered

16.2 Company ranking index

16.3 Market positioning of companies

Matrix on companies position and classification

16.4 AMETEK CTS

AMETEK CTS - Overview
AMETEK CTS - Product / Service
AMETEK CTS - Key offerings
SWOT

16.5 Applus IDIADA

Applus IDIADA - Overview
Applus IDIADA - Product / Service
Applus IDIADA - Key offerings
SWOT

16.6 Ascential Technologies

Ascential Technologies - Overview
Ascential Technologies - Product / Service
Ascential Technologies - Key offerings
SWOT

16.7 ATESTEO GmbH and Co. KG

ATESTEO GmbH and Co. KG - Overview
ATESTEO GmbH and Co. KG - Product / Service
ATESTEO GmbH and Co. KG - Key offerings
SWOT

16.8 AVL List GmbH

AVL List GmbH - Overview
AVL List GmbH - Product / Service
AVL List GmbH - Key offerings
SWOT

16.9 Blum-Novotest GmbH

Blum-Novotest GmbH - Overview
Blum-Novotest GmbH - Product / Service
Blum-Novotest GmbH - Key offerings
SWOT

16.10 FEV Group GmbH

FEV Group GmbH - Overview
FEV Group GmbH - Product / Service
FEV Group GmbH - Key offerings
SWOT

16.11 HORIBA Ltd.

HORIBA Ltd. - Overview
HORIBA Ltd. - Business segments
HORIBA Ltd. - Key offerings
HORIBA Ltd. - Segment focus
SWOT

16.12 MAHA Maschinenbau Haldenwang

MAHA Maschinenbau Haldenwang - Overview
MAHA Maschinenbau Haldenwang - Product / Service
MAHA Maschinenbau Haldenwang - Key offerings
SWOT

16.13 Meidensha Corp.

Meidensha Corp. - Overview
Meidensha Corp. - Business segments
Meidensha Corp. - Key offerings
Meidensha Corp. - Segment focus
SWOT

16.14 MTS Systems

MTS Systems - Overview
MTS Systems - Product / Service
MTS Systems - Key offerings
SWOT

16.15 Schenck RoTec GmbH

Schenck RoTec GmbH - Overview
Schenck RoTec GmbH - Product / Service
Schenck RoTec GmbH - Key offerings
SWOT

16.16 Sierra CP Engineering Inc.

Sierra CP Engineering Inc. - Overview
Sierra CP Engineering Inc. - Product / Service
Sierra CP Engineering Inc. - Key offerings
SWOT

16.17 thyssenkrupp AG

thyssenkrupp AG - Overview
thyssenkrupp AG - Business segments
thyssenkrupp AG - Key offerings
thyssenkrupp AG - Segment focus
SWOT

16.18 Weiss Umwelttechnik GmbH.

Weiss Umwelttechnik GmbH. - Overview
Weiss Umwelttechnik GmbH. - Product / Service
Weiss Umwelttechnik GmbH. - Key offerings
SWOT

17. Appendix

17.1 Scope of the report

Market definition
Objectives
Notes and caveats

17.2 Inclusions and exclusions checklist

Inclusions checklist
Exclusions checklist

17.3 Currency conversion rates for US$

17.4 Research methodology

17.5 Data procurement

Information sources

17.6 Data validation

17.7 Validation techniques employed for market sizing

17.8 Data synthesis

17.9 360 degree market analysis

17.10 List of abbreviations

Research Methodology

Technavio presents a detailed picture of the market by way of study, synthesis, and summation of data from multiple sources. The analysts have presented the various facets of the market with a particular focus on identifying the key industry influencers. The data thus presented is comprehensive, reliable, and the result of extensive research, both primary and secondary.

INFORMATION SOURCES

Primary sources

  • Manufacturers and suppliers
  • Channel partners
  • Industry experts
  • Strategic decision makers

Secondary sources

  • Industry journals and periodicals
  • Government data
  • Financial reports of key industry players
  • Historical data
  • Press releases

DATA ANALYSIS

Data Synthesis

  • Collation of data
  • Estimation of key figures
  • Analysis of derived insights

Data Validation

  • Triangulation with data models
  • Reference against proprietary databases
  • Corroboration with industry experts

REPORT WRITING

Qualitative

  • Market drivers
  • Market challenges
  • Market trends
  • Five forces analysis

Quantitative

  • Market size and forecast
  • Market segmentation
  • Geographical insights
  • Competitive landscape

Interested in this report?

Get your sample now to see our research methodology and insights!

Download Now

Frequently Asked Questions

Test Bench market growth will increase by USD 358.4 million during 2026-2030.

The Test Bench market is expected to grow at a CAGR of 4.4% during 2026-2030.

Test Bench market is segmented by Application (Automotive and transportation, Semiconductor and electronics, Industrial manufacturing and engineering, Oil and gas, Others) Component (Hardware, Software) Technology (Semi-automated, Fully-automated, Manual) Type (Engine and powertrain benches, Battery and inverter benches, Force and torque benches, Valve and pressure pulse benches)

AMETEK CTS, Applus IDIADA, Ascential Technologies, ATESTEO GmbH and Co. KG, AVL List GmbH, Blum-Novotest GmbH, Dyno One Inc., FEV Group GmbH, HORIBA Ltd., Italcontrol Srl, KST Motorenversuch GmbH, MAHA Maschinenbau Haldenwang, Meidensha Corp., MTS Systems, Power Test LLC, Schenck RoTec GmbH, Sierra CP Engineering Inc., SuperFlow, thyssenkrupp AG, Weiss Umwelttechnik GmbH. are a few of the key vendors in the Test Bench market.

APAC will register the highest growth rate of 46% among the other regions. Therefore, the Test Bench market in APAC is expected to garner significant business opportunities for the vendors during the forecast period.

China, Japan, India, South Korea, Australia, Singapore, Germany, France, UK, Italy, Spain, Sweden, US, Canada, Mexico, Saudi Arabia, UAE, South Africa, Turkey, Qatar, Brazil, Argentina, Chile

  • Increasing complexity in automotive and aerospace engineering is the driving factor this market.

The Test Bench market vendors should focus on grabbing business opportunities from the Application segment as it accounted for the largest market share in the base year.
RIA - Research AI Assistant
Ask RIA
