
Europe Third-Party Logistics Market Size 2025-2029
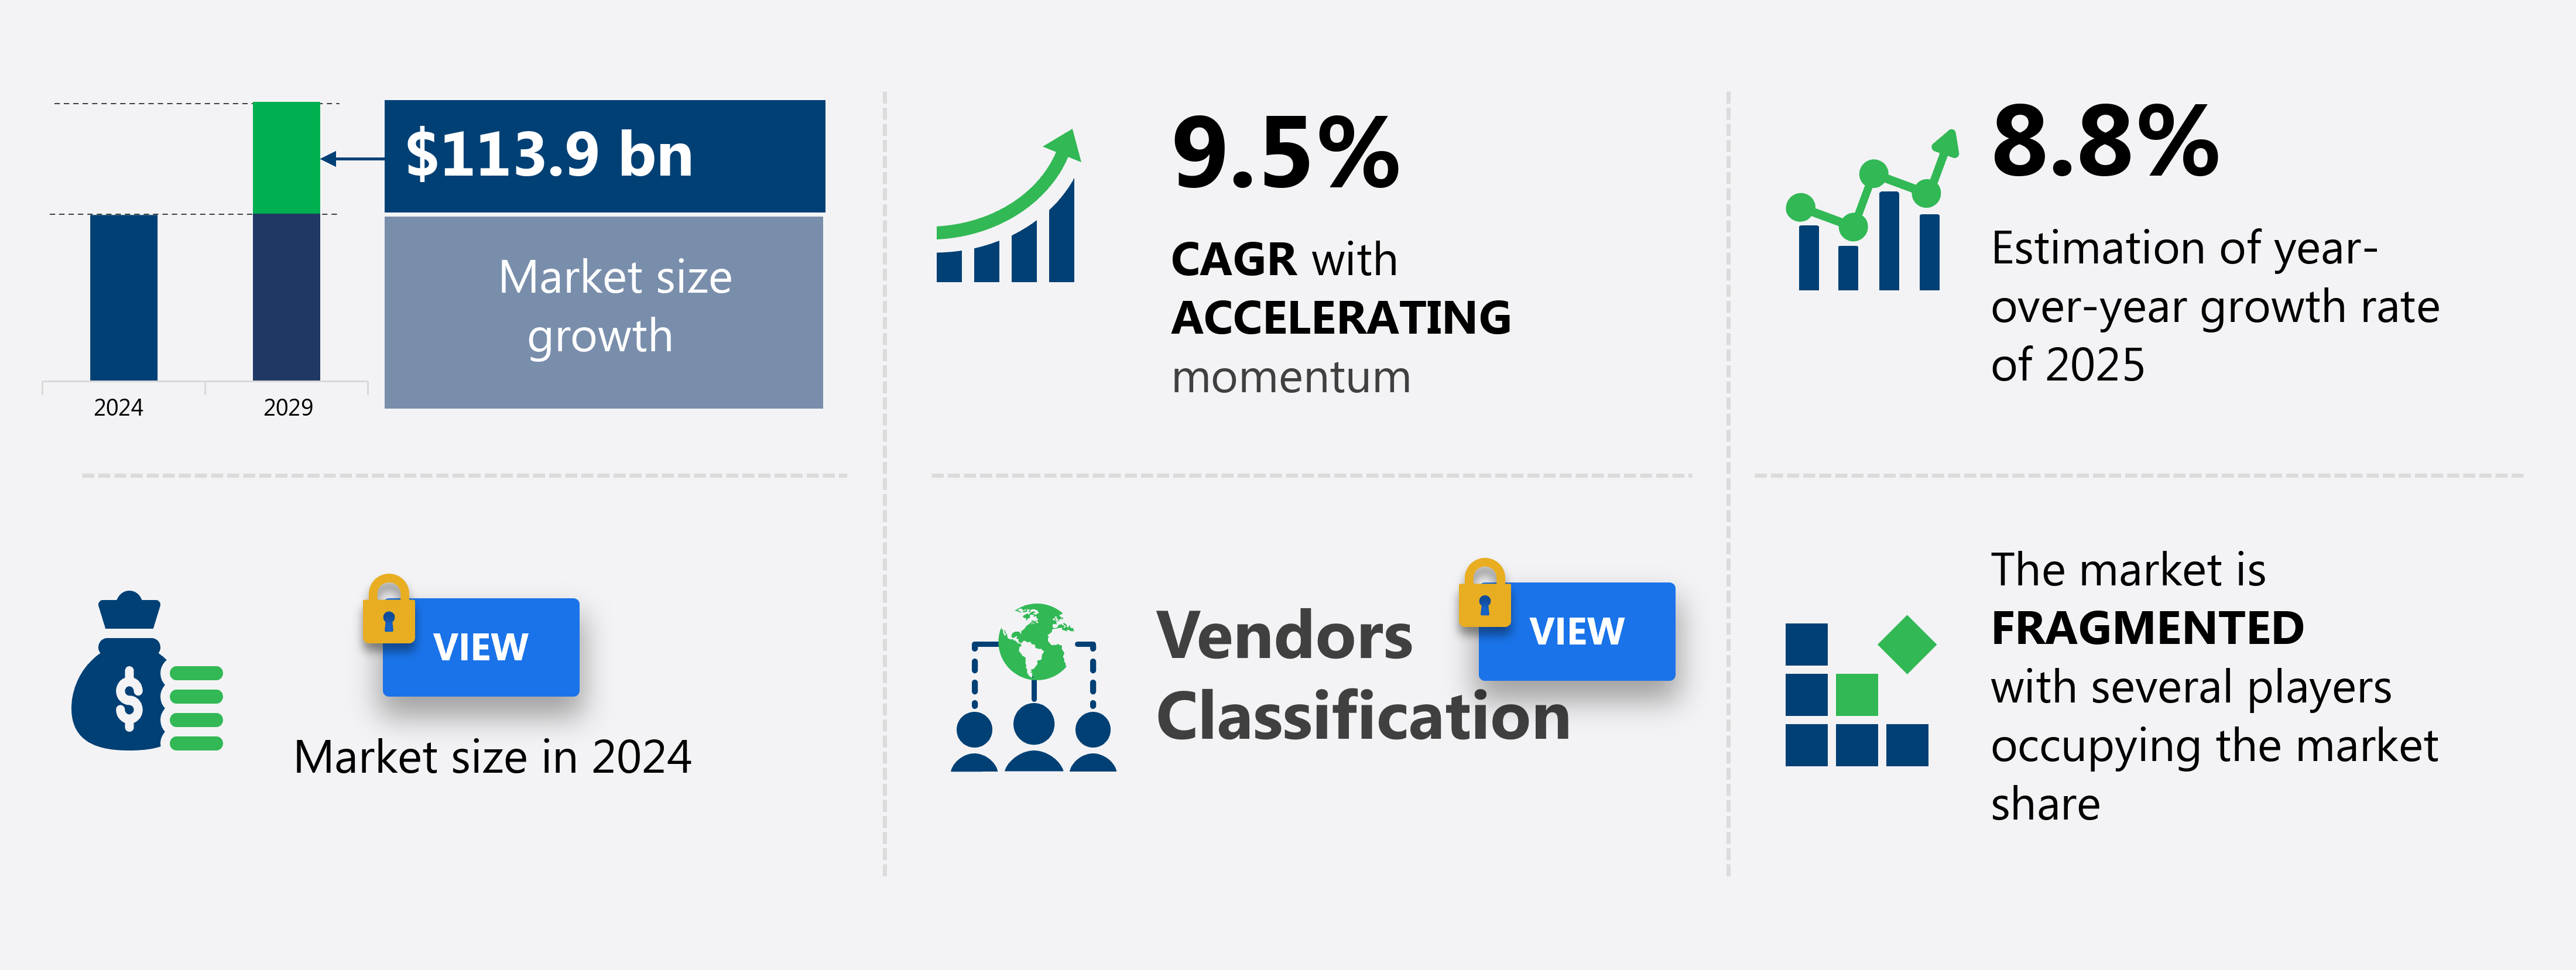
The Europe third-party logistics market size is forecast to increase by USD 113.9 billion at a CAGR of 9.5% between 2024 and 2029.
- The European third-party logistics market is characterized by the growing complexity of in-house logistics operations, presenting an opportunity for outsourcing to third-party providers. Businesses are increasingly recognizing the benefits of specialized expertise and cost savings, leading to a significant market growth. However, the emergence of big data in logistics poses a challenge, as companies must invest in advanced analytics tools and processes to gain a competitive edge. Moreover, the limited use of Information Technology (IT) and regulatory barriers hinder market expansion.
- Adopting IT solutions can streamline operations, improve efficiency, and enhance customer service. Compliance with evolving regulations, particularly those related to data protection and sustainability, is essential for market success. Companies seeking to capitalize on this market must navigate these challenges by investing in IT and regulatory compliance, leveraging data analytics, and providing value-added services to customers.
What will be the size of the Europe Third-Party Logistics Market during the forecast period?
Explore in-depth regional segment analysis with market size data - historical 2019-2023 and forecasts 2025-2029 - in the full report.
Request Free Sample
- The European third-party logistics market continues to evolve, with ongoing activities shaping the industry landscape. Transportation cost analysis and lead time optimization remain key focus areas for companies, aiming to reduce freight costs and enhance supply chain agility. Predictive logistics modeling and advanced analytics are increasingly adopted to optimize returns processing and improve distribution efficiency. Temperature-controlled logistics and sustainable practices gain importance, with a growing number of businesses seeking to boost on-time delivery rates and e-commerce fulfillment efficiency. The market anticipates a 5% annual growth rate, driven by the implementation of integrated logistics technology, omnichannel distribution strategies, and value-added services.
- For instance, a leading retailer reported a 15% increase in order accuracy by implementing data-driven logistics solutions. Additionally, the market prioritizes reverse logistics efficiency, focusing on warehouse labor productivity, inventory turnover ratios, and customs brokerage services to ensure global trade compliance. Hazardous materials handling, supply chain traceability, and logistics network efficiency are other critical aspects, with companies adopting advanced technologies to streamline operations and boost supply chain resilience. Cargo insurance solutions and sustainability practices further enhance the market's adaptability and competitiveness.
How is this Europe Third-Party Logistics Market segmented?
The market research report provides comprehensive data (region-wise segment analysis), with forecasts and estimates in "USD billion" for the period 2025-2029, as well as historical data from 2019-2023 for the following segments.
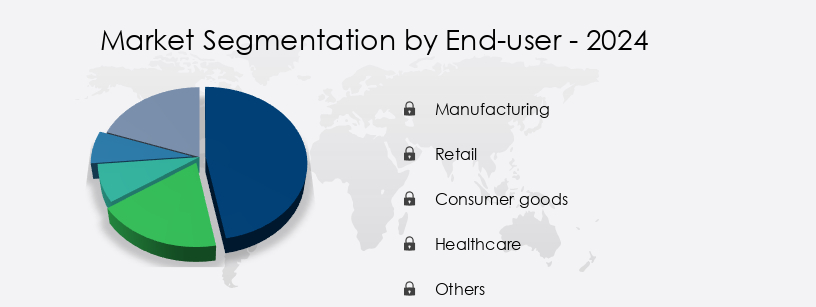
- End-user
- Manufacturing
- Retail
- Consumer goods
- Healthcare
- Others
- Service
- Transportation
- Warehousing and distribution
- Others
- Mode Of Transportation
- Roadways
- Seaways
- Railways
- Airways
- Multimodal transport
- Geography
- Europe
- France
- Germany
- Italy
- UK
- Europe
By End-user Insights
The manufacturing segment is estimated to witness significant growth during the forecast period.
The European third-party logistics market is experiencing significant growth and transformation, driven by the European Commission's goal to increase the manufacturing industry's contribution to the EU economy from 15% to 20% by 2030. This objective arises from the declining manufacturing industry share, which can be attributed to the rising production of goods in low-cost regions and decreasing demand for European-made products due to economic stagnation. Integrated logistics platforms, warehouse management systems, and supply chain optimization are essential components of this market, enabling businesses to streamline operations and reduce costs. Warehouse automation technology, such as dock scheduling software and real-time tracking data, enhances efficiency and improves customer satisfaction.
Cross-border logistics and e-commerce logistics solutions are gaining popularity, with transportation mode selection and freight forwarding services playing crucial roles in managing complex supply chains. Inventory optimization techniques and demand forecasting models help businesses minimize stock holding costs and improve order fulfillment processes. The logistics network design and transportation route planning are essential for cost optimization strategies, while carrier selection processes and freight rate negotiation ensure competitiveness. Reverse logistics operations, including returns management processes and packaging optimization strategies, are becoming increasingly important for customer satisfaction and sustainability. According to recent industry reports, the European third-party logistics market is expected to grow by over 5% annually, driven by the increasing demand for flexible and efficient logistics solutions.
For instance, a leading retailer reported a 25% increase in on-time deliveries after implementing a transportation management system.
Market Dynamics
Our researchers analyzed the data with 2024 as the base year, along with the key drivers, trends, and challenges. A holistic analysis of drivers will help companies refine their marketing strategies to gain a competitive advantage.
- The European third-party logistics (3PL) market is experiencing significant growth, driven by the increasing demand for supply chain efficiency, visibility, and flexibility. Warehouse automation is a key trend in the market, with companies investing in technology to improve efficiency and reduce errors in their order fulfillment processes. Real-time tracking and transportation route planning are also essential elements of modern 3PL operations, enabling businesses to optimize last-mile delivery and reduce fuel consumption. Contract logistics agreements play a crucial role in defining responsibilities between 3PL providers and their clients. These agreements ensure that distribution center operations run smoothly, enhancing productivity and reducing inventory waste through effective inventory control strategies.
- The Europe third-party logistics market thrives on advanced technologies and strategies. warehouse automation improving efficiency and warehouse space optimization maximizing capacity streamline operations, while supply chain visibility enhancing performance ensures transparency. real-time tracking improving delivery times and last-mile delivery optimizing costs boost efficiency. transportation route planning fuel consumption reduction and transportation mode selection reducing transit times lower costs. order fulfillment processes reducing errors and inventory control strategies minimizing waste enhance accuracy. contract logistics agreements defining responsibilities and logistics service level agreements ensuring quality maintain standards. distribution center operations enhancing productivity and dock scheduling software minimizing delays improve throughput. packaging optimization strategies reducing costs, returns management processes improving customer satisfaction, and inventory optimization techniques reducing storage costs drive value. delivery performance metrics evaluating service quality, customer satisfaction metrics identifying improvement areas, cost optimization strategies increasing profitability, and supply chain risk management mitigating disruptions ensure resilience.
What are the Europe Third-Party Logistics Market market drivers leading to the rise in adoption of the Industry?
- The increasing intricacy of in-house logistics operations serves as the primary catalyst for market expansion.
- The European third-party logistics (3PL) market is experiencing significant growth due to the increasing complexities and demands of supply chain management (SCM) for manufacturing organizations. Challenges such as fleet management difficulties, a shortage of skilled drivers, and a lack of IT infrastructure like tracking management systems are pushing shippers to outsource their logistics responsibilities to 3PL providers. This trend is particularly prevalent as manufacturing firms expand their production capabilities and operations, leading to increased logistical needs. According to industry reports, the European 3PL market is projected to grow by over 5% annually, reflecting the increasing demand for outsourced logistics solutions.
- For instance, a leading manufacturing company in Europe reported a 15% increase in sales after outsourcing its logistics operations to a 3PL provider, highlighting the potential benefits of this business model.
What are the Europe Third-Party Logistics Market market trends shaping the Industry?
- The emergence of big data represents a significant market trend. This trend signifies a shift towards the utilization of large and complex data sets for business analysis and decision-making.
- The European third-party logistics market is witnessing significant growth as companies increasingly adopt big data analytics to gain a competitive edge. Big data integration offers numerous benefits, including access to valuable market information, customized services, and innovative business models based on agility. However, the logistics industry in Europe faces considerable IT infrastructure gaps, limiting the full potential of big data applications. In the logistics sector, big data plays a pivotal role in improving operational efficiency, enhancing customer experience, and enabling new business models. By streamlining core activities, logistics companies can optimize delivery times, resource utilization, and geographical coverage.
- Advanced predictive techniques and real-time processing capabilities promise to revolutionize capacity forecasting and resource control. Despite these benefits, the European third-party logistics market is still in its nascent stages, with significant room for growth. According to recent studies, the market is expected to grow by 15% in the next two years, as more companies recognize the value of big data in logistics operations.
How does Europe Third-Party Logistics Market market faces challenges face during its growth?
- The restriction of IT usage and regulatory hurdles pose significant challenges to the expansion of the industry.
- The European third-party logistics (3PL) market is a significant segment of the supply chain management (SCM) process. IT plays a pivotal role in the provider-shipper relationship, serving as the foundation for seamless communication and efficient operations. However, the incompatibility between IT systems of shippers and 3PL providers can lead to communication gaps and time lags, resulting in reduced customer satisfaction and potential delays in services. Moreover, increasing government regulations in major European countries like Germany, France, the UK, Spain, and Italy have imposed operational costs on the commercial logistics industry, thereby restricting market growth.
- For instance, a study revealed that the implementation of new regulations in Germany led to a 15% increase in operational costs for logistics providers. Despite these challenges, the European 3PL market is projected to grow by over 10% in the next five years, driven by the increasing demand for cost-effective and flexible logistics solutions.
Exclusive Europe Third-Party Logistics Market Customer Landscape
The market forecasting report includes the adoption lifecycle of the market, covering from the innovator's stage to the laggard's stage. It focuses on adoption rates in different regions based on penetration. Furthermore, the report also includes key purchase criteria and drivers of price sensitivity to help companies evaluate and develop their market growth analysis strategies.
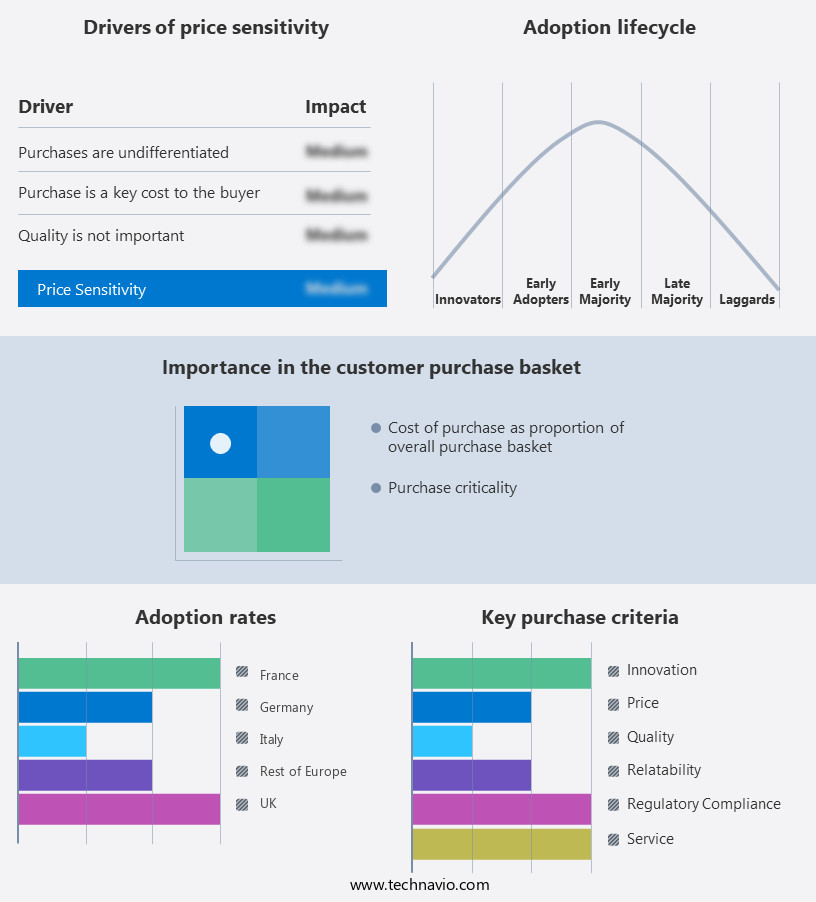
Customer Landscape
Key Companies & Market Insights
Companies are implementing various strategies, such as strategic alliances, market forecast partnerships, mergers and acquisitions, geographical expansion, and product/service launches, to enhance their presence in the market.
The market research and growth report includes detailed analyses of the competitive landscape of the market and information about key companies, including:
- AP Moller Maersk AS
- Baltic Logistic Solutions
- C H Robinson Worldwide Inc.
- CEVA Logistics SA
- DB Schenker
- DHL International GmbH
- DSV AS
- Expeditors International of Washington Inc.
- FedEx Corp.
- FM Logistic
- GEODIS
- H. P. Therkelsen AS
- Hansa Express Logistics GmbH
- Huktra UK Ltd.
- Imperial Logistics Ltd.
- Ital Logistics Ltd.
- Jordon Freight Ltd.
- Kintetsu World Express Inc.
- NTG Nordic Transport Group AS
- United Parcel Service Inc.
- XPO Inc.
Qualitative and quantitative analysis of companies has been conducted to help clients understand the wider business environment as well as the strengths and weaknesses of key market players. Data is qualitatively analyzed to categorize companies as pure play, category-focused, industry-focused, and diversified; it is quantitatively analyzed to categorize companies as dominant, leading, strong, tentative, and weak.
Recent Development and News in Third-Party Logistics Market In Europe
- In January 2024, DB Schenker, a leading global logistics provider, announced the launch of its new digital platform, "Connect 4.0," in Europe. This platform aims to enhance supply chain transparency and efficiency by integrating various logistics services and offering real-time tracking and monitoring (DB Schenker press release).
- In March 2024, DHL Supply Chain and Magna International, a global automotive supplier, signed a strategic partnership agreement to expand their collaboration in Europe. This partnership focuses on enhancing Magna's logistics capabilities and optimizing its supply chain (DHL press release).
- In May 2024, Kuehne + Nagel, a global logistics company, completed the acquisition of the Dutch logistics provider, Apex Logistics. This acquisition strengthened Kuehne + Nagel's position in the European market and expanded its contract logistics services (Kuehne + Nagel press release).
- In February 2025, the European Union approved the European Multimodal Transport Hubs Initiative, which aims to develop and upgrade transport infrastructure and promote sustainable logistics solutions in Europe. This initiative is expected to create new opportunities for third-party logistics providers in the region (European Commission press release).
Research Analyst Overview
The European third-party logistics (3PL) market continues to evolve, driven by the increasing complexity of supply chains and the demand for more efficient and cost-effective solutions. Companies across various sectors, from manufacturing to retail, rely on 3PL providers to optimize their logistics operations through the implementation of advanced technologies and integrated platforms. For instance, the adoption of dock scheduling software has streamlined the loading and unloading process at distribution centers, reducing wait times and increasing productivity. Moreover, transportation mode selection and optimization have become crucial elements of logistics network design, enabling businesses to choose the most cost-effective and efficient transportation methods for their goods.
Furthermore, the integration of warehouse management systems, warehouse automation technology, and real-time tracking data has revolutionized distribution center operations, allowing for inventory optimization techniques and order fulfillment processes to be carried out more efficiently. Cross-border logistics has also gained significant traction, with freight forwarding services and transportation route planning playing a vital role in managing the complexities of international shipments. The European 3PL market is expected to grow at a robust rate, with industry experts forecasting a growth of over 5% annually. The focus on cost optimization strategies, such as carrier selection process, freight rate negotiation, and transportation management systems, is a key driver of this growth.
Additionally, the increasing popularity of e-commerce logistics solutions and last-mile delivery solutions is creating new opportunities for 3PL providers to add value to their clients' businesses. An example of this can be seen in a leading retailer, who partnered with a 3PL provider to implement a demand forecasting model and an order tracking system, resulting in a 20% increase in on-time deliveries and a 15% reduction in inventory holding costs. By leveraging advanced technologies and supply chain visibility, 3PL providers are helping businesses to improve their customer satisfaction metrics and remain competitive in an ever-changing market.
Dive into Technavio's robust research methodology, blending expert interviews, extensive data synthesis, and validated models for unparalleled Third-Party Logistics Market in Europe insights. See full methodology.
|
Market Scope |
|
|
Report Coverage |
Details |
|
Page number |
211 |
|
Base year |
2024 |
|
Historic period |
2019-2023 |
|
Forecast period |
2025-2029 |
|
Growth momentum & CAGR |
Accelerate at a CAGR of 9.5% |
|
Market growth 2025-2029 |
USD 113.9 billion |
|
Market structure |
Fragmented |
|
YoY growth 2024-2025(%) |
8.8 |
|
Competitive landscape |
Leading Companies, Market Positioning of Companies, Competitive Strategies, and Industry Risks |
What are the Key Data Covered in this Market Research Report?
- CAGR of the market during the forecast period
- Detailed information on factors that will drive the market growth and forecasting between 2025 and 2029
- Precise estimation of the size of the market and its contribution of the market in focus to the parent market
- Accurate predictions about upcoming market growth and trends and changes in consumer behaviour
- Growth of the market across Europe
- Thorough analysis of the market's competitive landscape and detailed information about companies
- Comprehensive analysis of factors that will challenge the growth of market companies
We can help! Our analysts can customize this market research report to meet your requirements Get in touch
 RIA -
RIA - 
