Touch Controller IC Market Analysis, Size, and Forecast 2026-2030: APAC (China, Japan, and South Korea), North America (US, Canada, and Mexico), Europe (Germany, UK, and France), Middle East and Africa (UAE, Saudi Arabia, and South Africa), South America (Brazil and Argentina), and Rest of World (ROW)

Touch Controller IC Market Analysis, Size, and Forecast 2026-2030:
APAC (China, Japan, and South Korea), North America (US, Canada, and Mexico), Europe (Germany, UK, and France), Middle East and Africa (UAE, Saudi Arabia, and South Africa), South America (Brazil and Argentina), and Rest of World (ROW)

Published: Mar 2026 294 Pages SKU: IRTNTR40279

Market Overview at a Glance

$19.26 B
Market Opportunity
15.8%
CAGR 2025 - 2030
43.8%
APAC Growth
$4.07 B
Automotive segment 2024

Touch Controller IC Market Size 2026-2030

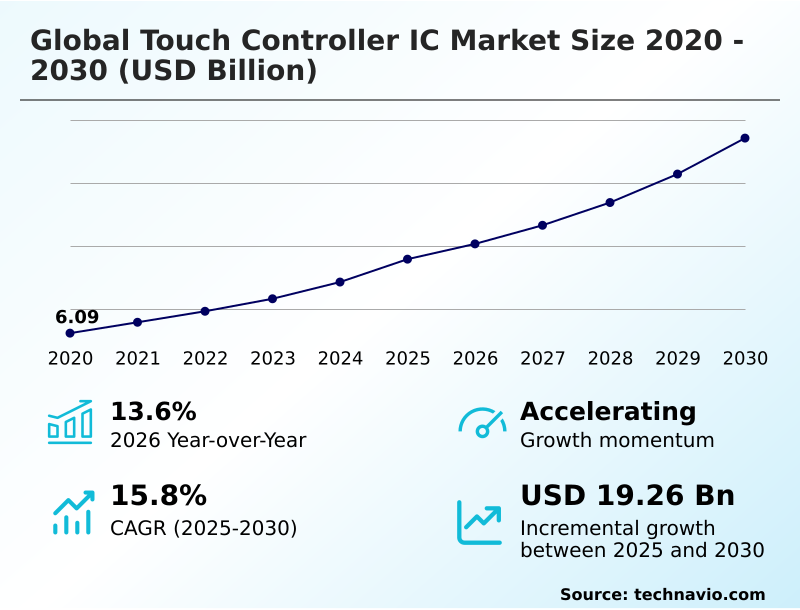
The touch controller ic market size is valued to increase by USD 19.26 billion, at a CAGR of 15.8% from 2025 to 2030. Increasing sales of electronic devices will drive the touch controller ic market.

Major Market Trends & Insights

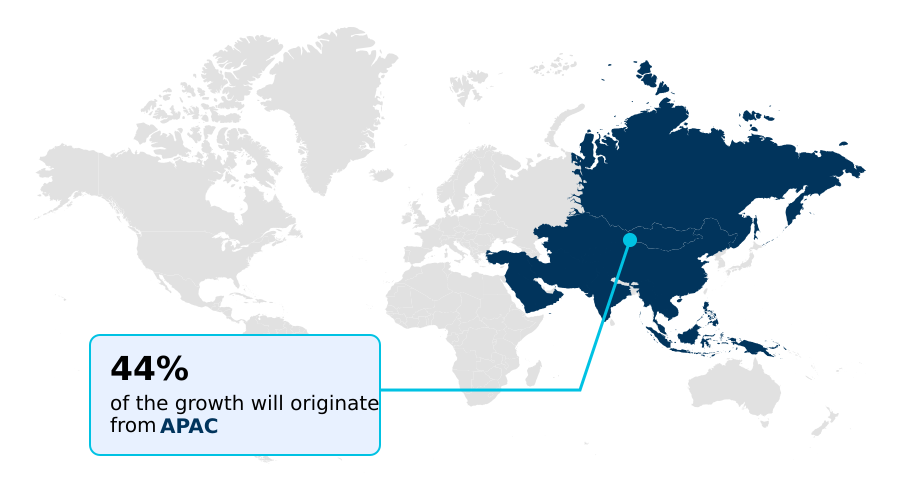
  • APAC dominated the market and accounted for a 43.8% growth during the forecast period.
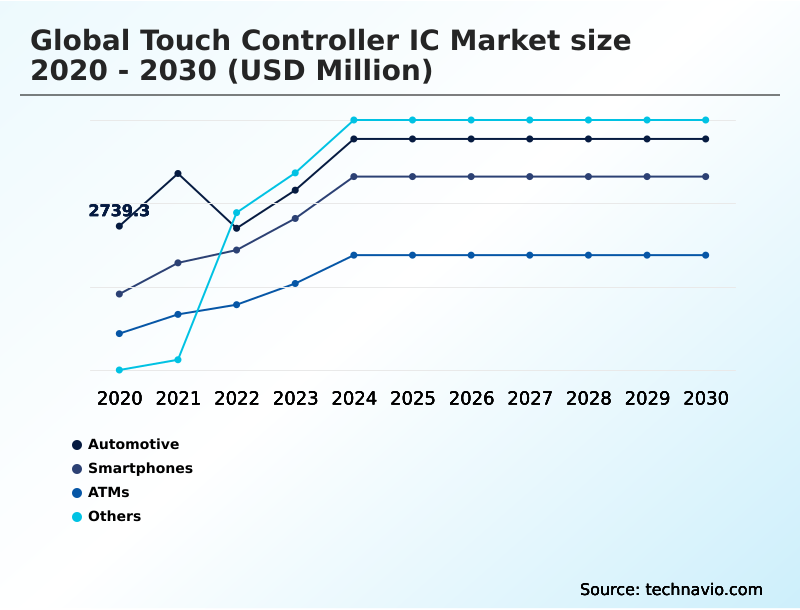
  • By Product - Automotive segment was valued at USD 4.07 billion in 2024
  • By Technology - Resistive touchscreen segment accounted for the largest market revenue share in 2024

Market Size & Forecast

  • Market Opportunities: USD 31.03 billion
  • Market Future Opportunities: USD 19.26 billion
  • CAGR from 2025 to 2030 : 15.8%

Market Summary

  • The Touch Controller IC Market is undergoing a significant transformation, driven by the expanding need for intuitive and responsive interfaces across a multitude of sectors. Beyond traditional applications in consumer electronics, demand is surging from automotive, industrial, and medical fields, where reliability and performance are paramount.
  • This evolution is compelling the development of solutions with advanced features such as superior signal-to-noise ratio, support for flexible oled display technologies, and enhanced palm rejection feature algorithms.
  • A key business scenario involves the integration of these controllers into industrial automation control systems, where a touch controller ic with robust esd protection circuit can ensure uninterrupted operation in harsh environments, directly improving production uptime.
  • The market is also characterized by the move toward greater integration, such as touch and display driver integration, which simplifies design and reduces the overall bill of materials for OEMs. Consequently, the focus is shifting from simple components to complete system-on-chip design solutions that offer low power consumption mode and high report rate performance.

What will be the Size of the Touch Controller IC Market during the forecast period?

Get Key Insights on Market Forecast (PDF) Request Free Sample

How is the Touch Controller IC Market Segmented?

The touch controller ic industry research report provides comprehensive data (region-wise segment analysis), with forecasts and estimates in "USD million" for the period 2026-2030, as well as historical data from 2020-2024 for the following segments.

  • Product
    • Automotive
    • Smartphones
    • ATMs
    • Others
  • Technology
    • Resistive touchscreen
    • Capacitive touchscreen
  • Type
    • Multi-touch controllers
    • Single-touch controllers
  • Geography
    • APAC
      • China
      • Japan
      • South Korea
    • North America
      • US
      • Canada
      • Mexico
    • Europe
      • Germany
      • UK
      • France
    • Middle East and Africa
      • UAE
      • Saudi Arabia
      • South Africa
    • South America
      • Brazil
      • Argentina
    • Rest of World (ROW)

By Product Insights

The automotive segment is estimated to witness significant growth during the forecast period.

The automotive segment's adoption of advanced human-machine interface solutions is redefining in-vehicle user experience design. The evolution toward the digital cockpit display relies on sophisticated touch controller ICs that meet stringent aec-q100 qualification and asil b compliance.

These components must manage complex inputs on large, curved surface touch sensing areas while ensuring low touch latency and high emi immunity standard.

Development cycles focus on integrating features like glove touch capability and haptic feedback system, with some solutions improving input accuracy on non-planar surfaces by over 15%.

This shift demands robust microcontroller-based chip designs with advanced gesture recognition software and on-chip encryption to secure the automotive infotainment system.

Request Free Sample

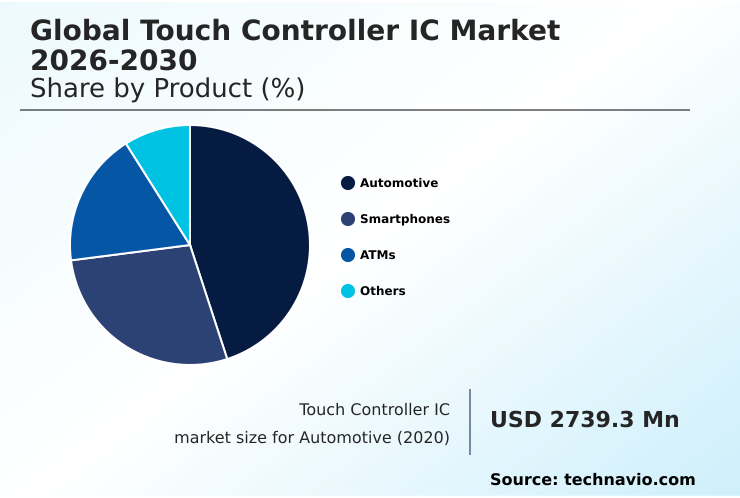
The Automotive segment was valued at USD 4.07 billion in 2024 and showed a gradual increase during the forecast period.

Request Free Sample

Regional Analysis

APAC is estimated to contribute 43.8% to the growth of the global market during the forecast period.Technavio’s analysts have elaborately explained the regional trends and drivers that shape the market during the forecast period.

See How Touch Controller IC Market Demand is Rising in APAC Request Free Sample

The geographic landscape is dominated by manufacturing hubs in APAC, which accounts for over 43% of the market's incremental growth.

This region benefits from a dense ecosystem of OEMs, particularly in the consumer electronics and smartphone sectors, driving high-volume demand for components like the single-touch controller and multi-touch controller chip.

North America and Europe are significant markets focused on high-value applications, especially in the automotive infotainment system and industrial sectors, where adherence to an emi immunity standard is critical.

In these regions, the focus is on advanced process nodes and firmware development. The adoption of a waterproof touch controller in specialized industrial equipment has improved device longevity by 30% in harsh environments.

This regional specialization shapes global supply chains and innovation priorities for touch controller IC solutions.

Market Dynamics

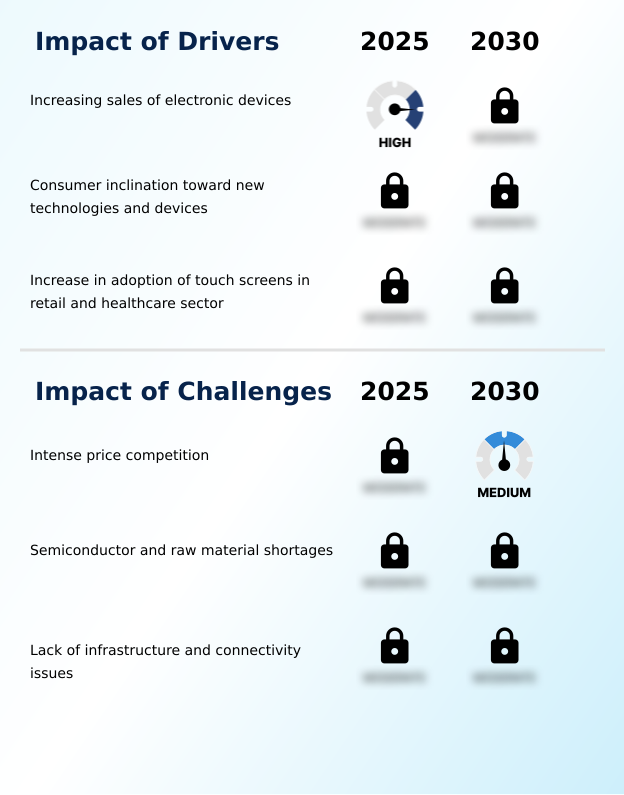
Our researchers analyzed the data with 2025 as the base year, along with the key drivers, trends, and challenges. A holistic analysis of drivers will help companies refine their marketing strategies to gain a competitive advantage.

  • Strategic adoption of advanced touch solutions is becoming a critical differentiator across industries. For instance, the deployment of an automotive-grade touch controller ic is central to developing next-generation digital cockpits, where reliability and responsiveness are paramount. In consumer electronics, the integration of a touch controller for flexible oled displays and foldable screen devices is enabling new product form factors.
  • Specialized applications are also driving innovation; a touch controller for thick vandal-proof glass is essential for secure public kiosks and ATMs, while a waterproof touch controller for wearables ensures device functionality in all conditions. In the competitive gaming market, a high report rate gaming touch controller provides a tangible performance edge.
  • The medical field benefits from the precision of a touch controller for medical patient monitors, often requiring active stylus support. For industrial settings, a capacitive controller for industrial hmi systems offers robust and reliable operation. The convergence of functionalities is evident in the touch controller ic with haptic driver, creating more immersive user experiences.
  • These targeted solutions, including the single-chip touch solution for appliances and the touch controller for large interactive displays, underscore a market shifting toward application-specific performance, where supply chain decisions based on component capabilities can lead to a 20% faster time-to-market compared to using generalized solutions.

What are the key market drivers leading to the rise in the adoption of Touch Controller IC Industry?

  • The market's growth is significantly driven by the increasing sales of electronic devices.

  • Key drivers are centered on enhancing the functionality and appeal of electronic devices through superior touch performance.
  • The push for better analog-to-digital conversion and a higher signal-to-noise ratio in controllers directly translates to more accurate and reliable touchscreens, a critical factor in consumer purchasing decisions.
  • For instance, flagship smartphones now boast a high report rate that can reduce input lag by over 25%, a key selling point for mobile gamers.
  • The demand for touch and display driver integration is driven by OEM efforts to streamline production and create bezel-less designs.
  • This integrated approach, coupled with advanced noise reduction algorithm techniques and pressure sensitivity measurement, allows for a more feature-rich and cost-effective end product, expanding the market's reach.

What are the market trends shaping the Touch Controller IC Industry?

  • The growing adoption of connected devices globally is an emerging market trend. This development is shaping the future trajectory of the industry.

  • Market trends are increasingly shaped by the demand for more immersive and seamless interactions, pushing the boundaries of user experience design. The rise of ar/vr headset control systems and advanced motion controller integration is creating new opportunities for touch solutions that go beyond simple 2D surfaces.
  • Innovations in projected capacitive technology are enabling more responsive and accurate touch detection, while display-integrated touch designs simplify manufacturing. Furthermore, the development of a predictive touch algorithm allows interfaces to anticipate user actions, reducing perceived latency in high-performance applications, with some implementations showing a 15% improvement in response time.
  • These advancements in capacitive sensing method and user interface hardware are critical as devices become more complex.

What challenges does the Touch Controller IC Industry face during its growth?

  • Intense price competition presents a key challenge that affects the industry's growth trajectory.

  • The market faces significant challenges from intense price competition and supply chain vulnerabilities, which impact profitability and innovation. The commoditization of standard multi-touch controller chips pressures vendors to lower costs through semiconductor manufacturing process optimizations. However, raw material shortages can increase wafer fabrication cost by up to 18%, squeezing margins.
  • This environment makes it difficult to invest in R&D for next-generation features like active stylus compatibility or foldable screen interface support. As a result, companies must balance cost pressures with the need for technological differentiation, where a strong intellectual property portfolio becomes a key strategic asset. These factors create a complex operational landscape for market participants.

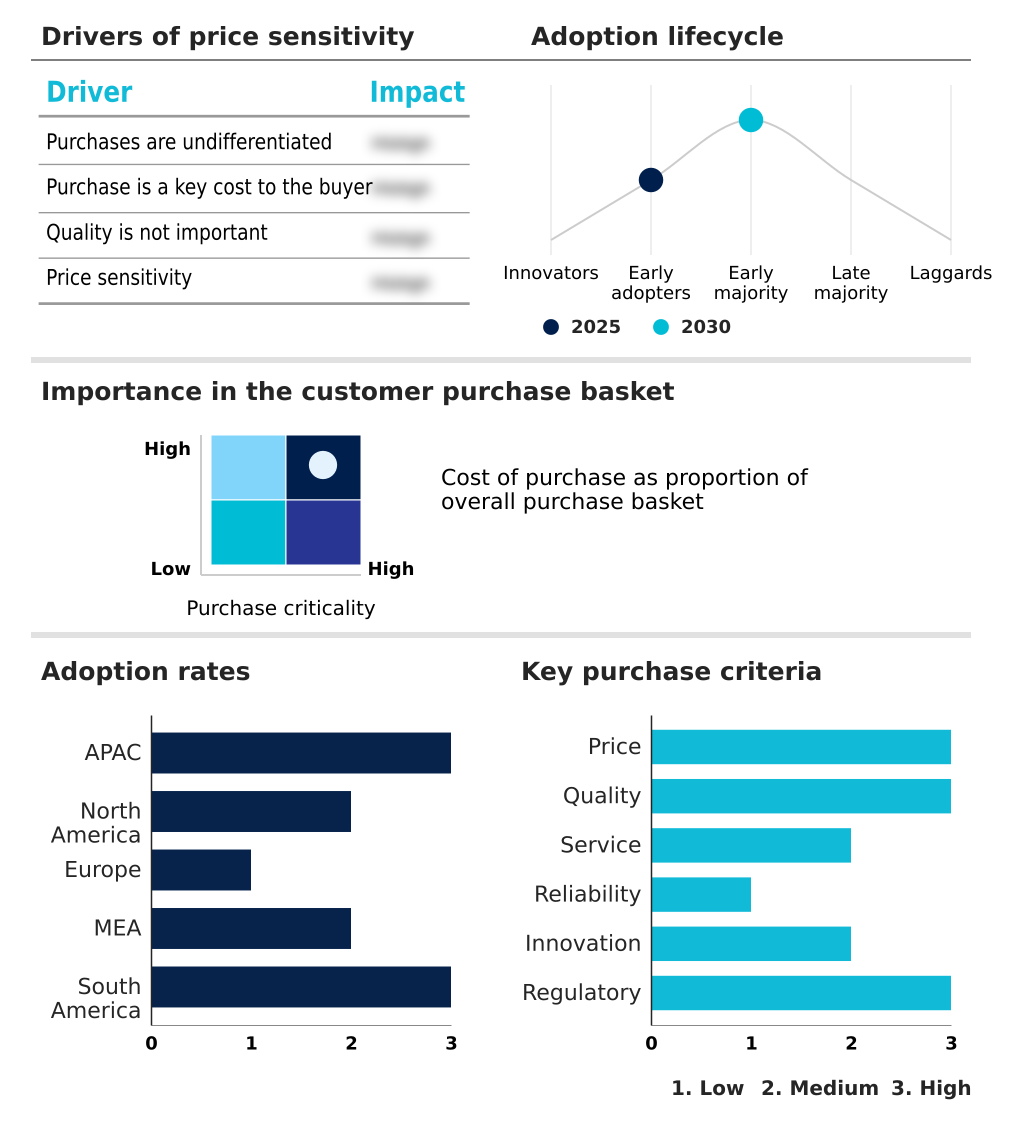
Exclusive Technavio Analysis on Customer Landscape

The touch controller ic market forecasting report includes the adoption lifecycle of the market, covering from the innovator’s stage to the laggard’s stage. It focuses on adoption rates in different regions based on penetration. Furthermore, the touch controller ic market report also includes key purchase criteria and drivers of price sensitivity to help companies evaluate and develop their market growth analysis strategies.

Customer Landscape of Touch Controller IC Industry

Competitive Landscape

Companies are implementing various strategies, such as strategic alliances, touch controller ic market forecast, partnerships, mergers and acquisitions, geographical expansion, and product/service launches, to enhance their presence in the industry.

Analog Devices Inc. - Offerings include a portfolio of high-performance touch controller ICs, providing advanced sensing solutions for diverse electronic applications and interfaces.

The industry research and growth report includes detailed analyses of the competitive landscape of the market and information about key companies, including:

  • Analog Devices Inc.
  • Apex Material Technology Corp.
  • Cirque Corp.
  • eGalax eMPIA Technology Inc.
  • Elo Touch Solutions Inc.
  • FocalTech Systems Co. Ltd.
  • Hycon Technology Corp.
  • Infineon Technologies AG
  • MELFAS BD
  • Microchip Technology Inc.
  • ROHM Co. Ltd.
  • Samsung Electronics Co. Ltd.
  • Semtech Corp.
  • Silicon Laboratories Inc.
  • Sitronix Technology Corp.
  • Solomon Systech International
  • STMicroelectronics NV
  • Synaptics Inc.
  • Texas Instruments Inc.

Qualitative and quantitative analysis of companies has been conducted to help clients understand the wider business environment as well as the strengths and weaknesses of key industry players. Data is qualitatively analyzed to categorize companies as pure play, category-focused, industry-focused, and diversified; it is quantitatively analyzed to categorize companies as dominant, leading, strong, tentative, and weak.

Recent Development and News in Touch controller ic market

  • In September 2024, OnePlus launched its flagship smartphone featuring a custom touch and display driver integration (TDDI) solution to enable a high touch sampling rate for an enhanced gaming experience.
  • In September 2024, AEG introduced a new line of smart home appliances with curved glass touch panels, driving demand for touch controller ICs capable of managing inputs on non-planar surfaces.
  • In December 2024, Microchip Technology released the MTCH2120, a turnkey capacitive touch controller designed to simplify the migration from mechanical buttons in various low-power applications.
  • In January 2025, BMW revealed its Panoramic iDrive system, which uses a network of high-performance, automotive-grade touch controller ICs to manage a seamless, pillar-to-pillar dashboard display in its upcoming vehicles.

Dive into Technavio’s robust research methodology, blending expert interviews, extensive data synthesis, and validated models for unparalleled Touch Controller IC Market insights. See full methodology.

Market Scope
Page number 294
Base year 2025
Historic period 2020-2024
Forecast period 2026-2030
Growth momentum & CAGR Accelerate at a CAGR of 15.8%
Market growth 2026-2030 USD 19258.7 million
Market structure Fragmented
YoY growth 2025-2026(%) 13.6%
Key countries China, Japan, South Korea, India, Australia, Indonesia, US, Canada, Mexico, Germany, UK, France, Italy, Spain, The Netherlands, UAE, Saudi Arabia, South Africa, Egypt, Turkey, Brazil, Argentina and Chile
Competitive landscape Leading Companies, Market Positioning of Companies, Competitive Strategies, and Industry Risks

Request Free Sample

Research Analyst Overview

  • The Touch Controller IC Market continues its evolution, driven by the demand for more sophisticated and integrated solutions. The industry is moving beyond basic human-machine interface functionalities toward creating holistic user experiences. This involves the integration of haptic feedback system technology and advanced force sensing capability, which are becoming standard in premium devices.
  • A key trend influencing boardroom strategy is the adoption of a secure touch interface with on-chip encryption, directly addressing cybersecurity concerns and compliance mandates. For example, financial and medical device manufacturers are now prioritizing controllers with this feature, leading to a demonstrable reduction in data breach risks.
  • Innovations such as in-cell touch technology and on-cell touch display are enabling thinner device profiles, while support for thick glass support and glove touch capability expands applicability in industrial and public-facing terminals.
  • The development of a robust palm rejection feature and superior waterproof touch controller performance are critical for usability in mobile and outdoor devices, underscoring the market’s focus on performance and reliability.

What are the Key Data Covered in this Touch Controller IC Market Research and Growth Report?

  • What is the expected growth of the Touch Controller IC Market between 2026 and 2030?

    • USD 19.26 billion, at a CAGR of 15.8%

  • What segmentation does the market report cover?

    • The report is segmented by Product (Automotive, Smartphones, ATMs, and Others), Technology (Resistive touchscreen, and Capacitive touchscreen), Type (Multi-touch controllers, and Single-touch controllers) and Geography (APAC, North America, Europe, Middle East and Africa, South America)

  • Which regions are analyzed in the report?

    • APAC, North America, Europe, Middle East and Africa and South America

  • What are the key growth drivers and market challenges?

    • Increasing sales of electronic devices, Intense price competition

  • Who are the major players in the Touch Controller IC Market?

    • Analog Devices Inc., Apex Material Technology Corp., Cirque Corp., eGalax eMPIA Technology Inc., Elo Touch Solutions Inc., FocalTech Systems Co. Ltd., Hycon Technology Corp., Infineon Technologies AG, MELFAS BD, Microchip Technology Inc., ROHM Co. Ltd., Samsung Electronics Co. Ltd., Semtech Corp., Silicon Laboratories Inc., Sitronix Technology Corp., Solomon Systech International, STMicroelectronics NV, Synaptics Inc. and Texas Instruments Inc.

Market Research Insights

  • The market's dynamics are shaped by the drive for superior user interface hardware and bill of materials reduction. The adoption of integrated system-on-chip design has led to a 15% decrease in component count for mid-range devices, enhancing design flexibility.
  • Furthermore, advanced firmware development has improved capacitive sensing method accuracy, with some industrial automation control systems reporting a 20% reduction in false-touch events. This focus on performance is evident in the push for better electromagnetic compatibility and sensor grid design.
  • The competitive landscape compels vendors to protect their intellectual property portfolio while innovating in areas like wafer fabrication cost optimization, where new techniques have lowered production expenses by up to 10% for certain advanced process nodes, influencing overall market pricing and accessibility.

We can help! Our analysts can customize this touch controller ic market research report to meet your requirements.

Get in touch

1. Executive Summary

1.1 Market overview

Executive Summary - Chart on Market Overview
Executive Summary - Data Table on Market Overview
Executive Summary - Chart on Global Market Characteristics
Executive Summary - Chart on Market by Geography
Executive Summary - Chart on Market Segmentation by Product
Executive Summary - Chart on Market Segmentation by Technology
Executive Summary - Chart on Market Segmentation by Type
Executive Summary - Chart on Incremental Growth
Executive Summary - Data Table on Incremental Growth
Executive Summary - Chart on Company Market Positioning

2. Technavio Analysis

2.1 Analysis of price sensitivity, lifecycle, customer purchase basket, adoption rates, and purchase criteria

2.2 Criticality of inputs and Factors of differentiation

Chart on Overview on criticality of inputs and factors of differentiation

2.3 Factors of disruption

Chart on Overview on factors of disruption

2.4 Impact of drivers and challenges

Chart on Impact of drivers and challenges in 2025 and 2030

3. Market Landscape

3.1 Market ecosystem

Chart on Parent Market
Data Table on - Parent Market

3.2 Market characteristics

Chart on Market characteristics analysis

3.3 Value chain analysis

Chart on Value chain analysis

4. Market Sizing

4.1 Market definition

Data Table on Offerings of companies included in the market definition

4.2 Market segment analysis

Market segments

4.3 Market size 2025

4.4 Market outlook: Forecast for 2025-2030

Chart on Global - Market size and forecast 2025-2030 ($ million)
Data Table on Global - Market size and forecast 2025-2030 ($ million)
Chart on Global Market: Year-over-year growth 2025-2030 (%)
Data Table on Global Market: Year-over-year growth 2025-2030 (%)

5. Historic Market Size

5.1 Global Touch Controller IC Market 2020 - 2024

Historic Market Size - Data Table on Global Touch Controller IC Market 2020 - 2024 ($ million)

5.2 Product segment analysis 2020 - 2024

Historic Market Size - Product Segment 2020 - 2024 ($ million)

5.3 Technology segment analysis 2020 - 2024

Historic Market Size - Technology Segment 2020 - 2024 ($ million)

5.4 Type segment analysis 2020 - 2024

Historic Market Size - Type Segment 2020 - 2024 ($ million)

5.5 Geography segment analysis 2020 - 2024

Historic Market Size - Geography Segment 2020 - 2024 ($ million)

5.6 Country segment analysis 2020 - 2024

Historic Market Size - Country Segment 2020 - 2024 ($ million)

6. Qualitative Analysis

6.1 The AI impact on Global Touch Controller IC Market

7. Five Forces Analysis

7.1 Five forces summary

Five forces analysis - Comparison between 2025 and 2030

7.2 Bargaining power of buyers

Bargaining power of buyers - Impact of key factors 2025 and 2030

7.3 Bargaining power of suppliers

Bargaining power of suppliers - Impact of key factors in 2025 and 2030

7.4 Threat of new entrants

Threat of new entrants - Impact of key factors in 2025 and 2030

7.5 Threat of substitutes

Threat of substitutes - Impact of key factors in 2025 and 2030

7.6 Threat of rivalry

Threat of rivalry - Impact of key factors in 2025 and 2030

7.7 Market condition

Chart on Market condition - Five forces 2025 and 2030

8. Market Segmentation by Product

8.1 Market segments

Chart on Product - Market share 2025-2030 (%)
Data Table on Product - Market share 2025-2030 (%)

8.2 Comparison by Product

Chart on Comparison by Product
Data Table on Comparison by Product

8.3 Automotive - Market size and forecast 2025-2030

Chart on Automotive - Market size and forecast 2025-2030 ($ million)
Data Table on Automotive - Market size and forecast 2025-2030 ($ million)
Chart on Automotive - Year-over-year growth 2025-2030 (%)
Data Table on Automotive - Year-over-year growth 2025-2030 (%)

8.4 Smartphones - Market size and forecast 2025-2030

Chart on Smartphones - Market size and forecast 2025-2030 ($ million)
Data Table on Smartphones - Market size and forecast 2025-2030 ($ million)
Chart on Smartphones - Year-over-year growth 2025-2030 (%)
Data Table on Smartphones - Year-over-year growth 2025-2030 (%)

8.5 ATMs - Market size and forecast 2025-2030

Chart on ATMs - Market size and forecast 2025-2030 ($ million)
Data Table on ATMs - Market size and forecast 2025-2030 ($ million)
Chart on ATMs - Year-over-year growth 2025-2030 (%)
Data Table on ATMs - Year-over-year growth 2025-2030 (%)

8.6 Others - Market size and forecast 2025-2030

Chart on Others - Market size and forecast 2025-2030 ($ million)
Data Table on Others - Market size and forecast 2025-2030 ($ million)
Chart on Others - Year-over-year growth 2025-2030 (%)
Data Table on Others - Year-over-year growth 2025-2030 (%)

8.7 Market opportunity by Product

Market opportunity by Product ($ million)
Data Table on Market opportunity by Product ($ million)

9. Market Segmentation by Technology

9.1 Market segments

Chart on Technology - Market share 2025-2030 (%)
Data Table on Technology - Market share 2025-2030 (%)

9.2 Comparison by Technology

Chart on Comparison by Technology
Data Table on Comparison by Technology

9.3 Resistive touchscreen - Market size and forecast 2025-2030

Chart on Resistive touchscreen - Market size and forecast 2025-2030 ($ million)
Data Table on Resistive touchscreen - Market size and forecast 2025-2030 ($ million)
Chart on Resistive touchscreen - Year-over-year growth 2025-2030 (%)
Data Table on Resistive touchscreen - Year-over-year growth 2025-2030 (%)

9.4 Capacitive touchscreen - Market size and forecast 2025-2030

Chart on Capacitive touchscreen - Market size and forecast 2025-2030 ($ million)
Data Table on Capacitive touchscreen - Market size and forecast 2025-2030 ($ million)
Chart on Capacitive touchscreen - Year-over-year growth 2025-2030 (%)
Data Table on Capacitive touchscreen - Year-over-year growth 2025-2030 (%)

9.5 Market opportunity by Technology

Market opportunity by Technology ($ million)
Data Table on Market opportunity by Technology ($ million)

10. Market Segmentation by Type

10.1 Market segments

Chart on Type - Market share 2025-2030 (%)
Data Table on Type - Market share 2025-2030 (%)

10.2 Comparison by Type

Chart on Comparison by Type
Data Table on Comparison by Type

10.3 Multi-touch controllers - Market size and forecast 2025-2030

Chart on Multi-touch controllers - Market size and forecast 2025-2030 ($ million)
Data Table on Multi-touch controllers - Market size and forecast 2025-2030 ($ million)
Chart on Multi-touch controllers - Year-over-year growth 2025-2030 (%)
Data Table on Multi-touch controllers - Year-over-year growth 2025-2030 (%)

10.4 Single-touch controllers - Market size and forecast 2025-2030

Chart on Single-touch controllers - Market size and forecast 2025-2030 ($ million)
Data Table on Single-touch controllers - Market size and forecast 2025-2030 ($ million)
Chart on Single-touch controllers - Year-over-year growth 2025-2030 (%)
Data Table on Single-touch controllers - Year-over-year growth 2025-2030 (%)

10.5 Market opportunity by Type

Market opportunity by Type ($ million)
Data Table on Market opportunity by Type ($ million)

11. Customer Landscape

11.1 Customer landscape overview

Analysis of price sensitivity, lifecycle, customer purchase basket, adoption rates, and purchase criteria

12. Geographic Landscape

12.1 Geographic segmentation

Chart on Market share by geography 2025-2030 (%)
Data Table on Market share by geography 2025-2030 (%)

12.2 Geographic comparison

Chart on Geographic comparison
Data Table on Geographic comparison

12.3 APAC - Market size and forecast 2025-2030

Chart on APAC - Market size and forecast 2025-2030 ($ million)
Data Table on APAC - Market size and forecast 2025-2030 ($ million)
Chart on APAC - Year-over-year growth 2025-2030 (%)
Data Table on APAC - Year-over-year growth 2025-2030 (%)
Chart on Regional Comparison - APAC
Data Table on Regional Comparison - APAC

12.3.1 China - Market size and forecast 2025-2030

Chart on China - Market size and forecast 2025-2030 ($ million)
Data Table on China - Market size and forecast 2025-2030 ($ million)
Chart on China - Year-over-year growth 2025-2030 (%)
Data Table on China - Year-over-year growth 2025-2030 (%)

12.3.2 Japan - Market size and forecast 2025-2030

Chart on Japan - Market size and forecast 2025-2030 ($ million)
Data Table on Japan - Market size and forecast 2025-2030 ($ million)
Chart on Japan - Year-over-year growth 2025-2030 (%)
Data Table on Japan - Year-over-year growth 2025-2030 (%)

12.3.3 South Korea - Market size and forecast 2025-2030

Chart on South Korea - Market size and forecast 2025-2030 ($ million)
Data Table on South Korea - Market size and forecast 2025-2030 ($ million)
Chart on South Korea - Year-over-year growth 2025-2030 (%)
Data Table on South Korea - Year-over-year growth 2025-2030 (%)

12.3.4 India - Market size and forecast 2025-2030

Chart on India - Market size and forecast 2025-2030 ($ million)
Data Table on India - Market size and forecast 2025-2030 ($ million)
Chart on India - Year-over-year growth 2025-2030 (%)
Data Table on India - Year-over-year growth 2025-2030 (%)

12.3.5 Australia - Market size and forecast 2025-2030

Chart on Australia - Market size and forecast 2025-2030 ($ million)
Data Table on Australia - Market size and forecast 2025-2030 ($ million)
Chart on Australia - Year-over-year growth 2025-2030 (%)
Data Table on Australia - Year-over-year growth 2025-2030 (%)

12.3.6 Indonesia - Market size and forecast 2025-2030

Chart on Indonesia - Market size and forecast 2025-2030 ($ million)
Data Table on Indonesia - Market size and forecast 2025-2030 ($ million)
Chart on Indonesia - Year-over-year growth 2025-2030 (%)
Data Table on Indonesia - Year-over-year growth 2025-2030 (%)

12.4 North America - Market size and forecast 2025-2030

Chart on North America - Market size and forecast 2025-2030 ($ million)
Data Table on North America - Market size and forecast 2025-2030 ($ million)
Chart on North America - Year-over-year growth 2025-2030 (%)
Data Table on North America - Year-over-year growth 2025-2030 (%)
Chart on Regional Comparison - North America
Data Table on Regional Comparison - North America

12.4.1 US - Market size and forecast 2025-2030

Chart on US - Market size and forecast 2025-2030 ($ million)
Data Table on US - Market size and forecast 2025-2030 ($ million)
Chart on US - Year-over-year growth 2025-2030 (%)
Data Table on US - Year-over-year growth 2025-2030 (%)

12.4.2 Canada - Market size and forecast 2025-2030

Chart on Canada - Market size and forecast 2025-2030 ($ million)
Data Table on Canada - Market size and forecast 2025-2030 ($ million)
Chart on Canada - Year-over-year growth 2025-2030 (%)
Data Table on Canada - Year-over-year growth 2025-2030 (%)

12.4.3 Mexico - Market size and forecast 2025-2030

Chart on Mexico - Market size and forecast 2025-2030 ($ million)
Data Table on Mexico - Market size and forecast 2025-2030 ($ million)
Chart on Mexico - Year-over-year growth 2025-2030 (%)
Data Table on Mexico - Year-over-year growth 2025-2030 (%)

12.5 Europe - Market size and forecast 2025-2030

Chart on Europe - Market size and forecast 2025-2030 ($ million)
Data Table on Europe - Market size and forecast 2025-2030 ($ million)
Chart on Europe - Year-over-year growth 2025-2030 (%)
Data Table on Europe - Year-over-year growth 2025-2030 (%)
Chart on Regional Comparison - Europe
Data Table on Regional Comparison - Europe

12.5.1 Germany - Market size and forecast 2025-2030

Chart on Germany - Market size and forecast 2025-2030 ($ million)
Data Table on Germany - Market size and forecast 2025-2030 ($ million)
Chart on Germany - Year-over-year growth 2025-2030 (%)
Data Table on Germany - Year-over-year growth 2025-2030 (%)

12.5.2 UK - Market size and forecast 2025-2030

Chart on UK - Market size and forecast 2025-2030 ($ million)
Data Table on UK - Market size and forecast 2025-2030 ($ million)
Chart on UK - Year-over-year growth 2025-2030 (%)
Data Table on UK - Year-over-year growth 2025-2030 (%)

12.5.3 France - Market size and forecast 2025-2030

Chart on France - Market size and forecast 2025-2030 ($ million)
Data Table on France - Market size and forecast 2025-2030 ($ million)
Chart on France - Year-over-year growth 2025-2030 (%)
Data Table on France - Year-over-year growth 2025-2030 (%)

12.5.4 Italy - Market size and forecast 2025-2030

Chart on Italy - Market size and forecast 2025-2030 ($ million)
Data Table on Italy - Market size and forecast 2025-2030 ($ million)
Chart on Italy - Year-over-year growth 2025-2030 (%)
Data Table on Italy - Year-over-year growth 2025-2030 (%)

12.5.5 Spain - Market size and forecast 2025-2030

Chart on Spain - Market size and forecast 2025-2030 ($ million)
Data Table on Spain - Market size and forecast 2025-2030 ($ million)
Chart on Spain - Year-over-year growth 2025-2030 (%)
Data Table on Spain - Year-over-year growth 2025-2030 (%)

12.5.6 The Netherlands - Market size and forecast 2025-2030

Chart on The Netherlands - Market size and forecast 2025-2030 ($ million)
Data Table on The Netherlands - Market size and forecast 2025-2030 ($ million)
Chart on The Netherlands - Year-over-year growth 2025-2030 (%)
Data Table on The Netherlands - Year-over-year growth 2025-2030 (%)

12.6 Middle East and Africa - Market size and forecast 2025-2030

Chart on Middle East and Africa - Market size and forecast 2025-2030 ($ million)
Data Table on Middle East and Africa - Market size and forecast 2025-2030 ($ million)
Chart on Middle East and Africa - Year-over-year growth 2025-2030 (%)
Data Table on Middle East and Africa - Year-over-year growth 2025-2030 (%)
Chart on Regional Comparison - Middle East and Africa
Data Table on Regional Comparison - Middle East and Africa

12.6.1 UAE - Market size and forecast 2025-2030

Chart on UAE - Market size and forecast 2025-2030 ($ million)
Data Table on UAE - Market size and forecast 2025-2030 ($ million)
Chart on UAE - Year-over-year growth 2025-2030 (%)
Data Table on UAE - Year-over-year growth 2025-2030 (%)

12.6.2 Saudi Arabia - Market size and forecast 2025-2030

Chart on Saudi Arabia - Market size and forecast 2025-2030 ($ million)
Data Table on Saudi Arabia - Market size and forecast 2025-2030 ($ million)
Chart on Saudi Arabia - Year-over-year growth 2025-2030 (%)
Data Table on Saudi Arabia - Year-over-year growth 2025-2030 (%)

12.6.3 South Africa - Market size and forecast 2025-2030

Chart on South Africa - Market size and forecast 2025-2030 ($ million)
Data Table on South Africa - Market size and forecast 2025-2030 ($ million)
Chart on South Africa - Year-over-year growth 2025-2030 (%)
Data Table on South Africa - Year-over-year growth 2025-2030 (%)

12.6.4 Egypt - Market size and forecast 2025-2030

Chart on Egypt - Market size and forecast 2025-2030 ($ million)
Data Table on Egypt - Market size and forecast 2025-2030 ($ million)
Chart on Egypt - Year-over-year growth 2025-2030 (%)
Data Table on Egypt - Year-over-year growth 2025-2030 (%)

12.6.5 Turkey - Market size and forecast 2025-2030

Chart on Turkey - Market size and forecast 2025-2030 ($ million)
Data Table on Turkey - Market size and forecast 2025-2030 ($ million)
Chart on Turkey - Year-over-year growth 2025-2030 (%)
Data Table on Turkey - Year-over-year growth 2025-2030 (%)

12.7 South America - Market size and forecast 2025-2030

Chart on South America - Market size and forecast 2025-2030 ($ million)
Data Table on South America - Market size and forecast 2025-2030 ($ million)
Chart on South America - Year-over-year growth 2025-2030 (%)
Data Table on South America - Year-over-year growth 2025-2030 (%)
Chart on Regional Comparison - South America
Data Table on Regional Comparison - South America

12.7.1 Brazil - Market size and forecast 2025-2030

Chart on Brazil - Market size and forecast 2025-2030 ($ million)
Data Table on Brazil - Market size and forecast 2025-2030 ($ million)
Chart on Brazil - Year-over-year growth 2025-2030 (%)
Data Table on Brazil - Year-over-year growth 2025-2030 (%)

12.7.2 Argentina - Market size and forecast 2025-2030

Chart on Argentina - Market size and forecast 2025-2030 ($ million)
Data Table on Argentina - Market size and forecast 2025-2030 ($ million)
Chart on Argentina - Year-over-year growth 2025-2030 (%)
Data Table on Argentina - Year-over-year growth 2025-2030 (%)

12.7.3 Chile - Market size and forecast 2025-2030

Chart on Chile - Market size and forecast 2025-2030 ($ million)
Data Table on Chile - Market size and forecast 2025-2030 ($ million)
Chart on Chile - Year-over-year growth 2025-2030 (%)
Data Table on Chile - Year-over-year growth 2025-2030 (%)

12.8 Market opportunity by geography

Market opportunity by geography ($ million)
Data Tables on Market opportunity by geography ($ million)

13. Drivers, Challenges, and Opportunity

13.1 Market drivers

Increasing sales of electronic devices
Consumer inclination toward new technologies and devices
Increase in adoption of touch screens in retail and healthcare sector

13.2 Market challenges

Intense price competition
Semiconductor and raw material shortages
Lack of infrastructure and connectivity issues

13.3 Impact of drivers and challenges

Impact of drivers and challenges in 2025 and 2030

13.4 Market opportunities

Growing adoption of connected devices globally
Introduction of motion controller
Introduction of AR and VR devices

14. Competitive Landscape

14.1 Overview

14.2

Overview on criticality of inputs and factors of differentiation

14.3 Landscape disruption

Overview on factors of disruption

14.4 Industry risks

Impact of key risks on business

15. Competitive Analysis

15.1 Companies profiled

Companies covered

15.2 Company ranking index

15.3 Market positioning of companies

Matrix on companies position and classification

15.4 Analog Devices Inc.

Analog Devices Inc. - Overview
Analog Devices Inc. - Business segments
Analog Devices Inc. - Key news
Analog Devices Inc. - Key offerings
Analog Devices Inc. - Segment focus
SWOT

15.5 Apex Material Technology Corp.

Apex Material Technology Corp. - Overview
Apex Material Technology Corp. - Product / Service
Apex Material Technology Corp. - Key offerings
SWOT

15.6 Cirque Corp.

Cirque Corp. - Overview
Cirque Corp. - Product / Service
Cirque Corp. - Key offerings
SWOT

15.7 FocalTech Systems Co. Ltd.

FocalTech Systems Co. Ltd. - Overview
FocalTech Systems Co. Ltd. - Product / Service
FocalTech Systems Co. Ltd. - Key offerings
SWOT

15.8 Infineon Technologies AG

Infineon Technologies AG - Overview
Infineon Technologies AG - Business segments
Infineon Technologies AG - Key news
Infineon Technologies AG - Key offerings
Infineon Technologies AG - Segment focus
SWOT

15.9 MELFAS BD

MELFAS BD - Overview
MELFAS BD - Product / Service
MELFAS BD - Key offerings
SWOT

15.10 Microchip Technology Inc.

Microchip Technology Inc. - Overview
Microchip Technology Inc. - Business segments
Microchip Technology Inc. - Key news
Microchip Technology Inc. - Key offerings
Microchip Technology Inc. - Segment focus
SWOT

15.11 ROHM Co. Ltd.

ROHM Co. Ltd. - Overview
ROHM Co. Ltd. - Business segments
ROHM Co. Ltd. - Key news
ROHM Co. Ltd. - Key offerings
ROHM Co. Ltd. - Segment focus
SWOT

15.12 Samsung Electronics Co. Ltd.

Samsung Electronics Co. Ltd. - Overview
Samsung Electronics Co. Ltd. - Business segments
Samsung Electronics Co. Ltd. - Key news
Samsung Electronics Co. Ltd. - Key offerings
Samsung Electronics Co. Ltd. - Segment focus
SWOT

15.13 Semtech Corp.

Semtech Corp. - Overview
Semtech Corp. - Business segments
Semtech Corp. - Key news
Semtech Corp. - Key offerings
Semtech Corp. - Segment focus
SWOT

15.14 Silicon Laboratories Inc.

Silicon Laboratories Inc. - Overview
Silicon Laboratories Inc. - Product / Service
Silicon Laboratories Inc. - Key news
Silicon Laboratories Inc. - Key offerings
SWOT

15.15 Sitronix Technology Corp.

Sitronix Technology Corp. - Overview
Sitronix Technology Corp. - Business segments
Sitronix Technology Corp. - Key offerings
Sitronix Technology Corp. - Segment focus
SWOT

15.16 STMicroelectronics NV

STMicroelectronics NV - Overview
STMicroelectronics NV - Business segments
STMicroelectronics NV - Key news
STMicroelectronics NV - Key offerings
STMicroelectronics NV - Segment focus
SWOT

15.17 Synaptics Inc.

Synaptics Inc. - Overview
Synaptics Inc. - Product / Service
Synaptics Inc. - Key offerings
SWOT

15.18 Texas Instruments Inc.

Texas Instruments Inc. - Overview
Texas Instruments Inc. - Business segments
Texas Instruments Inc. - Key offerings
Texas Instruments Inc. - Segment focus
SWOT

16. Appendix

16.1 Scope of the report

Market definition
Objectives
Notes and caveats

16.2 Inclusions and exclusions checklist

Inclusions checklist
Exclusions checklist

16.3 Currency conversion rates for US$

16.4 Research methodology

16.5 Data procurement

Information sources

16.6 Data validation

16.7 Validation techniques employed for market sizing

16.8 Data synthesis

16.9 360 degree market analysis

16.10 List of abbreviations

Research Methodology

Technavio presents a detailed picture of the market by way of study, synthesis, and summation of data from multiple sources. The analysts have presented the various facets of the market with a particular focus on identifying the key industry influencers. The data thus presented is comprehensive, reliable, and the result of extensive research, both primary and secondary.

INFORMATION SOURCES

Primary sources

  • Manufacturers and suppliers
  • Channel partners
  • Industry experts
  • Strategic decision makers

Secondary sources

  • Industry journals and periodicals
  • Government data
  • Financial reports of key industry players
  • Historical data
  • Press releases

DATA ANALYSIS

Data Synthesis

  • Collation of data
  • Estimation of key figures
  • Analysis of derived insights

Data Validation

  • Triangulation with data models
  • Reference against proprietary databases
  • Corroboration with industry experts

REPORT WRITING

Qualitative

  • Market drivers
  • Market challenges
  • Market trends
  • Five forces analysis

Quantitative

  • Market size and forecast
  • Market segmentation
  • Geographical insights
  • Competitive landscape

Interested in this report?

Get your sample now to see our research methodology and insights!

Download Now

Frequently Asked Questions

Touch Controller IC market growth will increase by USD 19258.7 million during 2026-2030.

The Touch Controller IC market is expected to grow at a CAGR of 15.8% during 2026-2030.

Touch Controller IC market is segmented by Product (Automotive, Smartphones, ATMs, Others) Technology (Resistive touchscreen , Capacitive touchscreen) Type (Multi-touch controllers, Single-touch controllers)

Analog Devices Inc., Apex Material Technology Corp., Cirque Corp., eGalax eMPIA Technology Inc., Elo Touch Solutions Inc., FocalTech Systems Co. Ltd., Hycon Technology Corp., Infineon Technologies AG, MELFAS BD, Microchip Technology Inc., ROHM Co. Ltd., Samsung Electronics Co. Ltd., Semtech Corp., Silicon Laboratories Inc., Sitronix Technology Corp., Solomon Systech International, STMicroelectronics NV, Synaptics Inc., Texas Instruments Inc. are a few of the key vendors in the Touch Controller IC market.

APAC will register the highest growth rate of 43.8% among the other regions. Therefore, the Touch Controller IC market in APAC is expected to garner significant business opportunities for the vendors during the forecast period.

China, Japan, South Korea, India, Australia, Indonesia, US, Canada, Mexico, Germany, UK, France, Italy, Spain, The Netherlands, UAE, Saudi Arabia, South Africa, Egypt, Turkey, Brazil, Argentina, Chile

  • Increasing sales of electronic devices is the driving factor this market.

The Touch Controller IC market vendors should focus on grabbing business opportunities from the Product segment as it accounted for the largest market share in the base year.