UPS Battery For Data Center Market Size 2025-2029
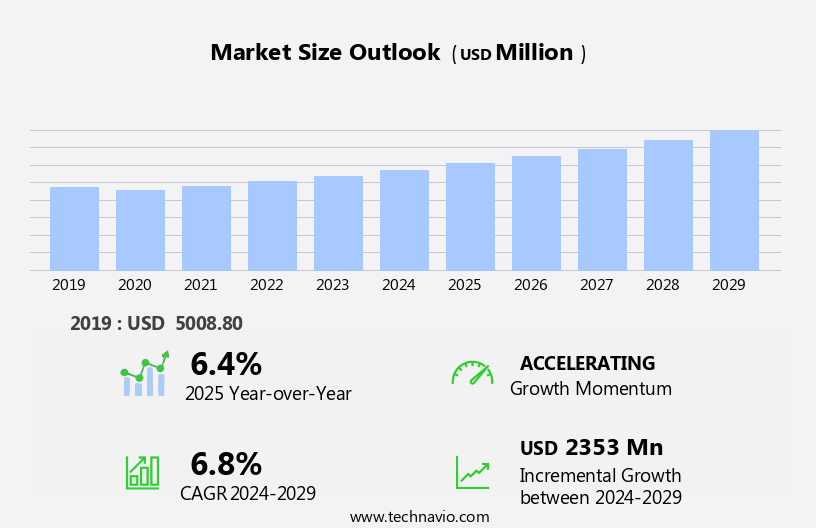
The UPS battery for data center market size is forecast to increase by USD 2.35 billion, at a CAGR of 6.8% between 2024 and 2029.
- The market is experiencing significant growth, driven by the increasing adoption of modular Uninterruptible Power Supply (UPS) systems and the ongoing construction of new data centers. The modular design of UPS systems offers several advantages, including scalability, flexibility, and improved efficiency, making them a popular choice for data center operators. Furthermore, the consolidation of data centers is also contributing to market growth as companies seek to optimize their IT infrastructure and reduce operational costs. However, the market faces regulatory hurdles that impact adoption. Strict regulations regarding the disposal of used UPS batteries and the increasing focus on renewable energy sources pose challenges for market growth.
- Additionally, supply chain inconsistencies can temper growth potential, as the availability and reliability of critical components can significantly impact the performance and reliability of UPS systems. Companies seeking to capitalize on market opportunities must navigate these challenges effectively by ensuring regulatory compliance, building strong supplier relationships, and investing in research and development to address the evolving needs of the data center industry.
What will be the Size of the UPS Battery For Data Center Market during the forecast period?
- In the dynamic data center market, the need for uninterrupted power supply is paramount. Power fluctuations, rise, and outages pose significant risks to data center operations, leading to costly downtime and potential data loss. To mitigate these risks, data center operators are increasingly adopting advanced technologies such as machine learning and artificial intelligence for power monitoring and automation. Data center migration and virtualization are driving the demand for more efficient power management solutions. Battery testing and replacement are crucial components of data center maintenance, ensuring optimal performance and reliability. Power surge and outage prevention are key concerns, with data center design incorporating robust backup power systems, including batteries.
- Big data analytics and the Internet of Things (IoT) are transforming data center operations, enabling real-time monitoring and predictive maintenance. Data center security and optimization are also critical, with power management playing a crucial role in both areas. Power monitoring software and data center analytics help identify potential vulnerabilities and inefficiencies, enabling proactive measures. Battery recycling is an emerging trend, with data center operators seeking to minimize their environmental footprint and reduce costs. As the data center market continues to evolve, power management will remain a key focus area, with advanced technologies and innovative solutions driving growth.
How is this UPS Battery For Data Center Industry segmented?
The UPS battery for data center industry research report provides comprehensive data (region-wise segment analysis), with forecasts and estimates in "USD million" for the period 2025-2029, as well as historical data from 2019-2023 for the following segments.
- Application
- Tier 3 data center
- Tier 1 and 2 data center
- Tier 4 data center
- Product
- Lead acid battery
- Lithium-ion battery
- Component
- Solution
- Services
- End-user
- Banking and financial services
- Manufacturing
- Information technology
- Energy
- Others
- Geography
- North America
- US
- Canada
- Europe
- France
- Germany
- Italy
- UK
- APAC
- China
- India
- Japan
- South Korea
- Rest of World (ROW)
- North America
By Application Insights
The tier 3 data center segment is estimated to witness significant growth during the forecast period. Tier 3 data centers prioritize business continuity and disaster recovery through redundant power systems. Power backup solutions, such as uninterruptible power supplies (UPS) and energy storage systems, ensure critical power remains available during power outages or voltage fluctuations. UPS batteries, including lead-acid and valve-regulated lead-acid types, provide power conditioning and voltage regulation. Preventive maintenance and remote monitoring are crucial for optimizing battery life and efficiency. Carbon footprint concerns have led to the adoption of green data centers, utilizing energy-efficient technologies like power factor correction and high availability systems. Data centers also implement power management strategies, such as battery management systems and frequency regulation, to minimize power consumption.
Lithium-ion batteries are increasingly used due to their higher energy density and faster charging times. Data protection is a top priority, with data center infrastructure employing surge protection, surge suppressors, and backup power systems. Edge computing and cloud computing implementations require energy storage systems for uninterrupted power supply. Energy storage systems, including deep-cycle batteries, provide power during peak demand and help balance the grid. Industry standards, such as the Telecommunications Industry Association (TIA) and the American National Standards Institute (ANSI), ensure critical power and energy storage systems meet specifications for safety, reliability, and performance. Battery capacity and charging time are essential factors in selecting the appropriate power backup solution for a data center's needs.
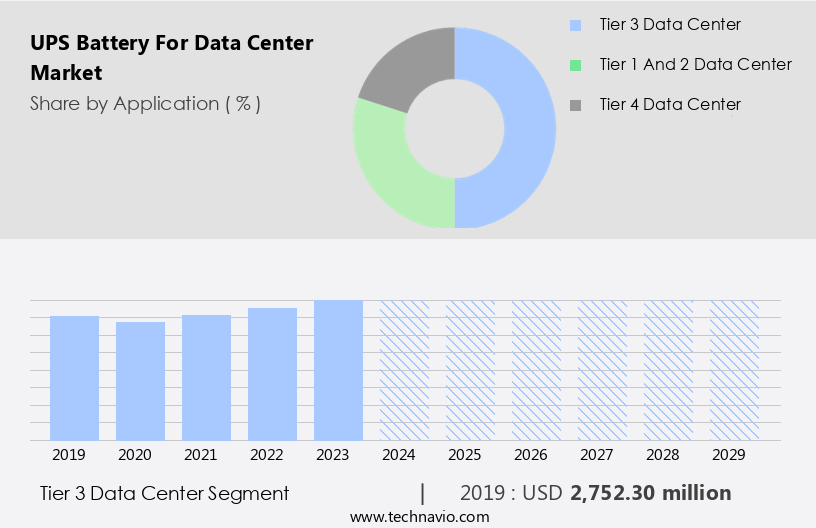
The Tier 3 data center segment was valued at USD 2.75 billion in 2019 and showed a gradual increase during the forecast period.
The UPS Battery For Data Center Market is evolving rapidly as businesses prioritize data center optimization, data center virtualization, and data center automation to enhance efficiency. Reliable battery replacement solutions are essential to counter power outage risks and power fluctuation challenges, ensuring seamless operations. Effective data center cooling strategies further support battery longevity. With the rise of cloud security concerns, UPS batteries play a crucial role in safeguarding critical infrastructure.
The UPS Battery For Data Center Market is witnessing significant growth as businesses focus on sustainability and efficiency. In a server room, maintaining backup power is crucial, especially with concerns over discharge rate impacting performance. Traditional lead-acid battery solutions and advanced VRLA battery systems provide reliable energy storage. A robust battery management system optimizes performance, ensuring seamless operation. The shift toward a green data center promotes eco-friendly solutions, enhanced by energy audit practices that assess efficiency. Additionally, a well-integrated energy storage system supports resilience against power disruptions, strengthening overall infrastructure.
Regional Analysis
North America is estimated to contribute 34% to the growth of the global market during the forecast period. Technavio's analysts have elaborately explained the regional trends and drivers that shape the market during the forecast period.
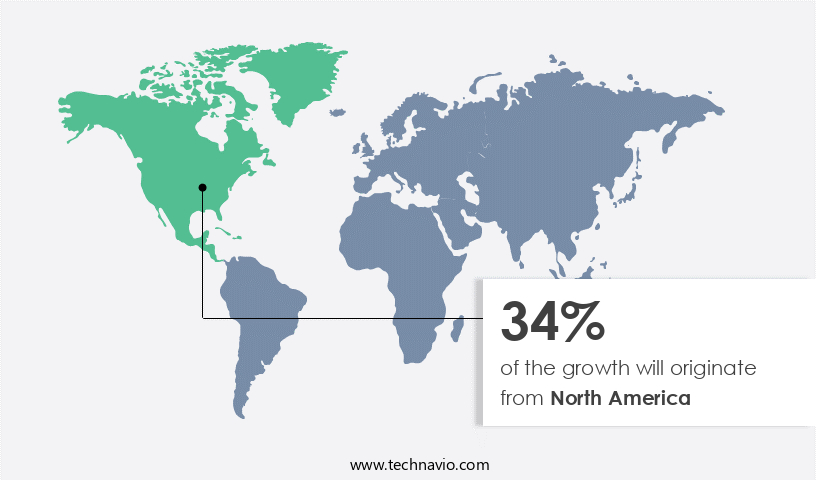
In the dynamic data center landscape of 2024, the North American market held a dominant position in the UPS battery sector, driven by the region's expanding IT infrastructure. The US led the charge, with a surge in data center construction fueled by cloud service providers and colocation facilities. Modular UPS systems gained traction due to their scalability, flexibility, and efficiency, catering to the growing demand for dependable power solutions. Lithium-ion batteries emerged as a preferred alternative to traditional lead-acid batteries, providing higher energy density and longer lifespans. Sustainability initiatives took center stage, with data centers integrating renewable energy sources like wind and solar power, backed by advanced battery storage systems to maintain uninterrupted operations.
Power conditioning, preventive maintenance, and voltage regulation continued to be essential components of data center infrastructure, ensuring high availability and energy efficiency. The data center industry adhered to stringent industry standards, prioritizing critical power, energy storage, and battery management systems for optimal performance. Remote monitoring and frequency regulation further enhanced power distribution, while deep discharge and cycle life considerations factored into battery selection. Edge computing and energy storage systems also gained momentum, expanding the scope of UPS battery applications beyond traditional server rooms.
Market Dynamics
Our researchers analyzed the data with 2024 as the base year, along with the key drivers, trends, and challenges. A holistic analysis of drivers will help companies refine their marketing strategies to gain a competitive advantage.
What are the UPS Battery For Data Center market drivers leading to the rise in the adoption of Industry?
- The significant growth in the adoption of modular Uninterruptible Power Supply (UPS) systems serves as the primary market driver. These systems offer increased efficiency, scalability, and reliability, making them a preferred choice for businesses and organizations seeking uninterrupted power supply solutions. UPS (Uninterruptible Power Supply) systems are essential components of modern data center infrastructure, providing power stability and ensuring high availability. These systems come in various capacities and sizes, including lower capacity modular UPS systems, such as 20 kVA models. The modular approach offers advantages like expandable capacity and reduced maintenance costs. Power fluctuations and outages have become significant concerns in the data center industry, leading to the adoption of these UPS systems alongside racks.
- Adherence to industry standards ensures the reliability and efficiency of these systems. Valve regulated lead-acid batteries are commonly used in UPS systems due to their long life and high performance. The ability to scale capacity and manage power effectively are vital for green data centers, making modular UPS systems a popular choice. The capacity of these systems can cater to one or a few racks based on their IT load. Power management is crucial in data centers, and UPS systems with features like power factor correction, voltage regulation, and float charge are essential.
What are the UPS Battery For Data Center market trends shaping the Industry?
- The trend in the market is characterized by an increase in data center construction. This growth is a significant development in the technology sector. The digital economy's expansion has led to a significant increase in data center demand due to factors such as the rise of cloud computing, growing communication needs, and the proliferation of connected devices. This trend has encouraged companies to construct new data centers, including Bulk Data Centers' 42MW facility in Southern Norway. Designed for high-density GPU and CPU infrastructure, this data center offers both air and liquid cooling capabilities. Energy storage systems, a crucial component of data centers, ensure uninterrupted power supply and enable frequency regulation.
- Battery management systems and remote monitoring are essential features of these energy storage systems, ensuring deep discharge and cycle life while maintaining fault tolerance. Edge computing, another emerging trend, requires power distribution and energy storage solutions for decentralized data processing. Overall, the data center market's growth is driven by these IT infrastructure demands, necessitating advanced energy storage systems and power distribution solutions.
How does UPS Battery For Data Center market faces challenges face during its growth?
- The consolidation of data centers poses a significant challenge to the industry's growth trajectory. This trend, driven by the need for cost savings, improved efficiency, and enhanced security, necessitates strategic planning and execution for organizations seeking to optimize their IT infrastructure. In the IT infrastructure sector, data center consolidation is a growing trend as companies aim to minimize capital expenditures (CAPEX) and operating expenses (OPEX) while enhancing security, data resiliency, scalability, and data recovery measures. Consolidation involves reducing the number of facilities or merging multiple data centers, which decreases the demand for individual UPS battery systems.
- Both VRLA (Valve-Regulated Lead-Acid) and lithium-ion batteries are popular choices due to their energy efficiency and varying battery capacities and charging times. Companies must consider these factors when selecting the most suitable battery solution for their consolidated data center infrastructure. This shift towards cloud adoption and smaller data center footprints poses a challenge to the UPS battery market's growth during the forecast period. Despite this challenge, the need for surge protection remains crucial for ensuring uninterrupted power supply to servers in data rooms.
Exclusive Customer Landscape
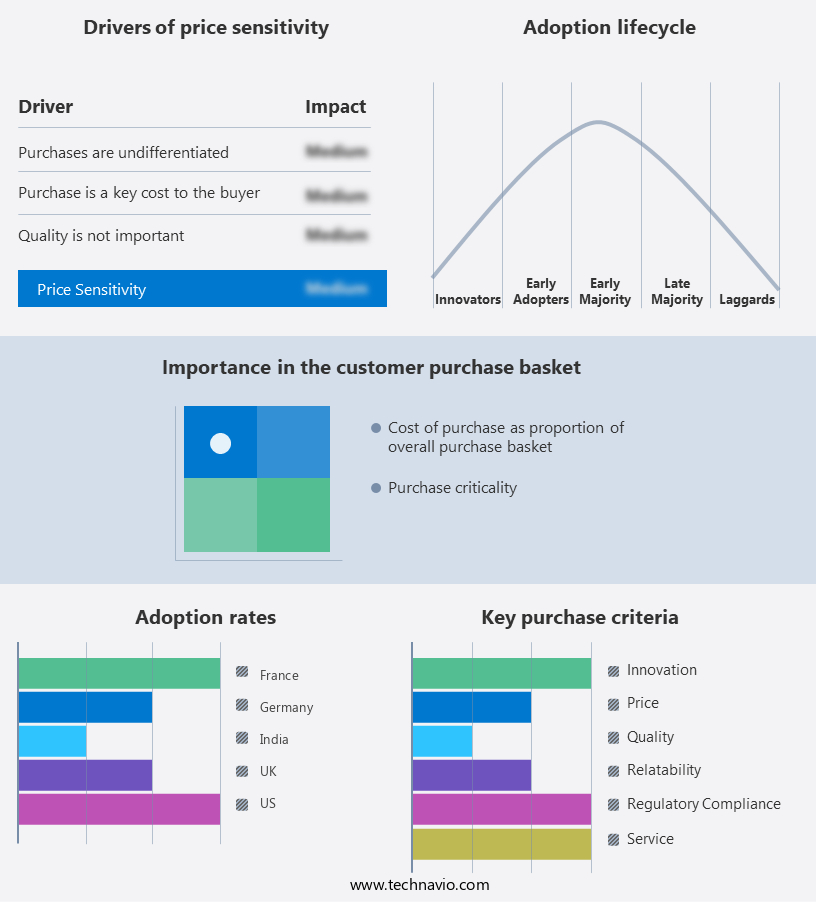
The UPS battery for data center market forecasting report includes the adoption lifecycle of the market, covering from the innovator's stage to the laggard's stage. It focuses on adoption rates in different regions based on penetration. Furthermore, the UPS battery for data center market report also includes key purchase criteria and drivers of price sensitivity to help companies evaluate and develop their market growth analysis strategies.
Customer Landscape
Key Companies & Market Insights
Companies are implementing various strategies, such as strategic alliances, ups battery for data center market forecast, partnerships, mergers and acquisitions, geographical expansion, and product/service launches, to enhance their presence in the industry.
Amara Raja Group - The company provides UPS battery solutions for data centers via PowerStack, Amaron Quanta, Amaron Quanta HWS, and Amaron Quanta Sxel brands.
The industry research and growth report includes detailed analyses of the competitive landscape of the market and information about key companies, including:
- Amara Raja Group
- C and D Technologies Inc.
- Chaowei Power Holdings Ltd.
- Delta Electronics Inc.
- EaglePicher Technologies LLC
- East Penn Manufacturing Co. Inc.
- Eaton Corp. plc
- EnerSys
- ETERNITY TECHNOLOGIES FZ LLC
- EverExceed Corp.
- Exide Industries Ltd.
- FIAMM Energy Technology Spa
- First National Battery
- Fullriver Battery
- GS Yuasa International Ltd.
- HBL Power Systems Ltd.
- Kokam Co. Ltd.
- Schneider Electric SE
- TotalEnergies SE
- Vertiv Holdings Co.
Qualitative and quantitative analysis of companies has been conducted to help clients understand the wider business environment as well as the strengths and weaknesses of key industry players. Data is qualitatively analyzed to categorize companies as pure play, category-focused, industry-focused, and diversified; it is quantitatively analyzed to categorize companies as dominant, leading, strong, tentative, and weak.
Recent Development and News in UPS Battery For Data Center Market
- In February 2023, UPS (United Parcel Service), a leading global logistics company, announced the launch of its new UPS Battery as a Service (BaaS) solution for data centers. This innovative offering allows data center operators to lease batteries instead of purchasing them outright, reducing upfront costs and simplifying battery management (UPS Press Release).
- In November 2024, Schneider Electric, a major energy management and automation company, formed a strategic partnership with UPS to integrate UPS's BaaS solution into Schneider Electric's data center offerings. This collaboration aims to provide customers with a comprehensive, end-to-end energy management solution, enhancing efficiency and reliability (Schneider Electric Press Release).
- In March 2025, UPS raised USD 1 billion in funding to expand its advanced battery manufacturing capabilities. This investment will enable UPS to produce more batteries for its BaaS offering and support the growing demand for renewable energy storage in data centers (UPS Securities Filing).
Research Analyst Overview
The UPS battery market for data centers continues to evolve, driven by the ever-increasing demand for reliable power backup and energy storage solutions. Energy storage systems, which include battery management systems, remote monitoring, and cloud computing, play a crucial role in ensuring high availability and preventing power disruptions. Frequency regulation and deep discharge capabilities are essential features for maintaining power stability and optimizing energy usage. Cycle life and fault tolerance are critical factors in determining the overall performance and longevity of ups batteries. Edge computing and energy storage systems enable decentralized processing and power distribution, enhancing the efficiency and resilience of data center infrastructure.
Power distribution, voltage regulation, and surge protection are essential components of uninterruptible power supplies (UPS), ensuring the optimal functioning of critical power systems. The integration of power factor correction and lithium-ion batteries further enhances energy efficiency and reduces the carbon footprint of data centers. The UPS battery market is subject to ongoing market dynamics, with industry standards and advancements in technology shaping the competitive landscape. The market's continuous evolution reflects the dynamic nature of the data center industry and the ever-evolving demands of businesses for reliable, efficient, and sustainable power solutions.
Dive into Technavio's strong research methodology, blending expert interviews, extensive data synthesis, and validated models for unparalleled UPS Battery For Data Center Market insights. See full methodology.
|
Market Scope |
|
|
Report Coverage |
Details |
|
Page number |
241 |
|
Base year |
2024 |
|
Historic period |
2019-2023 |
|
Forecast period |
2025-2029 |
|
Growth momentum & CAGR |
Accelerate at a CAGR of 6.8% |
|
Market growth 2025-2029 |
USD 2.35 billion |
|
Market structure |
Fragmented |
|
YoY growth 2024-2025(%) |
6.4 |
|
Key countries |
US, Canada, China, UK, Japan, India, Germany, France, South Korea, and Italy |
|
Competitive landscape |
Leading Companies, Market Positioning of Companies, Competitive Strategies, and Industry Risks |
What are the Key Data Covered in this UPS Battery For Data Center Market Research and Growth Report?
- CAGR of the UPS Battery For Data Center industry during the forecast period
- Detailed information on factors that will drive the growth and forecasting between 2025 and 2029
- Precise estimation of the size of the market and its contribution of the industry in focus to the parent market
- Accurate predictions about upcoming growth and trends and changes in consumer behaviour
- Growth of the market across North America, Europe, APAC, South America, and Middle East and Africa
- Thorough analysis of the market's competitive landscape and detailed information about companies
- Comprehensive analysis of factors that will challenge the ups battery for data center market growth of industry companies
We can help! Our analysts can customize this ups battery for data center market research report to meet your requirements.
 RIA -
RIA - 
