US Agricultural Machinery Market Analysis US - Size and Forecast 2024-2028

US Agricultural Machinery Market Analysis US - Size and Forecast 2024-2028

Published: Mar 2024 139 Pages SKU: IRTNTR77836

Market Overview at a Glance

$10.17 B
Market Opportunity
6.37%
CAGR
5.06
YoY growth 2023-2024(%)

US Agricultural Machinery Market Size 2024-2028 

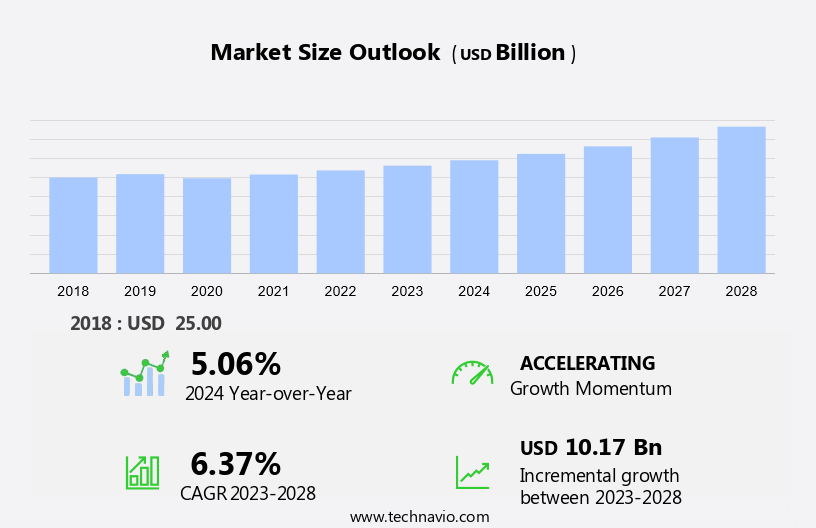
The US agricultural machinery market size is forecast to increase by USD 10.17 billion at a CAGR of 6.37% between 2023 and 2028.

  • The agricultural machinery market in the US is witnessing significant growth due to the increasing adoption of advanced machinery. This trend is driven by the need for higher productivity and efficiency in farming operations. Moreover, the integration of data analytics and artificial intelligence (AI) in agricultural machinery is gaining momentum, enabling farmers to make data-driven decisions and optimize their yields. However, the high initial costs of purchasing and maintaining these advanced machines pose a challenge for small and medium-scale farmers.
  • Moreover, emission regulations, such as TREM Stage-IV, are also influencing the market, pushing manufacturers to develop machines that comply with these standards. The US government's Farm Service Agency's FAME scheme is further encouraging the adoption of bio-diesel and other alternative fuels, which are more environmentally friendly and reduce the carbon footprint of agricultural machinery. Companies like CNH Industrial and JFarm Service are at the forefront of this innovation, offering advanced machinery and services to help farmers optimize their operations and increase their profits.

What will be the size of the market during the forecast period?

Agricultural Machinery Market in US Size

 Request Free Sample

  • The agricultural machinery market in the United States is experiencing significant growth due to several factors. With a focus on enhancing food production to ensure security for the growing population and addressing labor shortages, large-scale farming operations are increasingly relying on mechanization. Arable land in the US is vast, making the efficient use of resources essential. Agricultural machinery plays a crucial role in maximizing productivity on these lands. Mechanization of agriculture has become a necessity for farmers to maintain competitiveness and reduce operational costs. The labor force in the agricultural sector is shrinking, leading to a higher demand for machinery that can perform multiple tasks. Pre-owned agriculture equipment is also gaining popularity due to its affordability and availability. The Inflation Reduction Act, a US legislation, is expected to boost the agriculture machinery market. The act includes provisions for incentives and subsidies for farmers to invest in modern agricultural equipment and technologies. Farmers are turning to rental services like MacAllister Rentals and Farmkart to access the latest machinery without the upfront costs.
  • Moreover, emission regulations, such as Tier 4, are driving the demand for advanced tractor models. The agriculture economy in the US is showing positive signs, with farmers investing in modern machinery to increase yields and reduce operational costs. Agriculture machinery and equipment are becoming essential components of modern farming operations. The US market for agriculture machinery is diverse, with key players like CNH Industrial, Kubota, and others offering a wide range of products. Farmers are increasingly adopting machinery to improve productivity, reduce labor requirements, and ensure optimal use of resources. In conclusion, the agricultural machinery market in the United States is witnessing steady growth due to factors such as the need for food security, labor shortages, and the availability of financing options. The market is expected to continue growing as farmers invest in modern machinery to enhance productivity and reduce operational costs.

How is this market segmented and which is the largest segment?

The market research report provides comprehensive data (region-wise segment analysis), with forecasts and estimates in "USD billion" for the period 2024-2028, as well as historical data from 2018-2022 for the following segments.
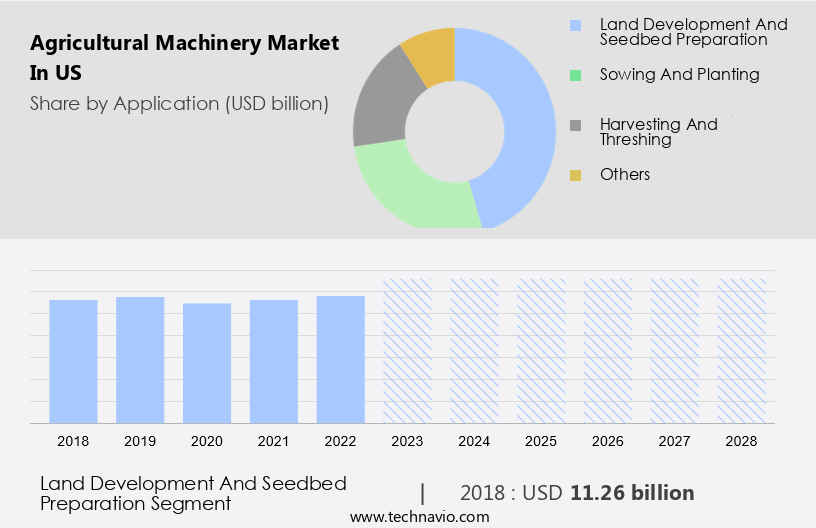
  • Application
    • Land development and seedbed preparation
    • Sowing and planting
    • Harvesting and threshing
    • Others
  • Type
    • Tractors
    • Harvesting
    • Haying machinery
    • Planting and fertilizing machinery
    • Plowing and cultivating machinery
  • Geography
    • US

By Application Insights

  • The land development and seedbed preparation segment is estimated to witness significant growth during the forecast period.

In the United States, the agricultural sector has seen an expansion in farm sizes due to various factors, including economies of scale and consolidation among farmers. To effectively manage larger acreages, farmers rely on advanced agricultural equipment for land development and seedbed preparation. The agriculture industry is continuously striving to enhance yields and optimize land utilization. Agricultural machinery is a vital component in the preparation of land for intensive farming practices, such as precision agriculture, high-density planting, and controlled-environment cultivation.

Moreover, innovations in agricultural machinery, including GPS guidance systems, automated steering, variable rate technology, and precision planting equipment, have significantly improved the efficiency and accuracy of land development and seedbed preparation processes. This, in turn, has led to a growing demand for sophisticated agricultural equipment among farmers.

Agricultural Machinery Market in US Size

Get a glance at the market share of various segments Request Free Sample

The land development and seedbed preparation segment was valued at  USD 11.26 billion in 2018 and showed a gradual increase during the forecast period.

Market Dynamics

Our researchers analyzed the data with 2023 as the base year, along with the key drivers, trends, and challenges. A holistic analysis of drivers will help companies refine their marketing strategies to gain a competitive advantage.

What are the key market drivers leading to the rise in adoption of US Agricultural Machinery Market?

Rising adoption of advanced agricultural machinery is the key driver of the market.

  • In the United States, the agricultural machinery market is witnessing significant growth due to the increasing focus on food security and the need to maximize productivity on arable land. Large-scale farming operations are turning to mechanization to address labor force challenges and improve efficiency. Advanced agricultural machinery is playing a pivotal role in this transition, with technologies such as GPS guidance systems, precision farming tools, telematics, and automation solutions becoming increasingly common. These innovations enable farmers to optimize resource usage and enhance operational efficiency, leading to higher yields, improved resource utilization, and reduced environmental impact. CNH Industrial and other key players in the market are at the forefront of providing farmers with these advanced solutions.
  • Moreover, by utilizing data-driven insights and real-time monitoring, farmers can make informed decisions regarding crop management, resulting in more effective use of inputs and improved overall farm performance. This trend is expected to continue as the agricultural industry continues to prioritize food security and productivity. 

What are the market trends shaping the US Agricultural Machinery Market?

The rising integration of data analytics and artificial intelligence with agricultural machinery is the upcoming trend in the market.

  • In the agricultural sector of the United States, the implementation of advanced technologies, such as data analytics and artificial intelligence (AI), is revolutionizing farming practices. Farmkart, among other key players, is equipping agricultural machinery with sensors, GPS technology, and AI algorithms to collect and analyze data in real-time. This data enables farmers to make informed decisions regarding planting, fertilizer application, irrigation, and pest management. The Farming community in the US is increasingly adopting data-driven approaches to optimize crop yields and profitability. Emission regulations, such as TREM Stage-IV, are driving the demand for advanced agricultural machinery. Furthermore, government initiatives like the FAME scheme are encouraging the adoption of AI and data analytics in agriculture.
  • Moreover, JFarm Service, CNH Industrial, and other industry leaders are integrating AI and data analytics into their offerings to cater to the evolving needs of farmers. By analyzing historical data and monitoring current conditions, farmers can identify factors that impact productivity, such as soil quality, moisture levels, and weather patterns. This information allows farmers to adjust their cultivation practices and inputs to maximize yield potential and profitability. In conclusion, the integration of data analytics and AI in agricultural machinery is transforming farming practices in the US. This technology empowers farmers with actionable insights, enabling them to make data-driven decisions and optimize crop yields. Emission regulations and government initiatives are fueling the demand for advanced agricultural machinery, and industry leaders are responding by integrating AI and data analytics into their offerings.

What challenges does US Agricultural Machinery Market face during the growth?

High initial costs of agricultural machinery are key challenges affecting the market growth.

  • The agricultural machinery market in the US faces a challenge due to the significant expense of equipment, particularly tractors, which can hinder small to medium-sized farmers' ability to invest. Tractor costs in the US range from USD30,000 to USD150,000, depending on factors like size, horsepower, features, and brand. This financial barrier limits farmers' access to modern mechanized farming machinery and technologies, impeding their adoption and market expansion. Moreover, ongoing expenses, such as fuel, maintenance, and repairs, add to the financial burden of owning and operating advanced agricultural machinery.
  • Moreover, major agricultural machinery manufacturers, such as Kubota and Claas Group, offer financing and rental options through partners like MacAllister Rentals to help farmers manage costs. In the US, initiatives like the Inflaation Reduction Act may provide financial assistance to farmers to invest in new machinery. Additionally, organizations like KhetiGaadi and etHekwini Municipality in other regions offer affordable machinery solutions and financing options. By exploring these resources, farmers can invest in modern agricultural machinery and technologies, improving their productivity and competitiveness.

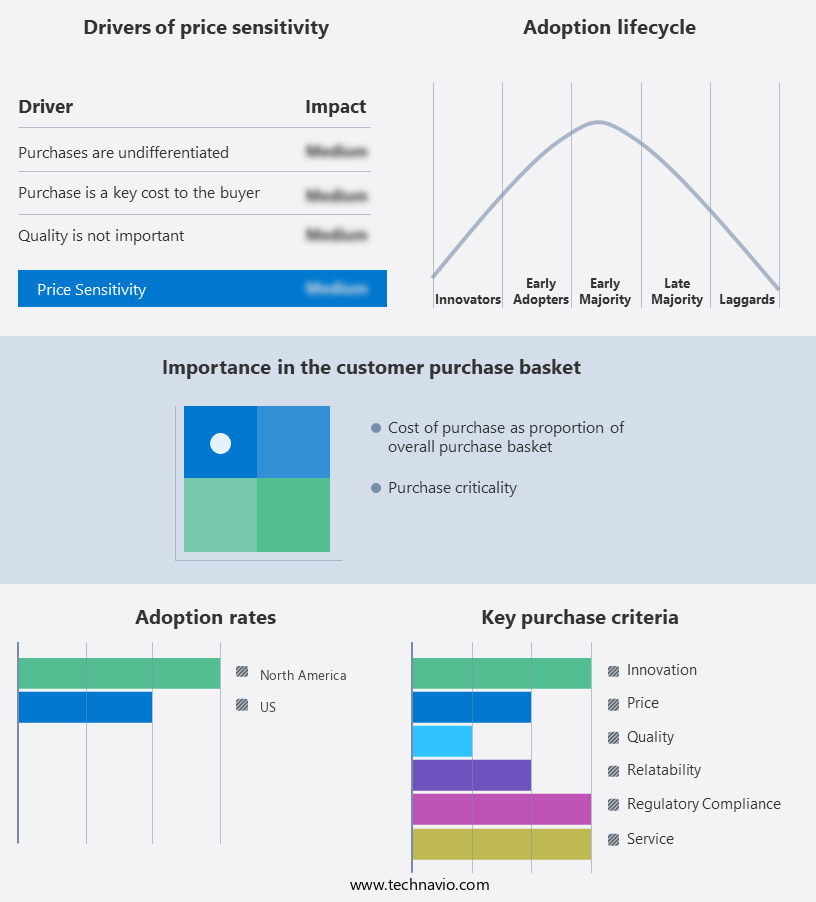
Exclusive US Agricultural Machinery Market Customer Landscape

The market forecasting report includes the adoption lifecycle of the market, covering from the innovator's stage to the laggard's stage. It focuses on adoption rates in different regions based on penetration. Furthermore, the report also includes key purchase criteria and drivers of price sensitivity to help companies evaluate and develop their market growth analysis strategies.

Agricultural Machinery Market in US Share by Geography

 Customer Landscape

Key Companies & Market Insights

Companies are implementing various strategies, such as strategic alliances, market forecast partnerships, mergers and acquisitions, geographical expansion, and product/service launches, to enhance their presence in the market. The market research and growth report includes detailed analyses of the competitive landscape of the market and information about key companies, including:

  • AGCO Corp.
  • Caterpillar Inc.
  • CLAAS KGaA mBH
  • CNH Industrial N.V.
  • Daedong Corp.
  • Deere and Co.
  • Doosan Corp.
  • HORSCH Maschinen GmbH
  • J C Bamford Excavators Ltd.
  • Kinze Manufacturing Inc.
  • Kubota Corp.
  • LS Tractor USA
  • Mahindra and Mahindra Ltd.
  • The New York Blower Co.
  • Vermeer Corp.
  • Yanmar Holdings Co. Ltd.
  • Zetor North America
  • EQUIPMENT TECHNOLOGIES INC.
  • GVM Inc.

Qualitative and quantitative analysis of companies has been conducted to help clients understand the wider business environment as well as the strengths and weaknesses of key market players. Data is qualitatively analyzed to categorize companies as pure play, category-focused, industry-focused, and diversified; it is quantitatively analyzed to categorize companies as dominant, leading, strong, tentative, and weak.

Research Analyst Overview

The agricultural machinery market in the US is experiencing significant growth due to the increasing focus on large-scale farming and mechanization to enhance productivity and ensure food security on arable land. The labor force in agriculture is shrinking, leading farmers to adopt advanced machinery and equipment to reduce manual labor requirements. CNH Industrial, Kubota, and Claas Group are major players in the market, offering a range of tractors and farm mechanization solutions. The Inflation Reduction Act and the Farm Bill have provided incentives for farmers to invest in precision agriculture, IoT applications, GPS solutions, and AI-based equipment. Pre-owned agriculture equipment is also gaining popularity due to its affordability.

In summary, emission regulations, such as Tier 4, are driving the demand for advanced machinery and equipment. Precision farming, farm service agencies, and JFarm Service are key players in the agriculture economy, offering services and solutions to farmers. The economic survey reveals that the agriculture machinery and equipment sector contributes significantly to the Gross Domestic Product. Farmkart, Macallister Rentals, Khetigaadi, and Ethekwini Municipality are other notable players in the market.

Market Scope

Report Coverage

Details

Page number

139

Base year

2023

Historic period

2018-2022

Forecast period

2024-2028

Growth momentum & CAGR

Accelerate at a CAGR of 6.37%

Market growth 2024-2028

USD 10.17 billion

Market structure

Fragmented

YoY growth 2023-2024(%)

5.06

Competitive landscape

Leading Companies, Market Positioning of Companies, Competitive Strategies, and Industry Risks

Request Free Sample

What are the Key Data Covered in this Market Research Report?

  • CAGR of the market during the forecast period
  • Detailed information on factors that will drive the market growth and forecasting between 2024 and 2028
  • Precise estimation of the size of the market  and its contribution of the market in focus to the parent market
  • Accurate predictions about upcoming market growth and trends and changes in consumer behaviour
  • Growth of the market across US
  • Thorough analysis of the market's competitive landscape and detailed information about companies
  • Comprehensive analysis of factors that will challenge the growth of market companies

We can help! Our analysts can customize this market research report to meet your requirements Get in touch

1 Executive Summary

  • 1.1 Market overview
    • Exhibit 01: Executive Summary – Chart on Market Overview
    • Exhibit 02: Executive Summary – Data Table on Market Overview
    • Exhibit 03: Executive Summary – Chart on Country Market Characteristics
    • Exhibit 04: Executive Summary – Chart on Market Segmentation by Application
    • Exhibit 05: Executive Summary – Chart on Market Segmentation by Type
    • Exhibit 06: Executive Summary – Chart on Vendor Market Positioning

2 Market Landscape

  • 2.1 Market ecosystem
    • Exhibit 07: Parent market
    • Exhibit 08: Market Characteristics

3 Market Sizing

  • 3.1 Market definition
    • Exhibit 09: Offerings of vendors included in the market definition
  • 3.2 Market segment analysis
    • Exhibit 10: Market segments
  • 3.3 Market size 2023
    • 3.4 Market outlook: Forecast for 2023-2028
      • Exhibit 11: Chart on US - Market size and forecast 2023-2028 ($ billion)
      • Exhibit 12: Data Table on US - Market size and forecast 2023-2028 ($ billion)
      • Exhibit 13: Chart on US: Year-over-year growth 2023-2028 (%)
      • Exhibit 14: Data Table on US: Year-over-year growth 2023-2028 (%)

    4 Historic Market Size

    • 4.1 Agricultural machinery market in US 2018 - 2022
      • Exhibit 15: Historic Market Size – Data Table on agricultural machinery market in US 2018 - 2022 ($ billion)
    • 4.2 Application Segment Analysis 2018 - 2022
      • Exhibit 16: Historic Market Size – Application Segment 2018 - 2022 ($ billion)
    • 4.3 Type Segment Analysis 2018 - 2022
      • Exhibit 17: Historic Market Size – Type Segment 2018 - 2022 ($ billion)

    5 Five Forces Analysis

    • 5.1 Five forces summary
      • Exhibit 18: Five forces analysis - Comparison between 2023 and 2028
    • 5.2 Bargaining power of buyers
      • Exhibit 19: Chart on Bargaining power of buyers – Impact of key factors 2023 and 2028
    • 5.3 Bargaining power of suppliers
      • Exhibit 20: Bargaining power of suppliers – Impact of key factors in 2023 and 2028
    • 5.4 Threat of new entrants
      • Exhibit 21: Threat of new entrants – Impact of key factors in 2023 and 2028
    • 5.5 Threat of substitutes
      • Exhibit 22: Threat of substitutes – Impact of key factors in 2023 and 2028
    • 5.6 Threat of rivalry
      • Exhibit 23: Threat of rivalry – Impact of key factors in 2023 and 2028
    • 5.7 Market condition
      • Exhibit 24: Chart on Market condition - Five forces 2023 and 2028

    6 Market Segmentation by Application

    • 6.1 Market segments
      • Exhibit 25: Chart on Application - Market share 2023-2028 (%)
      • Exhibit 26: Data Table on Application - Market share 2023-2028 (%)
    • 6.2 Comparison by Application
      • Exhibit 27: Chart on Comparison by Application
      • Exhibit 28: Data Table on Comparison by Application
    • 6.3 Land development and seedbed preparation - Market size and forecast 2023-2028
      • Exhibit 29: Chart on Land development and seedbed preparation - Market size and forecast 2023-2028 ($ billion)
      • Exhibit 30: Data Table on Land development and seedbed preparation - Market size and forecast 2023-2028 ($ billion)
      • Exhibit 31: Chart on Land development and seedbed preparation - Year-over-year growth 2023-2028 (%)
      • Exhibit 32: Data Table on Land development and seedbed preparation - Year-over-year growth 2023-2028 (%)
    • 6.4 Sowing and planting - Market size and forecast 2023-2028
      • Exhibit 33: Chart on Sowing and planting - Market size and forecast 2023-2028 ($ billion)
      • Exhibit 34: Data Table on Sowing and planting - Market size and forecast 2023-2028 ($ billion)
      • Exhibit 35: Chart on Sowing and planting - Year-over-year growth 2023-2028 (%)
      • Exhibit 36: Data Table on Sowing and planting - Year-over-year growth 2023-2028 (%)
    • 6.5 Harvesting and threshing - Market size and forecast 2023-2028
      • Exhibit 37: Chart on Harvesting and threshing - Market size and forecast 2023-2028 ($ billion)
      • Exhibit 38: Data Table on Harvesting and threshing - Market size and forecast 2023-2028 ($ billion)
      • Exhibit 39: Chart on Harvesting and threshing - Year-over-year growth 2023-2028 (%)
      • Exhibit 40: Data Table on Harvesting and threshing - Year-over-year growth 2023-2028 (%)
    • 6.6 Others - Market size and forecast 2023-2028
      • Exhibit 41: Chart on Others - Market size and forecast 2023-2028 ($ billion)
      • Exhibit 42: Data Table on Others - Market size and forecast 2023-2028 ($ billion)
      • Exhibit 43: Chart on Others - Year-over-year growth 2023-2028 (%)
      • Exhibit 44: Data Table on Others - Year-over-year growth 2023-2028 (%)
    • 6.7 Market opportunity by Application
      • Exhibit 45: Market opportunity by Application ($ billion)
      • Exhibit 46: Data Table on Market opportunity by Application ($ billion)

    7 Market Segmentation by Type

    • 7.1 Market segments
      • Exhibit 47: Chart on Type - Market share 2023-2028 (%)
      • Exhibit 48: Data Table on Type - Market share 2023-2028 (%)
    • 7.2 Comparison by Type
      • Exhibit 49: Chart on Comparison by Type
      • Exhibit 50: Data Table on Comparison by Type
    • 7.3 Tractors - Market size and forecast 2023-2028
      • Exhibit 51: Chart on Tractors - Market size and forecast 2023-2028 ($ billion)
      • Exhibit 52: Data Table on Tractors - Market size and forecast 2023-2028 ($ billion)
      • Exhibit 53: Chart on Tractors - Year-over-year growth 2023-2028 (%)
      • Exhibit 54: Data Table on Tractors - Year-over-year growth 2023-2028 (%)
    • 7.4 Harvesting - Market size and forecast 2023-2028
      • Exhibit 55: Chart on Harvesting - Market size and forecast 2023-2028 ($ billion)
      • Exhibit 56: Data Table on Harvesting - Market size and forecast 2023-2028 ($ billion)
      • Exhibit 57: Chart on Harvesting - Year-over-year growth 2023-2028 (%)
      • Exhibit 58: Data Table on Harvesting - Year-over-year growth 2023-2028 (%)
    • 7.5 Haying machinery - Market size and forecast 2023-2028
      • Exhibit 59: Chart on Haying machinery - Market size and forecast 2023-2028 ($ billion)
      • Exhibit 60: Data Table on Haying machinery - Market size and forecast 2023-2028 ($ billion)
      • Exhibit 61: Chart on Haying machinery - Year-over-year growth 2023-2028 (%)
      • Exhibit 62: Data Table on Haying machinery - Year-over-year growth 2023-2028 (%)
    • 7.6 Planting and fertilizing machinery - Market size and forecast 2023-2028
      • Exhibit 63: Chart on Planting and fertilizing machinery - Market size and forecast 2023-2028 ($ billion)
      • Exhibit 64: Data Table on Planting and fertilizing machinery - Market size and forecast 2023-2028 ($ billion)
      • Exhibit 65: Chart on Planting and fertilizing machinery - Year-over-year growth 2023-2028 (%)
      • Exhibit 66: Data Table on Planting and fertilizing machinery - Year-over-year growth 2023-2028 (%)
    • 7.7 Plowing and cultivating machinery - Market size and forecast 2023-2028
      • Exhibit 67: Chart on Plowing and cultivating machinery - Market size and forecast 2023-2028 ($ billion)
      • Exhibit 68: Data Table on Plowing and cultivating machinery - Market size and forecast 2023-2028 ($ billion)
      • Exhibit 69: Chart on Plowing and cultivating machinery - Year-over-year growth 2023-2028 (%)
      • Exhibit 70: Data Table on Plowing and cultivating machinery - Year-over-year growth 2023-2028 (%)
    • 7.8 Market opportunity by Type
      • Exhibit 71: Market opportunity by Type ($ billion)
      • Exhibit 72: Data Table on Market opportunity by Type ($ billion)

    8 Customer Landscape

    • 8.1 Customer landscape overview
      • Exhibit 73: Analysis of price sensitivity, lifecycle, customer purchase basket, adoption rates, and purchase criteria

    9 Drivers, Challenges, and Trends

    • 9.1 Market drivers
      • 9.2 Market challenges
        • 9.3 Impact of drivers and challenges
          • Exhibit 74: Impact of drivers and challenges in 2023 and 2028
        • 9.4 Market trends

          10 Vendor Landscape

          • 10.1 Overview
            • 10.2 Vendor landscape
              • Exhibit 75: Overview on Criticality of inputs and Factors of differentiation
            • 10.3 Landscape disruption
              • Exhibit 76: Overview on factors of disruption
            • 10.4 Industry risks
              • Exhibit 77: Impact of key risks on business

            11 Vendor Analysis

            • 11.1 Vendors covered
              • Exhibit 78: Vendors covered
            • 11.2 Market positioning of vendors
              • Exhibit 79: Matrix on vendor position and classification
            • 11.3 AGCO Corp.
              • Exhibit 80: AGCO Corp. - Overview
              • Exhibit 81: AGCO Corp. - Business segments
              • Exhibit 82: AGCO Corp. - Key news
              • Exhibit 83: AGCO Corp. - Key offerings
              • Exhibit 84: AGCO Corp. - Segment focus
            • 11.4 Caterpillar Inc.
              • Exhibit 85: Caterpillar Inc. - Overview
              • Exhibit 86: Caterpillar Inc. - Business segments
              • Exhibit 87: Caterpillar Inc. - Key news
              • Exhibit 88: Caterpillar Inc. - Key offerings
              • Exhibit 89: Caterpillar Inc. - Segment focus
            • 11.5 CLAAS KGaA mBH
              • Exhibit 90: CLAAS KGaA mBH - Overview
              • Exhibit 91: CLAAS KGaA mBH - Product / Service
              • Exhibit 92: CLAAS KGaA mBH - Key offerings
            • 11.6 CNH Industrial N.V.
              • Exhibit 93: CNH Industrial N.V. - Overview
              • Exhibit 94: CNH Industrial N.V. - Product / Service
              • Exhibit 95: CNH Industrial N.V. - Key news
              • Exhibit 96: CNH Industrial N.V. - Key offerings
            • 11.7 Daedong Corp.
              • Exhibit 97: Daedong Corp. - Overview
              • Exhibit 98: Daedong Corp. - Product / Service
              • Exhibit 99: Daedong Corp. - Key news
              • Exhibit 100: Daedong Corp. - Key offerings
            • 11.8 Deere and Co.
              • Exhibit 101: Deere and Co. - Overview
              • Exhibit 102: Deere and Co. - Business segments
              • Exhibit 103: Deere and Co. - Key offerings
              • Exhibit 104: Deere and Co. - Segment focus
            • 11.9 Doosan Corp.
              • Exhibit 105: Doosan Corp. - Overview
              • Exhibit 106: Doosan Corp. - Business segments
              • Exhibit 107: Doosan Corp. - Key offerings
              • Exhibit 108: Doosan Corp. - Segment focus
            • 11.10 EQUIPMENT TECHNOLOGIES INC.
              • Exhibit 109: EQUIPMENT TECHNOLOGIES INC. - Overview
              • Exhibit 110: EQUIPMENT TECHNOLOGIES INC. - Product / Service
              • Exhibit 111: EQUIPMENT TECHNOLOGIES INC. - Key offerings
            • 11.11 GVM Inc.
              • Exhibit 112: GVM Inc. - Overview
              • Exhibit 113: GVM Inc. - Product / Service
              • Exhibit 114: GVM Inc. - Key offerings
            • 11.12 J C Bamford Excavators Ltd.
              • Exhibit 115: J C Bamford Excavators Ltd. - Overview
              • Exhibit 116: J C Bamford Excavators Ltd. - Product / Service
              • Exhibit 117: J C Bamford Excavators Ltd. - Key news
              • Exhibit 118: J C Bamford Excavators Ltd. - Key offerings
            • 11.13 Kinze Manufacturing Inc.
              • Exhibit 119: Kinze Manufacturing Inc. - Overview
              • Exhibit 120: Kinze Manufacturing Inc. - Product / Service
              • Exhibit 121: Kinze Manufacturing Inc. - Key offerings
            • 11.14 Kubota Corp.
              • Exhibit 122: Kubota Corp. - Overview
              • Exhibit 123: Kubota Corp. - Business segments
              • Exhibit 124: Kubota Corp. - Key news
              • Exhibit 125: Kubota Corp. - Key offerings
              • Exhibit 126: Kubota Corp. - Segment focus
            • 11.15 Mahindra and Mahindra Ltd.
              • Exhibit 127: Mahindra and Mahindra Ltd. - Overview
              • Exhibit 128: Mahindra and Mahindra Ltd. - Business segments
              • Exhibit 129: Mahindra and Mahindra Ltd. - Key news
              • Exhibit 130: Mahindra and Mahindra Ltd. - Key offerings
              • Exhibit 131: Mahindra and Mahindra Ltd. - Segment focus
            • 11.16 Vermeer Corp.
              • Exhibit 132: Vermeer Corp. - Overview
              • Exhibit 133: Vermeer Corp. - Product / Service
              • Exhibit 134: Vermeer Corp. - Key offerings
            • 11.17 Yanmar Holdings Co. Ltd.
              • Exhibit 135: Yanmar Holdings Co. Ltd. - Overview
              • Exhibit 136: Yanmar Holdings Co. Ltd. - Product / Service
              • Exhibit 137: Yanmar Holdings Co. Ltd. - Key news
              • Exhibit 138: Yanmar Holdings Co. Ltd. - Key offerings

            12 Appendix

            • 12.1 Scope of the report
              • 12.2 Inclusions and exclusions checklist
                • Exhibit 139: Inclusions checklist
                • Exhibit 140: Exclusions checklist
              • 12.3 Currency conversion rates for US$
                • Exhibit 141: Currency conversion rates for US$
              • 12.4 Research methodology
                • Exhibit 142: Research methodology
                • Exhibit 143: Validation techniques employed for market sizing
                • Exhibit 144: Information sources
              • 12.5 List of abbreviations
                • Exhibit 145: List of abbreviations

              Research Methodology

              Technavio presents a detailed picture of the market by way of study, synthesis, and summation of data from multiple sources. The analysts have presented the various facets of the market with a particular focus on identifying the key industry influencers. The data thus presented is comprehensive, reliable, and the result of extensive research, both primary and secondary.

              INFORMATION SOURCES

              Primary sources

              • Manufacturers and suppliers
              • Channel partners
              • Industry experts
              • Strategic decision makers

              Secondary sources

              • Industry journals and periodicals
              • Government data
              • Financial reports of key industry players
              • Historical data
              • Press releases

              DATA ANALYSIS

              Data Synthesis

              • Collation of data
              • Estimation of key figures
              • Analysis of derived insights

              Data Validation

              • Triangulation with data models
              • Reference against proprietary databases
              • Corroboration with industry experts

              REPORT WRITING

              Qualitative

              • Market drivers
              • Market challenges
              • Market trends
              • Five forces analysis

              Quantitative

              • Market size and forecast
              • Market segmentation
              • Geographical insights
              • Competitive landscape

              Interested in this report?

              Get your sample now to see our research methodology and insights!

              Download Now

              Frequently Asked Questions

              Agricultural Machineryin US market growth will increase by $ 10.17 bn during 2024-2028 .

              The Agricultural Machineryin US market is expected to grow at a CAGR of 6.37% during 2024-2028 .

              Agricultural Machineryin US market is segmented by Application( Land development and seedbed preparation, Sowing and planting, Harvesting and threshing, Others) Type( Tractors, Harvesting, Haying machinery, Planting and fertilizing machinery, Plowing and cultivating machinery)

              AGCO Corp., Caterpillar Inc., CLAAS KGaA mBH, CNH Industrial N.V., Daedong Corp., Deere and Co., Doosan Corp., HORSCH Maschinen GmbH, J C Bamford Excavators Ltd., Kinze Manufacturing Inc., Kubota Corp., LS Tractor USA, Mahindra and Mahindra Ltd., The New York Blower Co., Vermeer Corp., Yanmar Holdings Co. Ltd., Zetor North America, EQUIPMENT TECHNOLOGIES INC., GVM Inc. are a few of the key vendors in the Agricultural Machineryin US market.

              North America will register the highest growth rate of 100% among the other regions. Therefore, the Agricultural Machineryin US market in North America is expected to garner significant business opportunities for the vendors during the forecast period.

              US, North America

              • Rising adoption of advanced agricultural machineryAdvanced agricultural machinery is equipped with cutting-edge technologies such as GPS guidance systems is the driving factor this market.
              • precision farming tools is the driving factor this market.
              • telematics is the driving factor this market.
              • and automation solutions. These technologies enable farmers to optimize inputs is the driving factor this market.
              • enhance operational efficiency is the driving factor this market.
              • and improve yield by precisely managing field operations such as planting is the driving factor this market.
              • Applying fertilizers is the driving factor this market.
              • spraying is the driving factor this market.
              • and harvesting. Precision farming techniques is the driving factor this market.
              • enabled by the use of advanced agricultural machinery is the driving factor this market.
              • allow farmers to monitor and manage crop variability within fields more effectively. By using data-driven insights and real-time monitoring is the driving factor this market.
              • farmers can make informed decisions regarding seed placement is the driving factor this market.
              • irrigation is the driving factor this market.
              • fertilizer application is the driving factor this market.
              • and crop protection is the driving factor this market.
              • resulting in higher yields is the driving factor this market.
              • improved resource utilization is the driving factor this market.
              • and reduced environmental impact. Moreover is the driving factor this market.
              • advanced agricultural machinery offers increased efficiency and productivity is the driving factor this market.
              • allowing farmers to accomplish more work in less time. Agricultural machinery with higher horsepower is the driving factor this market.
              • wider working widths is the driving factor this market.
              • and greater capacity enables farmers to cover larger acreages efficiently is the driving factor this market.
              • reducing manpower requirements and operating costs while maximizing output. Moreover is the driving factor this market.
              • connectivity features integrated into modern agricultural machinery enable seamless data exchange between different machines is the driving factor this market.
              • farm management software is the driving factor this market.
              • and other digital platforms. This connectivity facilitates data-driven decision-making is the driving factor this market.
              • remote monitoring of agricultural land and operations is the driving factor this market.
              • predictive maintenance is the driving factor this market.
              • and precision agriculture applications is the driving factor this market.
              • improving overall farm management and performance. The adoption of advanced agricultural machinery contributes to improved crop quality is the driving factor this market.
              • uniformity is the driving factor this market.
              • and yield by ensuring precise planting is the driving factor this market.
              • optimal nutrient and fertilizer application is the driving factor this market.
              • timely harvesting is the driving factor this market.
              • and efficient handling of post-harvest activities. Enhanced crop management practices enabled by advanced agricultural machinery help farmers achieve higher-quality agricultural produce. Furthermore is the driving factor this market.
              • advanced agricultural machinery supports sustainable farming practices by enabling farmers to implement soil conservation measures is the driving factor this market.
              • reduce the use of chemical inputs is the driving factor this market.
              • and minimize the environmental impact. Precision farming technologies and equipment optimization tools help farmers use resources more efficiently is the driving factor this market.
              • minimize soil erosion is the driving factor this market.
              • conserve water is the driving factor this market.
              • and reduce greenhouse gas emissions is the driving factor this market.
              • contributing to environmental sustainability. Thus is the driving factor this market.
              • the rising adoption of advanced agricultural machinery will propel the growth of the agricultural machinery market in US during the forecast period. is the driving factor this market.

              The Agricultural Machineryin US market vendors should focus on grabbing business opportunities from the Land development and seedbed preparation segment as it accounted for the largest market share in the base year.