
US Cheese Market Size 2025-2029
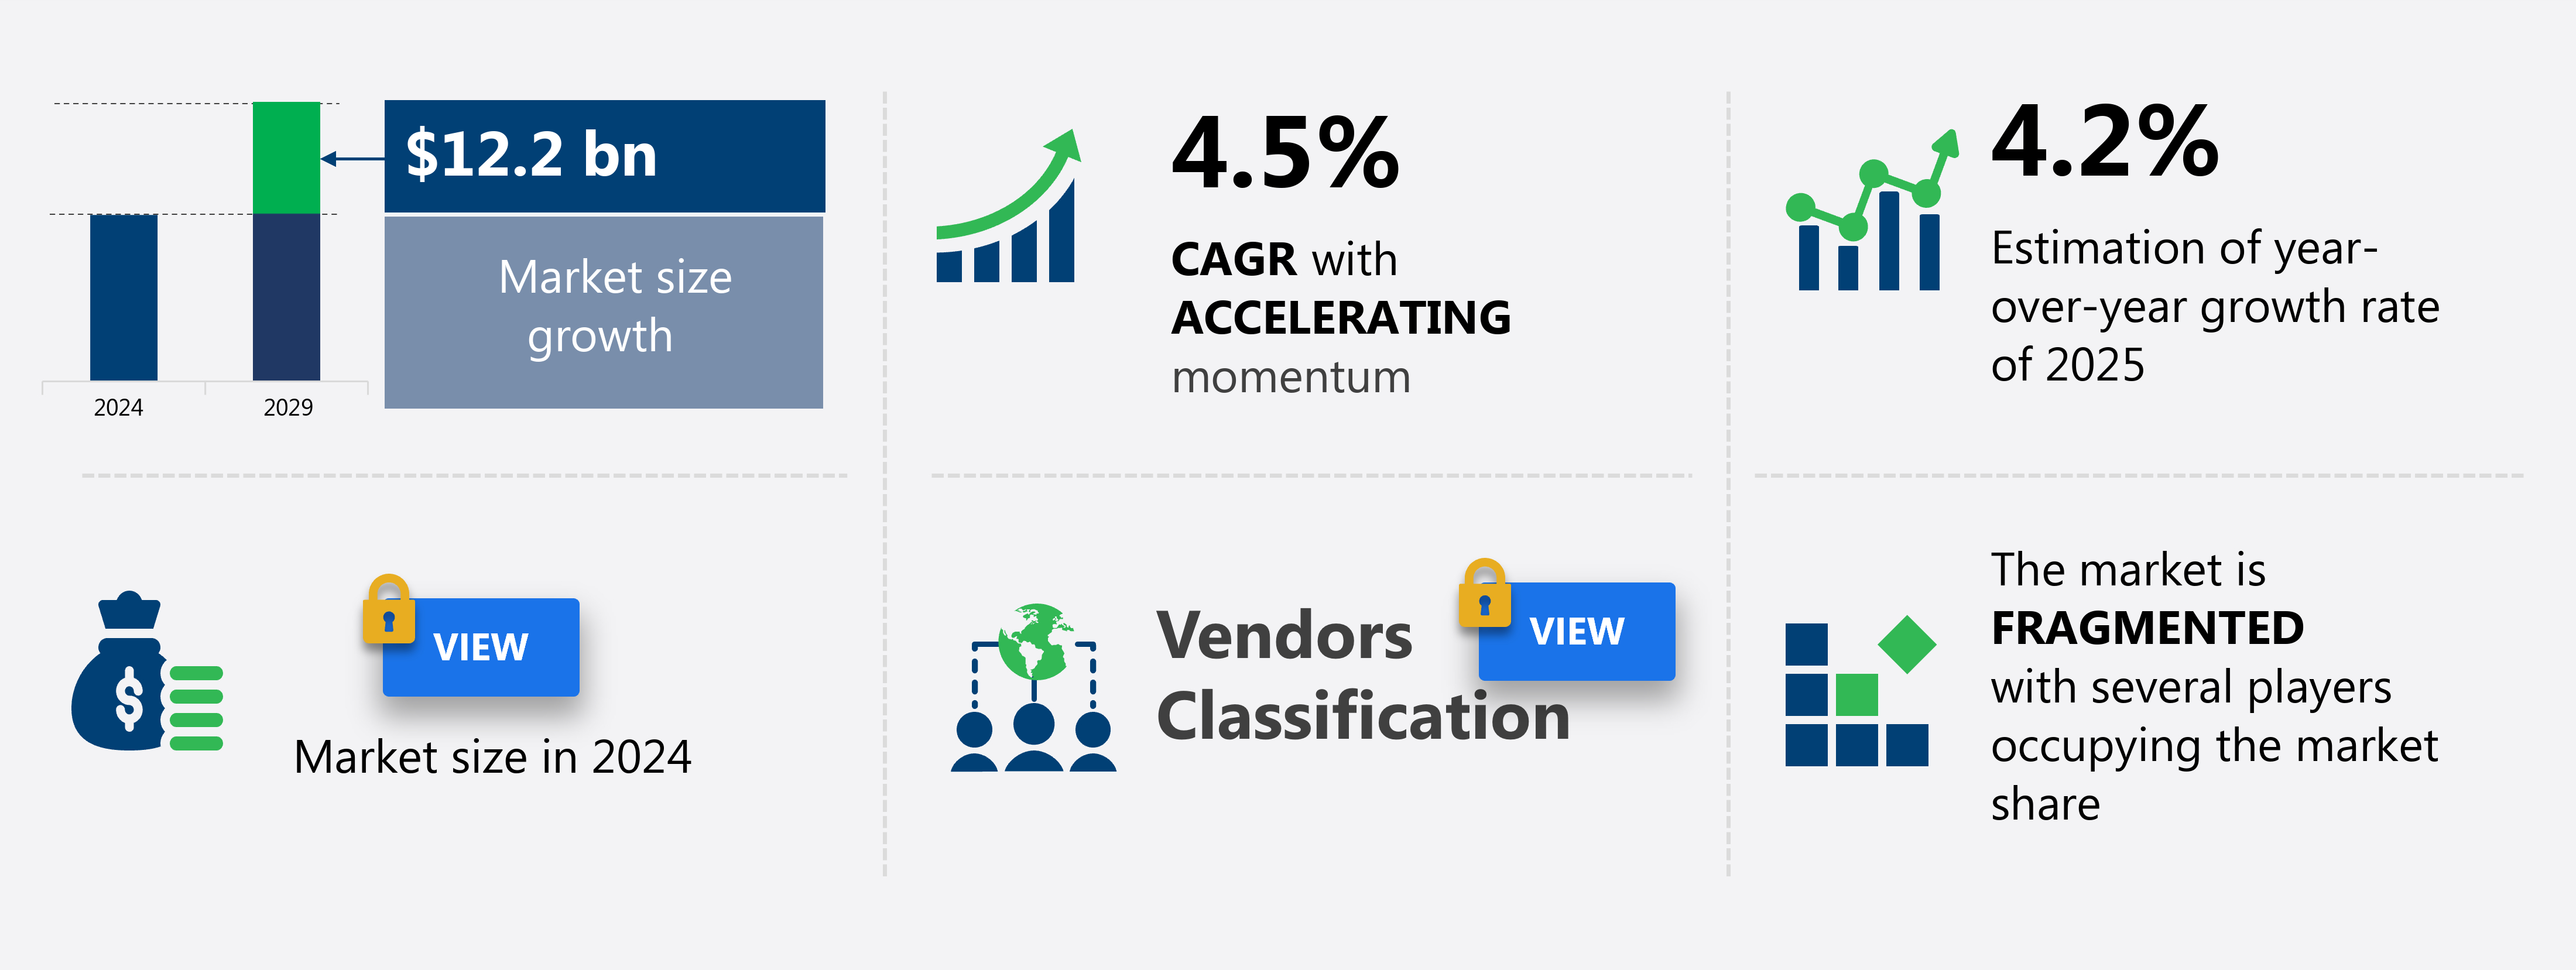
The cheese market size in US is forecast to increase by USD 12.2 billion at a CAGR of 4.5% between 2024 and 2029.
-
The cheese market is experiencing significant growth, driven by the increasing consumer demand for diverse and high-quality cheese products. This trend is fueled by the expanding foodservice industry and the rise of online retailing, making cheese more accessible than ever before. However, the market also faces challenges related to health concerns, as some types of cheese are high in saturated fat and sodium. Additionally, the food service industry's growing focus on offering healthier options has led to an increase in demand for cheese in sandwiches and pizzas.
-
Consumers are becoming more health-conscious and are seeking out lower-fat and lactose-free options. Consumer preferences for sustainable and ethically sourced options have fueled the growth of dairy alternatives, with sustainability initiatives and fair trade certifications becoming increasingly important. Navigating this complex market landscape requires a deep understanding of consumer preferences, competitive dynamics, and regulatory requirements. Stay informed to capitalize on opportunities and mitigate risks in the dynamic cheese market.
What will be the Size of the market During the Forecast Period?
The cheese market encompasses a diverse range of products, from traditional dairy offerings to plant-based alternatives such as vegan cashew cheese and soy cheese. Price elasticity plays a significant role in the market, as consumers balance their desire for high-quality cheese spreads and snacks with concerns over cost. Spoilage organisms and foodborne illness are ongoing challenges for cheese producers, necessitating rigorous quality assurance measures and traceability systems. Automation in cheesemaking and inventory management have streamlined production processes, reducing waste and improving carbon footprint. Additionally, some cheese varieties, like organic and pasteurized cheese, use modified atmosphere packaging to minimize oxidation and preserve nutritional value.
Cheese's cultural significance extends beyond food applications, with culinary uses including wine pairing and cheese sauces. Regional cheese varieties and cheese blends offer unique culinary experiences, while brand loyalty is a key factor in consumer decision-making. Environmental impact and sustainability are key considerations in cheese production technology, with a focus on reducing waste and improving ingredient sourcing. Nutritional yeast and cheese substitutes cater to consumers seeking alternative sources of protein and nutrients. Cheese microbiology and food microbiology are essential fields in ensuring the safety and quality of cheese products. Pricing strategies and supply chain management are critical components of market success, with cheese pairing and culinary uses offering opportunities for differentiation and innovation.
How is this market segmented and which is the largest segment?
The market research report provides comprehensive data (region-wise segment analysis), with forecasts and estimates in "USD billion" for the period 2025-2029, as well as historical data from 2019-2023 for the following segments.
- Source
- Animal-based
- Plant-based
- Distribution Channel
- Offline
- Online
- Product Type
- Mozzarella
- Cheddar
- Specialty cheeses
- Plant-based cheese
- Geography
- North America
- US
- North America
By Source Insights
The Animal-based segment is estimated to witness significant growth during the forecast period. The creamy and versatile animal-based cheese segment, primarily sourced from cows' milk, holds a significant share in the US cheese market. Cows' milk cheese, recognized for its creamy texture and vast flavor profiles, includes popular varieties such as cheddar, mozzarella, Swiss, and gouda. Cow milk, which makes up the largest portion of global milk production, is expected to reach approximately 228 billion pounds by 2025. This growth is driven by an expanding dairy herd and increased milk yield per cow. The consistent milk supply ensures a stable cheese manufacturing environment, enabling producers to maintain steady production volumes and pricing strategies.
Food service is a significant market for cheese, with standardized milk and pasteurized cheese being the preferred choices due to their consistent quality and long shelf life. Unpasteurized cheese, with its unique flavor and texture, is gaining popularity in specialty markets. Cheese additives, such as salt, are used to enhance flavor and improve texture, while aging processes contribute to the development of distinct flavors and textures in hard and semi-hard cheeses. Additionally, the food service industry's growing focus on offering healthier options has led to an increase in demand for cheese in sandwiches and pizzas. Cheese blocks, sliced cheese, and shredded cheese cater to various consumer preferences and applications. Food safety regulations guide the cheesemaking process, ensuring the production of safe and high-quality cheese.
Cheese curds, a fresh and unaged cheese, are gaining popularity due to their unique texture and taste. Lactose intolerance has led to the growth of lactose-free and lactose-reduced cheese options. Processed cheese, with its long shelf life and versatility, is widely used in foodservice and retail applications. Blue cheese, with its distinct flavor and pungent aroma, is a niche market catering to specific consumer preferences. Domestic and imported cheeses coexist in the market, with imported cheese offering unique flavor profiles and diverse textures. Cheese distribution channels include direct sales, retail, and foodservice. Packaging materials, such as vacuum packaging and modified atmosphere packaging, extend the shelf life of cheese and maintain its freshness.
Specialty cheeses, including goat cheese, artisan cheese, and organic cheese, cater to consumers seeking unique and high-quality cheese options. Monterey jack, American cheese, and pepper jack are popular cheese varieties with a wide consumer base. Cheese wheels, fresh cheese, and aged cheese each offer distinct textures and flavors, appealing to various consumer preferences. Texture profiles, from creamy to crumbly, contribute to the diverse range of cheese offerings. Nutritional information, including fat content, milkfat content, protein content, and sodium content, is increasingly important to consumers. Calorie content and pH level are also factors influencing consumer choices. Cheese's versatility and evolving consumer preferences continue to drive market growth and innovation.

Get a glance at the market report of share of various segments Request Free Sample
Market Dynamics
Our US Cheese Market researchers analyzed the data with 2024 as the base year, along with the key drivers, trends, and challenges. A holistic analysis of drivers will help companies refine their marketing strategies to gain a competitive advantage.
What are the key market drivers leading to the rise in adoption of US Cheese Market?
-
Increasing consumer demand for cheese products is the key driver of the market. Cheese is a beloved food staple in many households, appreciated for its diverse forms and rich flavor profiles. In the US market, sliced, shredded, and grated cheeses are increasingly popular for their versatility in various dishes, from sandwiches to pizzas and pastas. The growing demand for cheese can be attributed to its indulgent taste, which enhances the flavors of different meals. Cheese offers a creamy and savory texture that is both appealing and satisfying to consumers. Moreover, its long shelf life, achieved through techniques like vacuum packaging and careful cheesemaking, ensures its availability for extended periods.
-
Cheese comes in various forms, including hard and semi-hard cheeses, each with unique characteristics and lactose content. Imported cheeses also contribute to the market's diversity, offering consumers a range of flavors and textures. The cheese industry continues to innovate, with ongoing research and development in cheesemaking techniques, whey separation, and other processes to meet the evolving needs and preferences of consumers. The market for cheese is subject to rigorous food safety regulations, ensuring the highest standards of quality and safety. Cheese is a significant contributor to the dairy-based sources segment, providing essential nutrients such as protein, calcium, phosphorus, zinc, vitamins, and other health benefits.
What are the market trends shaping the US Cheese Market?
-
Growth of online retailing is the upcoming trend in the market. The cheese market in the US has experienced significant growth due to the increasing popularity of online shopping. Consumers' preference for convenience, attractive pricing, and personalized product offers has driven the demand for cheese products online. This trend has opened new opportunities for manufacturers and distributors to expand their reach and improve customer relationships. Having an online presence allows for increased product visibility and exploration of new markets. Cheese varieties such as Monterey Jack, Pepper Jack, and artisan cheeses continue to gain popularity.
-
The calorie content of cheese varies widely, making it essential for manufacturers to provide accurate and transparent nutritional information. In the cheese market, aged cheese remains a staple, while fresh cheese continues to gain traction. Export markets also present significant opportunities for growth, with sensory evaluation playing a critical role in meeting international standards. Overall, the cheese market in the US is dynamic and evolving, with a focus on innovation, quality, and customer satisfaction. Sensory evaluation plays a crucial role in the cheese market, with texture profiles and pH levels being key factors in determining quality. Western cuisines, particularly Italian and Mexican, dominate cheese consumption due to their extensive use in traditional dishes like pizza and tacos.
What challenges does US Cheese Market face during the growth?
-
Several health issues associated with cheese consumption is a key challenge affecting the market growth. Cheese, a beloved dairy product, faces health-related challenges, impacting both consumers and the industry. The primary concern is the high saturated fat content in cheese, contributing to increased cholesterol levels, heart disease, obesity, and other health issues. Unchecked consumption of high-fat cheeses can negatively affect cardiovascular health. Another health concern is lactose intolerance, which affects many people's ability to digest lactose, the natural sugar in milk and dairy products. Symptoms of lactose intolerance include bloating, gas, and diarrhea.
-
Low-sodium and processed cheeses are also available for those seeking to limit their intake of certain nutrients. The cheese industry continues to innovate, addressing these health concerns while maintaining the delicious taste and versatility that consumers love. In response, the cheese market offers various alternatives, such as soft cheeses like goat cheese, which generally have lower saturated fat content and are easier to digest for lactose-intolerant individuals.
Exclusive Customer Landscape
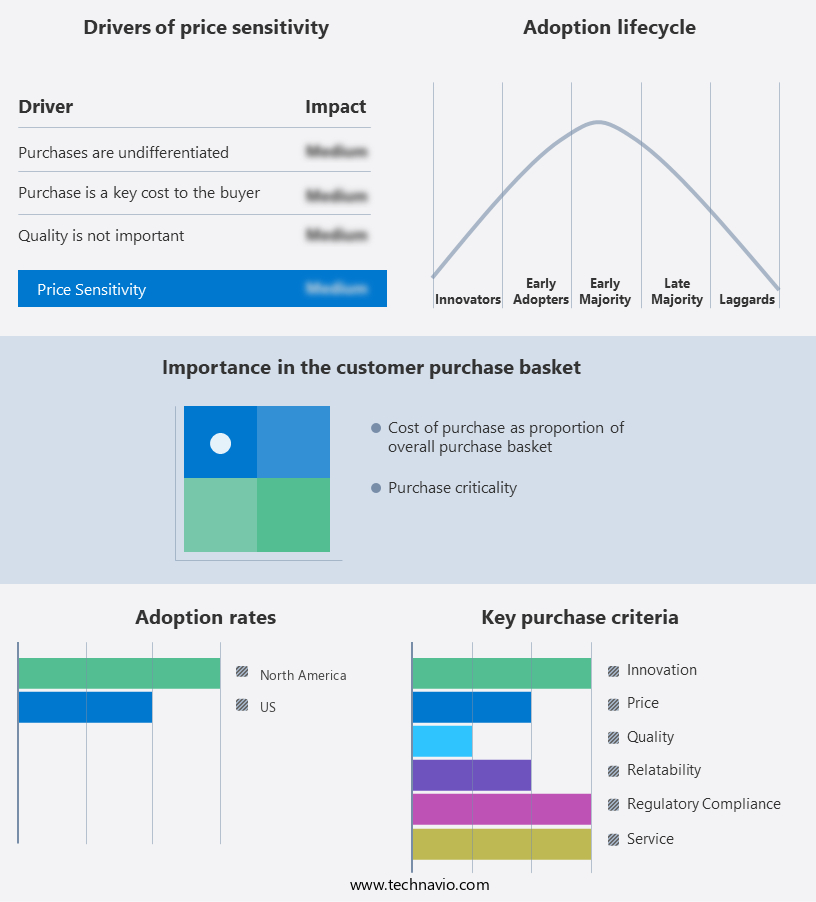
The market forecasting report includes the adoption lifecycle of the market, covering from the innovator's stage to the laggard's stage. It focuses on adoption rates in different regions based on penetration. Furthermore, the market report also includes key purchase criteria and drivers of price sensitivity to help companies evaluate and develop their market growth analysis strategies.
Customer Landscape
Key Companies & Market Insights
Companies are implementing various strategies, such as strategic alliances, market forecasts, partnerships, mergers and acquisitions, geographical expansion, and product/service launches, to enhance their presence in the market.
Associated Milk Producers Inc. - The company specializes in producing a range of cheeses, including American-style varieties.
The market research and growth report includes detailed analyses of the competitive landscape of the market and information about key companies, including:
- Associated Milk Producers Inc.
- BEL SA
- Cacique Foods LLC
- Dairy Farmers of America Inc.
- DairyfoodUSA
- First Choice Ingredients
- Gilman Cheese
- Global Foods International Inc.
- Great Lakes Cheese Co. Inc.
- HEMME BROTHERS FARMSTEAD CREAMERY
- Hilmar Cheese Co. Inc.
- Hooks Cheese
- Land O Lakes Inc.
- Mozzarella Co.
- Saputo Inc.
- The Kraft Heinz Co.
- Vella Cheese Co.
- Widmers Cheese
- Wild Rose Foods
- Zingermans
Qualitative and quantitative analysis of companies has been conducted to help clients understand the wider business environment as well as the strengths and weaknesses of key market players. Data is qualitatively analyzed to categorize companies as pure play, category-focused, industry-focused, and diversified; it is quantitatively analyzed to categorize companies as dominant, leading, strong, tentative, and weak.
Recent Development and News in Cheese Market In US
- In January 2024, Kraft Heinz, a leading food company, announced the launch of its new line of plant-based cheese alternatives, marking a significant entry into the growing plant-based food market (Kraft Heinz Press Release, 2024).
- In March 2024, Lactalis, the world's largest cheese manufacturer, formed a strategic partnership with Danone, a leading player in the dairy industry, to expand their offerings in the European market (Danone Press Release, 2024).
- In April 2025, Arla Foods, a major dairy cooperative, secured a USD 215 million investment from Danone to expand its production capacity and strengthen its position in the European market (Arla Foods Press Release, 2025).
- In May 2025, the European Union approved new regulations allowing the use of plant-based proteins in cheese production, paving the way for innovative cheese products and increased competition in the market (European Commission Press Release, 2025).
Research Analyst Overview
The cheese market continues to evolve, driven by dynamic market forces and shifting consumer preferences. Milk production remains a crucial factor, with standardized milk and dairy farms adapting to meet the demands of various cheese sectors. Sliced cheese, for instance, requires a consistent milkfat content for optimal texture and flavor profiles. Salt content and shelf life are essential considerations in cheesemaking techniques, influencing the choice between hard, semi-hard, shredded, or soft varieties. Hard cheeses, such as cheddar, have longer shelf lives due to their low moisture content and high salt content. In contrast, fresh cheeses, like mozzarella, have shorter shelf lives and require careful handling and vacuum packaging.
Food safety regulations and quality control are paramount in the cheese industry, with rigorous testing for lactose content, pH levels, and nutritional information. Cheesemaking techniques, from traditional methods to modern processes, continue to evolve, with imported cheese and whey separation playing increasingly significant roles. Cheese applications span various sectors, including food service, retail sales, and export markets. Cheese additives, such as sodium content and cheese curds, cater to diverse consumer preferences and dietary needs. The ongoing unfolding of market activities reveals an industry in constant flux, with cheese varieties ranging from domestic and processed to artisan and specialty. Organic cheese, produced on organic farms without growth hormones, antibiotics, or pesticides, is increasingly preferred due to food safety and health concerns.
Cheese types, such as Monterey Jack, American, and pepper jack, showcase the market's diversity and the importance of texture profiles and calorie content. The cheese market's continuous dynamism underscores the importance of understanding its intricacies and adapting to the ever-changing landscape. The Cheese Market in the US continues to expand with diverse consumer tastes driving demand for a wide range of products including cream cheese, hard cheese, soft cheese, and semihard cheese. Health-conscious Americans are paying closer attention to the cholesterol content of their dairy choices, prompting brands to offer lighter, heart-friendly options.
Meanwhile, the popularity of domestic cheese is on the rise as local producers highlight quality, flavor, and sustainable practices. The Cheese Market in the US is expanding with inventive offerings like cheese snacks, vegan cheese, and even niche innovations such as potato cheese. With a growing focus on wellness and the environment, sustainable cheese production and efficient waste management practices are becoming standard. Producers are also prioritizing ethical sourcing and promoting fair trade cheese, reflecting consumer demand for transparency and responsibility. Meanwhile, cheese continues to shine in diverse culinary applications, from gourmet recipes to everyday meals.
Dive into Technavio's strong research methodology, blending expert interviews, extensive data synthesis, and validated models for unparalleled Cheese Market in US insights. See full methodology.
|
Market Scope |
|
|
Report Coverage |
Details |
|
Page number |
159 |
|
Base year |
2024 |
|
Historic period |
2019-2023 |
|
Forecast period |
2025-2029 |
|
Growth momentum & CAGR |
Accelerate at a CAGR of 4.5% |
|
Market growth 2025-2029 |
USD 12.2 billion |
|
Market structure |
Fragmented |
|
YoY growth 2024-2025(%) |
4.2 |
|
Key countries |
US |
|
Competitive landscape |
Leading Companies, Market Positioning of Companies, Competitive Strategies, and Industry Risks |
What are the Key Data Covered in this Market Research and Growth Report?
- CAGR of the market during the forecast period
- Detailed information on factors that will drive the market growth and forecasting between 2025 and 2029
- Precise estimation of the size of the market and its contribution of the market in focus to the parent market
- Accurate predictions about upcoming market growth and trends and changes in consumer behaviour
- Growth of the market across US
- Thorough analysis of the market's competitive landscape and detailed information about companies
- Comprehensive analysis of factors that will challenge the growth of market companies
We can help! Our analysts can customize this market research report to meet your requirements. Get in touch
 RIA -
RIA - 
