Vegan Food Market Analysis, Size, and Forecast 2026-2030: North America (US, Canada, and Mexico), Europe (Germany, UK, and France), APAC (China, Japan, and India), South America (Brazil and Argentina), Middle East and Africa (Saudi Arabia, UAE, and South Africa), and Rest of World (ROW)

Vegan Food Market Analysis, Size, and Forecast 2026-2030:
North America (US, Canada, and Mexico), Europe (Germany, UK, and France), APAC (China, Japan, and India), South America (Brazil and Argentina), Middle East and Africa (Saudi Arabia, UAE, and South Africa), and Rest of World (ROW)

Published: Dec 2025 293 Pages SKU: IRTNTR73644

Market Overview at a Glance

$45.91 B
Market Opportunity
17.4%
CAGR 2025 - 2030
45%
North America Growth
$24.13 B
Offline segment 2024

Vegan Food Market Size 2026-2030

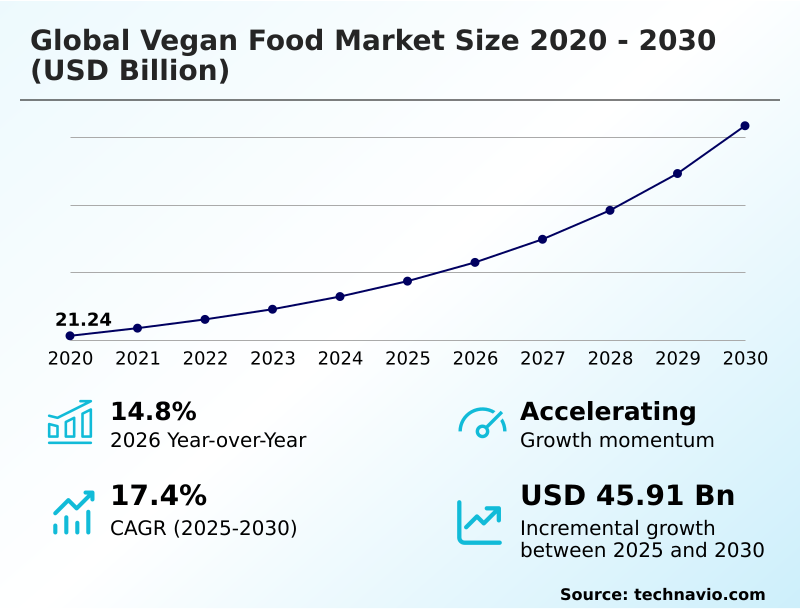
The vegan food market size is valued to increase by USD 45.91 billion, at a CAGR of 17.4% from 2025 to 2030. Growing number of vegan consumers will drive the vegan food market.

Major Market Trends & Insights

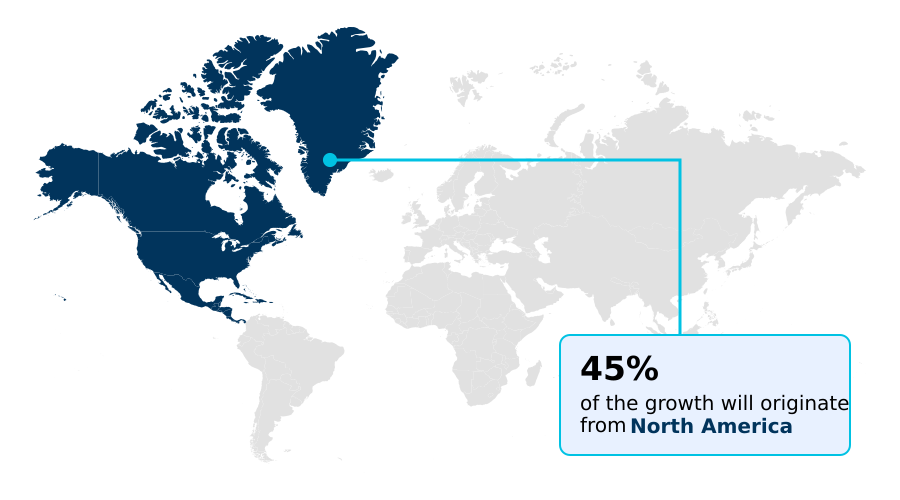
  • North America dominated the market and accounted for a 45% growth during the forecast period.
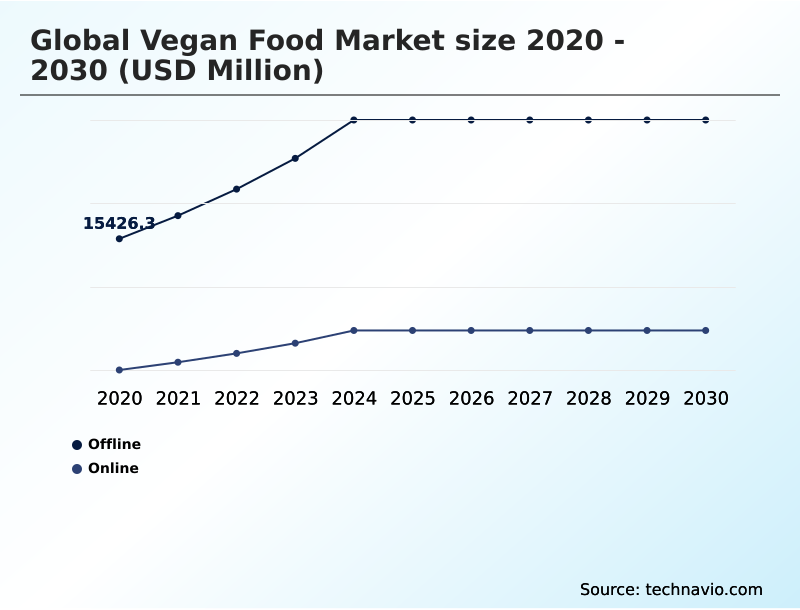
  • By Distribution Channel - Offline segment was valued at USD 24.13 billion in 2024
  • By Product - Dairy alternative segment accounted for the largest market revenue share in 2024

Market Size & Forecast

  • Market Opportunities: USD 62.06 billion
  • Market Future Opportunities: USD 45.91 billion
  • CAGR from 2025 to 2030 : 17.4%

Market Summary

  • The vegan food market is rapidly evolving, driven by a consumer shift toward healthier, more sustainable eating habits. This transition is moving the industry beyond basic offerings to complex products that replicate the sensory experience of conventional animal-based foods.
  • Innovations in high-moisture extrusion are creating more realistic meat analogues, while developments in microbial fermentation are enabling the creation of advanced dairy alternatives with nuanced flavors. The demand for clean-label ingredients and non-GMO verification is a significant factor shaping product development.
  • For instance, a food manufacturer aiming to launch a new line of plant-based cheese must navigate a complex supply chain to secure a stable source of plant-based casein.
  • This process involves ensuring transparent sourcing, validating allergen-free formulations, and managing the logistics for novel ingredients, which can increase operational overhead but is crucial for meeting the expectations of discerning consumers and building brand loyalty in a competitive landscape. This commitment to food technology innovation and quality is essential for growth.

What will be the Size of the Vegan Food Market during the forecast period?

Get Key Insights on Market Forecast (PDF) Request Free Sample

How is the Vegan Food Market Segmented?

The vegan food industry research report provides comprehensive data (region-wise segment analysis), with forecasts and estimates in "USD million" for the period 2026-2030, as well as historical data from 2020-2024 for the following segments.

  • Distribution channel
    • Offline
    • Online
  • Product
    • Dairy alternative
    • Meat alternative
    • Others
  • Source
    • Soy based
    • Wheat based
    • Oats based
    • Others
  • Geography
    • North America
      • US
      • Canada
      • Mexico
    • Europe
      • Germany
      • UK
      • France
    • APAC
      • China
      • Japan
      • India
    • South America
      • Brazil
      • Argentina
    • Middle East and Africa
      • Saudi Arabia
      • UAE
      • South Africa
    • Rest of World (ROW)

By Distribution Channel Insights

The offline segment is estimated to witness significant growth during the forecast period.

The offline channel, encompassing supermarkets and specialty stores, remains the primary point of purchase, driven by established consumer purchasing habits.

The mainstream retail adoption of plant-based proteins has expanded product visibility, moving dairy alternatives and meat analogues from niche sections to prominent aisle placements. This shift is critical for reaching the growing flexitarian consumer base.

Strategic merchandising of private-label vegan products has also been instrumental, with retailers reporting that dedicated plant-based sections improve shopper engagement by over 20%.

The availability of ready-to-eat vegan meals and dairy-free confectionery alongside conventional items normalizes ethical food consumption and supports the omnichannel retail strategy by driving in-store traffic, complementing the growth of direct-to-consumer vegan brands.

Request Free Sample

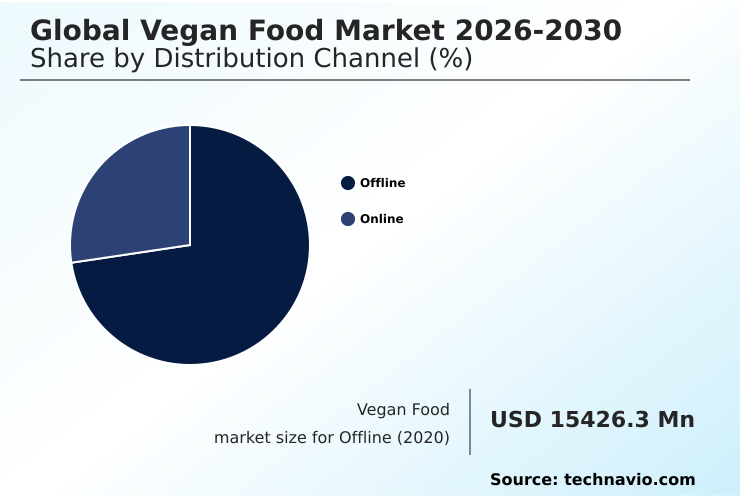
The Offline segment was valued at USD 24.13 billion in 2024 and showed a gradual increase during the forecast period.

Request Free Sample

Regional Analysis

North America is estimated to contribute 45% to the growth of the global market during the forecast period.Technavio’s analysts have elaborately explained the regional trends and drivers that shape the market during the forecast period.

See How Vegan Food Market Demand is Rising in North America Request Free Sample

The geographic landscape of the global vegan food market is characterized by established dominance in North America, which accounts for nearly 45% of the incremental growth, alongside rapid expansion in the APAC region.

In North America, the mainstream retail adoption of meat analogues and innovations in oat milk processing drive market maturity.

Conversely, APAC's growth is fueled by rising disposable incomes and a high prevalence of lactose intolerance, creating immense demand for lactose intolerance alternatives.

This regional divergence presents supply chain challenges; logistics in North America are optimized for mature cold-chain distribution, whereas scaling in APAC requires a 25% higher investment in developing localized sourcing for ingredients like soy protein concentrate to meet regional tastes and regulatory standards, impacting overall environmental impact reduction goals.

Market Dynamics

Our researchers analyzed the data with 2025 as the base year, along with the key drivers, trends, and challenges. A holistic analysis of drivers will help companies refine their marketing strategies to gain a competitive advantage.

  • Strategic success in the vegan food market hinges on a deep understanding of nuanced product attributes and consumer preferences. The debate over pea protein vs soy protein efficacy continues to drive formulation science, while the subtle oat milk impact on coffee flavor has become a critical factor in the food service channel.
  • A primary focus for R&D teams is achieving desirable plant-based cheese melting properties, a persistent challenge in dairy alternative innovation. Furthermore, consumer perception of meat analogues is shifting, demanding more than just mimicry; it requires improving texture of meat substitutes through advanced technology in plant-based meat production.
  • The clean label impact on purchasing decisions cannot be overstated, compelling brands to simplify ingredient lists. This involves a detailed cost analysis of vegan ingredients and a commitment to sustainable sourcing for plant proteins. For businesses, navigating vegan food supply chain logistics is as crucial as product development.
  • A key decision involves formulating allergen-free vegan foods without compromising taste, which often requires a greater R&D investment—sometimes 30% higher than for standard formulations. High protein vegan product development remains a lucrative area, especially when marketing plant-based foods to flexitarians. Ensuring the nutritional value of fortified vegan milk and adhering to regulatory compliance for vegan labeling are non-negotiable.
  • The industry also faces challenges in vegan seafood replication and must stay ahead of consumer trends in dairy alternatives. The significant investment in alternative protein startups indicates a future defined by continuous innovation in fermented foods in vegan diets and improvements in private label vegan food quality.

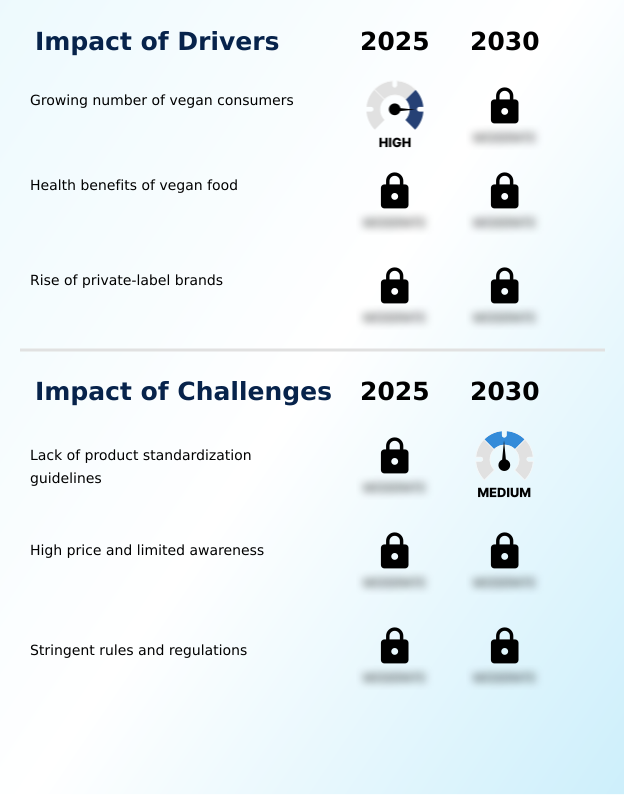
What are the key market drivers leading to the rise in the adoption of Vegan Food Industry?

  • The expanding global base of vegan consumers, driven by health and ethical considerations, is a primary factor fueling market growth.

  • The growing number of consumers adopting vegan lifestyles is a primary market driver, compelling food service menu diversification. The perceived health benefits are encouraging a switch to plant-forward dietary guidelines, aligning with broader health and wellness trends.
  • This shift is amplified by the rise of private-label vegan products, which now account for a significant share of sales.
  • In some European markets, these store brands are up to 18% cheaper than animal-based equivalents, making ethical food consumption more accessible.
  • The popularity of private labels is also linked to improved quality, with retailers launching exclusive lines of fortified vegan foods that cater to the demand for sustainable food systems and transparent sourcing.

What are the market trends shaping the Vegan Food Industry?

  • An increase in new product launches to meet the rising demand for vegan food is a significant trend influencing market growth.

  • New product launches are accelerating, driven by food technology innovation and a growing inclination toward plant-based proteins. The market is seeing a surge in plant-based seafood alternatives and sophisticated meat analogues, reflecting a broader trend of innovation in taste and nutritional value. Successful launches have been shown to increase a company's revenue stream by over 15% in the first year.
  • Brands are focusing on global flavor profiles and clean-label ingredients, appealing to both health-conscious and flavor-driven consumers. The expansion of vegan meal kits and plant-based bakery products in mainstream retail and through direct-to-consumer vegan brands is normalizing plant-based eating, with some online platforms reporting a 40% rise in new customer acquisitions during promotional periods.

What challenges does the Vegan Food Industry face during its growth?

  • The absence of uniform, international regulatory policies for product standardization presents a key challenge to market expansion.

  • A key challenge is the lack of uniform international regulations, which complicates trade for companies navigating a patchwork of national standards for tempeh fermentation and seitan production. This fragmentation can increase compliance costs by up to 20%, impacting the final price for consumers.
  • The high cost of vegan foods, often 1.5 to 2 times that of conventional products, also limits adoption, especially when animal welfare concerns are weighed against budget constraints.
  • Addressing these challenges requires not just innovation in lowering production costs for items like texturized vegetable protein, but also efforts toward global regulatory harmonization to build trust and ensure product integrity across borders, especially for products with an allergen-free formulation.

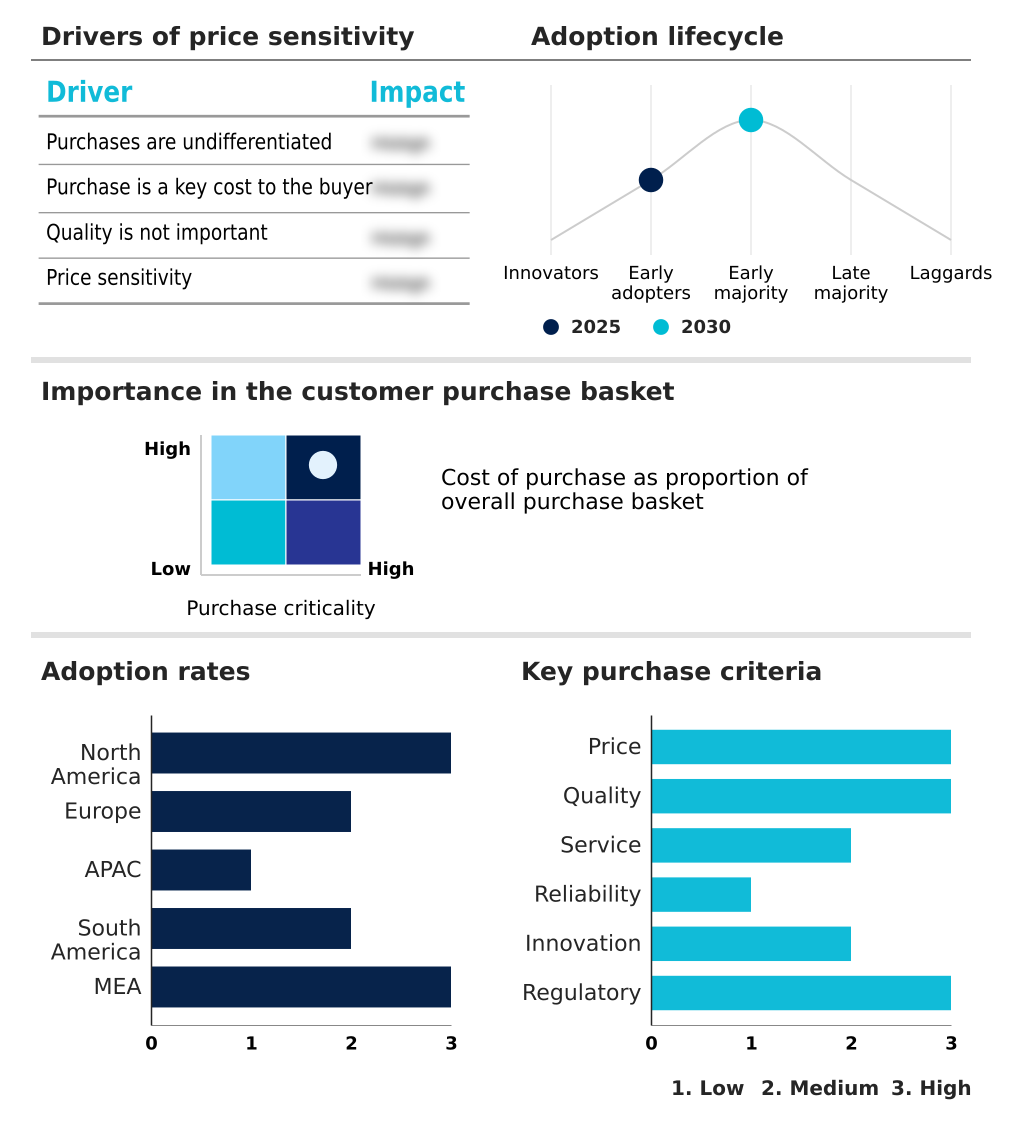
Exclusive Technavio Analysis on Customer Landscape

The vegan food market forecasting report includes the adoption lifecycle of the market, covering from the innovator’s stage to the laggard’s stage. It focuses on adoption rates in different regions based on penetration. Furthermore, the vegan food market report also includes key purchase criteria and drivers of price sensitivity to help companies evaluate and develop their market growth analysis strategies.

Customer Landscape of Vegan Food Industry

Competitive Landscape

Companies are implementing various strategies, such as strategic alliances, vegan food market forecast, partnerships, mergers and acquisitions, geographical expansion, and product/service launches, to enhance their presence in the industry.

Amys Kitchen Inc. - Key offerings include a diverse array of plant-based dairy and meat alternatives, catering to evolving consumer health, ethical, and dietary preferences.

The industry research and growth report includes detailed analyses of the competitive landscape of the market and information about key companies, including:

  • Amys Kitchen Inc.
  • Bega Cheese Ltd.
  • Beyond Meat Inc.
  • Blue Diamond Growers
  • Danone S.A.
  • Earths Own Food Co. Inc.
  • Eden Foods Inc.
  • First Grade International Ltd.
  • Maple Leaf Foods Inc.
  • Organic Valley
  • Otsuka Holdings Co. Ltd.
  • Ripple Foods PBC
  • Saputo Inc.
  • SunOpta Inc.
  • The Hain Celestial Group
  • Tofutti Brands Inc.
  • VBites Foods Ltd.

Qualitative and quantitative analysis of companies has been conducted to help clients understand the wider business environment as well as the strengths and weaknesses of key industry players. Data is qualitatively analyzed to categorize companies as pure play, category-focused, industry-focused, and diversified; it is quantitatively analyzed to categorize companies as dominant, leading, strong, tentative, and weak.

Recent Development and News in Vegan food market

  • In May, 2025, Minor Figures, a UK-based company, launched a new range of functional oat milk beverages called Hyper Oat, featuring ingredients like adaptogens and nootropics to cater to consumer interest in wellness benefits beyond basic nutrition.
  • In March, 2025, the Food Safety and Standards Authority of India (FSSAI) published draft amendments to its vegan food regulations, signaling a move towards more stringent compliance and certification for imported vegan products to enhance consumer trust.
  • In January, 2025, Vivera, a plant-based meat brand, expanded its Protein Bites range with two new varieties, Tex-Mex and Garden Greens, offering a whole-food-based option that moves beyond direct meat imitation.
  • In December, 2024, Marfrig, a major global meat industry player, launched a new gourmet plant-based hamburger in Brazil under its Revolution brand, with plans for international expansion, indicating the mainstreaming of vegan food in South America.

Dive into Technavio’s robust research methodology, blending expert interviews, extensive data synthesis, and validated models for unparalleled Vegan Food Market insights. See full methodology.

Market Scope
Page number 293
Base year 2025
Historic period 2020-2024
Forecast period 2026-2030
Growth momentum & CAGR Accelerate at a CAGR of 17.4%
Market growth 2026-2030 USD 45910.5 million
Market structure Fragmented
YoY growth 2025-2026(%) 14.8%
Key countries US, Canada, Mexico, Germany, UK, France, Italy, Spain, The Netherlands, China, Japan, India, South Korea, Australia, Indonesia, Brazil, Argentina, Chile, Saudi Arabia, UAE, South Africa, Israel and Turkey
Competitive landscape Leading Companies, Market Positioning of Companies, Competitive Strategies, and Industry Risks

Request Free Sample

Research Analyst Overview

  • The vegan food market is undergoing a significant transformation, moving beyond simple soy-based products to sophisticated meat analogues and dairy alternatives developed through advanced food technology innovation. Key to this evolution is the use of high-moisture extrusion to create realistic textures and microbial fermentation to develop complex flavors in products like cultured soy and plant-based casein for vegan cheese culturing.
  • The demand for clean-label ingredients is driving a focus on non-GMO verification and sustainable ingredient sourcing. Formulators are leveraging vital wheat gluten for seitan production, texturized vegetable protein for structure, and pea protein isolate for allergen-free formulation. This shift has boardroom-level implications, particularly for R&D budgeting.
  • For instance, achieving superior sensory profiles in plant-based seafood alternatives or through tempeh fermentation requires specialized expertise, increasing development costs by up to 25% compared to simpler formulations.
  • The emphasis on nutritional fortification and the development of fortified vegan foods with natural plant extracts underscores the market’s pivot toward health-centric offerings, while innovations in oat milk processing continue to disrupt the beverage sector.

What are the Key Data Covered in this Vegan Food Market Research and Growth Report?

  • What is the expected growth of the Vegan Food Market between 2026 and 2030?

    • USD 45.91 billion, at a CAGR of 17.4%

  • What segmentation does the market report cover?

    • The report is segmented by Distribution Channel (Offline, and Online), Product (Dairy alternative, Meat alternative, and Others), Source (Soy based, Wheat based, Oats based, and Others) and Geography (North America, Europe, APAC, South America, Middle East and Africa)

  • Which regions are analyzed in the report?

    • North America, Europe, APAC, South America and Middle East and Africa

  • What are the key growth drivers and market challenges?

    • Growing number of vegan consumers, Lack of product standardization guidelines

  • Who are the major players in the Vegan Food Market?

    • Amys Kitchen Inc., Bega Cheese Ltd., Beyond Meat Inc., Blue Diamond Growers, Danone S.A., Earths Own Food Co. Inc., Eden Foods Inc., First Grade International Ltd., Maple Leaf Foods Inc., Organic Valley, Otsuka Holdings Co. Ltd., Ripple Foods PBC, Saputo Inc., SunOpta Inc., The Hain Celestial Group, Tofutti Brands Inc. and VBites Foods Ltd.

Market Research Insights

  • The market's momentum is increasingly shaped by evolving consumer purchasing habits and a pronounced shift toward ethical food consumption. Growth is not just driven by a dedicated vegan base but by a much larger flexitarian consumer base, with reports indicating nearly half of consumers now purchase private-label vegan products, citing improved quality and affordability.
  • This has led to a 15% increase in shelf space for store brands in major retail chains. Furthermore, the focus on health and wellness trends is a powerful catalyst; recent surveys show that over 58% of individuals adopting plant-forward dietary guidelines report enhanced well-being.
  • This consumer sentiment is compelling food service menu diversification and supporting the expansion of direct-to-consumer vegan brands that leverage eco-friendly packaging.

We can help! Our analysts can customize this vegan food market research report to meet your requirements.

Get in touch

1. Executive Summary

1.1 Market overview

Executive Summary - Chart on Market Overview
Executive Summary - Data Table on Market Overview
Executive Summary - Chart on Global Market Characteristics
Executive Summary - Chart on Market by Geography
Executive Summary - Chart on Market Segmentation by Distribution Channel
Executive Summary - Chart on Market Segmentation by Product
Executive Summary - Chart on Market Segmentation by Source
Executive Summary - Chart on Incremental Growth
Executive Summary - Data Table on Incremental Growth
Executive Summary - Chart on Company Market Positioning

2. Technavio Analysis

2.1 Analysis of price sensitivity, lifecycle, customer purchase basket, adoption rates, and purchase criteria

2.2 Criticality of inputs and Factors of differentiation

Chart on Overview on criticality of inputs and factors of differentiation

2.3 Factors of disruption

Chart on Overview on factors of disruption

2.4 Impact of drivers and challenges

Chart on Impact of drivers and challenges in 2025 and 2030

3. Market Landscape

3.1 Market ecosystem

Chart on Parent Market
Data Table on - Parent Market

3.2 Market characteristics

Chart on Market characteristics analysis

3.3 Value chain analysis

Chart on Value chain analysis

4. Market Sizing

4.1 Market definition

Data Table on Offerings of companies included in the market definition

4.2 Market segment analysis

Market segments

4.3 Market size 2025

4.4 Market outlook: Forecast for 2025-2030

Chart on Global - Market size and forecast 2025-2030 ($ million)
Data Table on Global - Market size and forecast 2025-2030 ($ million)
Chart on Global Market: Year-over-year growth 2025-2030 (%)
Data Table on Global Market: Year-over-year growth 2025-2030 (%)

5. Historic Market Size

5.1 Global Vegan Food Market 2020 - 2024

Historic Market Size - Data Table on Global Vegan Food Market 2020 - 2024 ($ million)

5.2 Distribution Channel segment analysis 2020 - 2024

Historic Market Size - Distribution Channel Segment 2020 - 2024 ($ million)

5.3 Product segment analysis 2020 - 2024

Historic Market Size - Product Segment 2020 - 2024 ($ million)

5.4 Source segment analysis 2020 - 2024

Historic Market Size - Source Segment 2020 - 2024 ($ million)

5.5 Geography segment analysis 2020 - 2024

Historic Market Size - Geography Segment 2020 - 2024 ($ million)

5.6 Country segment analysis 2020 - 2024

Historic Market Size - Country Segment 2020 - 2024 ($ million)

6. Qualitative Analysis

6.1 Impact of AI in global vegan food market

7. Five Forces Analysis

7.1 Five forces summary

Five forces analysis - Comparison between 2025 and 2030

7.2 Bargaining power of buyers

Bargaining power of buyers - Impact of key factors 2025 and 2030

7.3 Bargaining power of suppliers

Bargaining power of suppliers - Impact of key factors in 2025 and 2030

7.4 Threat of new entrants

Threat of new entrants - Impact of key factors in 2025 and 2030

7.5 Threat of substitutes

Threat of substitutes - Impact of key factors in 2025 and 2030

7.6 Threat of rivalry

Threat of rivalry - Impact of key factors in 2025 and 2030

7.7 Market condition

Chart on Market condition - Five forces 2025 and 2030

8. Market Segmentation by Distribution Channel

8.1 Market segments

Chart on Distribution Channel - Market share 2025-2030 (%)
Data Table on Distribution Channel - Market share 2025-2030 (%)

8.2 Comparison by Distribution Channel

Chart on Comparison by Distribution Channel
Data Table on Comparison by Distribution Channel

8.3 Offline - Market size and forecast 2025-2030

Chart on Offline - Market size and forecast 2025-2030 ($ million)
Data Table on Offline - Market size and forecast 2025-2030 ($ million)
Chart on Offline - Year-over-year growth 2025-2030 (%)
Data Table on Offline - Year-over-year growth 2025-2030 (%)

8.4 Online - Market size and forecast 2025-2030

Chart on Online - Market size and forecast 2025-2030 ($ million)
Data Table on Online - Market size and forecast 2025-2030 ($ million)
Chart on Online - Year-over-year growth 2025-2030 (%)
Data Table on Online - Year-over-year growth 2025-2030 (%)

8.5 Market opportunity by Distribution Channel

Market opportunity by Distribution Channel ($ million)
Data Table on Market opportunity by Distribution Channel ($ million)

9. Market Segmentation by Product

9.1 Market segments

Chart on Product - Market share 2025-2030 (%)
Data Table on Product - Market share 2025-2030 (%)

9.2 Comparison by Product

Chart on Comparison by Product
Data Table on Comparison by Product

9.3 Dairy alternative - Market size and forecast 2025-2030

Chart on Dairy alternative - Market size and forecast 2025-2030 ($ million)
Data Table on Dairy alternative - Market size and forecast 2025-2030 ($ million)
Chart on Dairy alternative - Year-over-year growth 2025-2030 (%)
Data Table on Dairy alternative - Year-over-year growth 2025-2030 (%)

9.4 Meat alternative - Market size and forecast 2025-2030

Chart on Meat alternative - Market size and forecast 2025-2030 ($ million)
Data Table on Meat alternative - Market size and forecast 2025-2030 ($ million)
Chart on Meat alternative - Year-over-year growth 2025-2030 (%)
Data Table on Meat alternative - Year-over-year growth 2025-2030 (%)

9.5 Others - Market size and forecast 2025-2030

Chart on Others - Market size and forecast 2025-2030 ($ million)
Data Table on Others - Market size and forecast 2025-2030 ($ million)
Chart on Others - Year-over-year growth 2025-2030 (%)
Data Table on Others - Year-over-year growth 2025-2030 (%)

9.6 Market opportunity by Product

Market opportunity by Product ($ million)
Data Table on Market opportunity by Product ($ million)

10. Market Segmentation by Source

10.1 Market segments

Chart on Source - Market share 2025-2030 (%)
Data Table on Source - Market share 2025-2030 (%)

10.2 Comparison by Source

Chart on Comparison by Source
Data Table on Comparison by Source

10.3 Soy based - Market size and forecast 2025-2030

Chart on Soy based - Market size and forecast 2025-2030 ($ million)
Data Table on Soy based - Market size and forecast 2025-2030 ($ million)
Chart on Soy based - Year-over-year growth 2025-2030 (%)
Data Table on Soy based - Year-over-year growth 2025-2030 (%)

10.4 Wheat based - Market size and forecast 2025-2030

Chart on Wheat based - Market size and forecast 2025-2030 ($ million)
Data Table on Wheat based - Market size and forecast 2025-2030 ($ million)
Chart on Wheat based - Year-over-year growth 2025-2030 (%)
Data Table on Wheat based - Year-over-year growth 2025-2030 (%)

10.5 Oats based - Market size and forecast 2025-2030

Chart on Oats based - Market size and forecast 2025-2030 ($ million)
Data Table on Oats based - Market size and forecast 2025-2030 ($ million)
Chart on Oats based - Year-over-year growth 2025-2030 (%)
Data Table on Oats based - Year-over-year growth 2025-2030 (%)

10.6 Others - Market size and forecast 2025-2030

Chart on Others - Market size and forecast 2025-2030 ($ million)
Data Table on Others - Market size and forecast 2025-2030 ($ million)
Chart on Others - Year-over-year growth 2025-2030 (%)
Data Table on Others - Year-over-year growth 2025-2030 (%)

10.7 Market opportunity by Source

Market opportunity by Source ($ million)
Data Table on Market opportunity by Source ($ million)

11. Customer Landscape

11.1 Customer landscape overview

Analysis of price sensitivity, lifecycle, customer purchase basket, adoption rates, and purchase criteria

12. Geographic Landscape

12.1 Geographic segmentation

Chart on Market share by geography 2025-2030 (%)
Data Table on Market share by geography 2025-2030 (%)

12.2 Geographic comparison

Chart on Geographic comparison
Data Table on Geographic comparison

12.3 North America - Market size and forecast 2025-2030

Chart on North America - Market size and forecast 2025-2030 ($ million)
Data Table on North America - Market size and forecast 2025-2030 ($ million)
Chart on North America - Year-over-year growth 2025-2030 (%)
Data Table on North America - Year-over-year growth 2025-2030 (%)
Chart on Regional Comparison - North America
Data Table on Regional Comparison - North America

12.3.1 US - Market size and forecast 2025-2030

Chart on US - Market size and forecast 2025-2030 ($ million)
Data Table on US - Market size and forecast 2025-2030 ($ million)
Chart on US - Year-over-year growth 2025-2030 (%)
Data Table on US - Year-over-year growth 2025-2030 (%)

12.3.2 Canada - Market size and forecast 2025-2030

Chart on Canada - Market size and forecast 2025-2030 ($ million)
Data Table on Canada - Market size and forecast 2025-2030 ($ million)
Chart on Canada - Year-over-year growth 2025-2030 (%)
Data Table on Canada - Year-over-year growth 2025-2030 (%)

12.3.3 Mexico - Market size and forecast 2025-2030

Chart on Mexico - Market size and forecast 2025-2030 ($ million)
Data Table on Mexico - Market size and forecast 2025-2030 ($ million)
Chart on Mexico - Year-over-year growth 2025-2030 (%)
Data Table on Mexico - Year-over-year growth 2025-2030 (%)

12.4 Europe - Market size and forecast 2025-2030

Chart on Europe - Market size and forecast 2025-2030 ($ million)
Data Table on Europe - Market size and forecast 2025-2030 ($ million)
Chart on Europe - Year-over-year growth 2025-2030 (%)
Data Table on Europe - Year-over-year growth 2025-2030 (%)
Chart on Regional Comparison - Europe
Data Table on Regional Comparison - Europe

12.4.1 Germany - Market size and forecast 2025-2030

Chart on Germany - Market size and forecast 2025-2030 ($ million)
Data Table on Germany - Market size and forecast 2025-2030 ($ million)
Chart on Germany - Year-over-year growth 2025-2030 (%)
Data Table on Germany - Year-over-year growth 2025-2030 (%)

12.4.2 UK - Market size and forecast 2025-2030

Chart on UK - Market size and forecast 2025-2030 ($ million)
Data Table on UK - Market size and forecast 2025-2030 ($ million)
Chart on UK - Year-over-year growth 2025-2030 (%)
Data Table on UK - Year-over-year growth 2025-2030 (%)

12.4.3 France - Market size and forecast 2025-2030

Chart on France - Market size and forecast 2025-2030 ($ million)
Data Table on France - Market size and forecast 2025-2030 ($ million)
Chart on France - Year-over-year growth 2025-2030 (%)
Data Table on France - Year-over-year growth 2025-2030 (%)

12.4.4 Italy - Market size and forecast 2025-2030

Chart on Italy - Market size and forecast 2025-2030 ($ million)
Data Table on Italy - Market size and forecast 2025-2030 ($ million)
Chart on Italy - Year-over-year growth 2025-2030 (%)
Data Table on Italy - Year-over-year growth 2025-2030 (%)

12.4.5 Spain - Market size and forecast 2025-2030

Chart on Spain - Market size and forecast 2025-2030 ($ million)
Data Table on Spain - Market size and forecast 2025-2030 ($ million)
Chart on Spain - Year-over-year growth 2025-2030 (%)
Data Table on Spain - Year-over-year growth 2025-2030 (%)

12.4.6 The Netherlands - Market size and forecast 2025-2030

Chart on The Netherlands - Market size and forecast 2025-2030 ($ million)
Data Table on The Netherlands - Market size and forecast 2025-2030 ($ million)
Chart on The Netherlands - Year-over-year growth 2025-2030 (%)
Data Table on The Netherlands - Year-over-year growth 2025-2030 (%)

12.5 APAC - Market size and forecast 2025-2030

Chart on APAC - Market size and forecast 2025-2030 ($ million)
Data Table on APAC - Market size and forecast 2025-2030 ($ million)
Chart on APAC - Year-over-year growth 2025-2030 (%)
Data Table on APAC - Year-over-year growth 2025-2030 (%)
Chart on Regional Comparison - APAC
Data Table on Regional Comparison - APAC

12.5.1 China - Market size and forecast 2025-2030

Chart on China - Market size and forecast 2025-2030 ($ million)
Data Table on China - Market size and forecast 2025-2030 ($ million)
Chart on China - Year-over-year growth 2025-2030 (%)
Data Table on China - Year-over-year growth 2025-2030 (%)

12.5.2 Japan - Market size and forecast 2025-2030

Chart on Japan - Market size and forecast 2025-2030 ($ million)
Data Table on Japan - Market size and forecast 2025-2030 ($ million)
Chart on Japan - Year-over-year growth 2025-2030 (%)
Data Table on Japan - Year-over-year growth 2025-2030 (%)

12.5.3 India - Market size and forecast 2025-2030

Chart on India - Market size and forecast 2025-2030 ($ million)
Data Table on India - Market size and forecast 2025-2030 ($ million)
Chart on India - Year-over-year growth 2025-2030 (%)
Data Table on India - Year-over-year growth 2025-2030 (%)

12.5.4 South Korea - Market size and forecast 2025-2030

Chart on South Korea - Market size and forecast 2025-2030 ($ million)
Data Table on South Korea - Market size and forecast 2025-2030 ($ million)
Chart on South Korea - Year-over-year growth 2025-2030 (%)
Data Table on South Korea - Year-over-year growth 2025-2030 (%)

12.5.5 Australia - Market size and forecast 2025-2030

Chart on Australia - Market size and forecast 2025-2030 ($ million)
Data Table on Australia - Market size and forecast 2025-2030 ($ million)
Chart on Australia - Year-over-year growth 2025-2030 (%)
Data Table on Australia - Year-over-year growth 2025-2030 (%)

12.5.6 Indonesia - Market size and forecast 2025-2030

Chart on Indonesia - Market size and forecast 2025-2030 ($ million)
Data Table on Indonesia - Market size and forecast 2025-2030 ($ million)
Chart on Indonesia - Year-over-year growth 2025-2030 (%)
Data Table on Indonesia - Year-over-year growth 2025-2030 (%)

12.6 South America - Market size and forecast 2025-2030

Chart on South America - Market size and forecast 2025-2030 ($ million)
Data Table on South America - Market size and forecast 2025-2030 ($ million)
Chart on South America - Year-over-year growth 2025-2030 (%)
Data Table on South America - Year-over-year growth 2025-2030 (%)
Chart on Regional Comparison - South America
Data Table on Regional Comparison - South America

12.6.1 Brazil - Market size and forecast 2025-2030

Chart on Brazil - Market size and forecast 2025-2030 ($ million)
Data Table on Brazil - Market size and forecast 2025-2030 ($ million)
Chart on Brazil - Year-over-year growth 2025-2030 (%)
Data Table on Brazil - Year-over-year growth 2025-2030 (%)

12.6.2 Argentina - Market size and forecast 2025-2030

Chart on Argentina - Market size and forecast 2025-2030 ($ million)
Data Table on Argentina - Market size and forecast 2025-2030 ($ million)
Chart on Argentina - Year-over-year growth 2025-2030 (%)
Data Table on Argentina - Year-over-year growth 2025-2030 (%)

12.6.3 Chile - Market size and forecast 2025-2030

Chart on Chile - Market size and forecast 2025-2030 ($ million)
Data Table on Chile - Market size and forecast 2025-2030 ($ million)
Chart on Chile - Year-over-year growth 2025-2030 (%)
Data Table on Chile - Year-over-year growth 2025-2030 (%)

12.7 Middle East and Africa - Market size and forecast 2025-2030

Chart on Middle East and Africa - Market size and forecast 2025-2030 ($ million)
Data Table on Middle East and Africa - Market size and forecast 2025-2030 ($ million)
Chart on Middle East and Africa - Year-over-year growth 2025-2030 (%)
Data Table on Middle East and Africa - Year-over-year growth 2025-2030 (%)
Chart on Regional Comparison - Middle East and Africa
Data Table on Regional Comparison - Middle East and Africa

12.7.1 Saudi Arabia - Market size and forecast 2025-2030

Chart on Saudi Arabia - Market size and forecast 2025-2030 ($ million)
Data Table on Saudi Arabia - Market size and forecast 2025-2030 ($ million)
Chart on Saudi Arabia - Year-over-year growth 2025-2030 (%)
Data Table on Saudi Arabia - Year-over-year growth 2025-2030 (%)

12.7.2 UAE - Market size and forecast 2025-2030

Chart on UAE - Market size and forecast 2025-2030 ($ million)
Data Table on UAE - Market size and forecast 2025-2030 ($ million)
Chart on UAE - Year-over-year growth 2025-2030 (%)
Data Table on UAE - Year-over-year growth 2025-2030 (%)

12.7.3 South Africa - Market size and forecast 2025-2030

Chart on South Africa - Market size and forecast 2025-2030 ($ million)
Data Table on South Africa - Market size and forecast 2025-2030 ($ million)
Chart on South Africa - Year-over-year growth 2025-2030 (%)
Data Table on South Africa - Year-over-year growth 2025-2030 (%)

12.7.4 Israel - Market size and forecast 2025-2030

Chart on Israel - Market size and forecast 2025-2030 ($ million)
Data Table on Israel - Market size and forecast 2025-2030 ($ million)
Chart on Israel - Year-over-year growth 2025-2030 (%)
Data Table on Israel - Year-over-year growth 2025-2030 (%)

12.7.5 Turkey - Market size and forecast 2025-2030

Chart on Turkey - Market size and forecast 2025-2030 ($ million)
Data Table on Turkey - Market size and forecast 2025-2030 ($ million)
Chart on Turkey - Year-over-year growth 2025-2030 (%)
Data Table on Turkey - Year-over-year growth 2025-2030 (%)

12.8 Market opportunity by geography

Market opportunity by geography ($ million)
Data Tables on Market opportunity by geography ($ million)

13. Drivers, Challenges, and Opportunity

13.1 Market drivers

Growing number of vegan consumers
Health benefits of vegan food
Rise of private-label brands

13.2 Market challenges

Lack of product standardization guidelines
High price and limited awareness
Stringent rules and regulations

13.3 Impact of drivers and challenges

Impact of drivers and challenges in 2025 and 2030

13.4 Market opportunities

New product launches
Growing inclination toward plant-based proteins
Growing organized retail sector

14. Competitive Landscape

14.1 Overview

14.2

Overview on criticality of inputs and factors of differentiation

14.3 Landscape disruption

Overview on factors of disruption

14.4 Industry risks

Impact of key risks on business

15. Competitive Analysis

15.1 Companies profiled

Companies covered

15.2 Company ranking index

15.3 Market positioning of companies

Matrix on companies position and classification

15.4 Amys Kitchen Inc.

Amys Kitchen Inc. - Overview
Amys Kitchen Inc. - Product / Service
Amys Kitchen Inc. - Key offerings
SWOT

15.5 Beyond Meat Inc.

Beyond Meat Inc. - Overview
Beyond Meat Inc. - Product / Service
Beyond Meat Inc. - Key offerings
SWOT

15.6 Blue Diamond Growers

Blue Diamond Growers - Overview
Blue Diamond Growers - Product / Service
Blue Diamond Growers - Key offerings
SWOT

15.7 Danone S.A.

Danone S.A. - Overview
Danone S.A. - Business segments
Danone S.A. - Key news
Danone S.A. - Key offerings
Danone S.A. - Segment focus
SWOT

15.8 Earths Own Food Co. Inc.

Earths Own Food Co. Inc. - Overview
Earths Own Food Co. Inc. - Product / Service
Earths Own Food Co. Inc. - Key offerings
SWOT

15.9 Eden Foods Inc.

Eden Foods Inc. - Overview
Eden Foods Inc. - Product / Service
Eden Foods Inc. - Key offerings
SWOT

15.10 First Grade International Ltd.

First Grade International Ltd. - Overview
First Grade International Ltd. - Product / Service
First Grade International Ltd. - Key offerings
SWOT

15.11 Maple Leaf Foods Inc.

Maple Leaf Foods Inc. - Overview
Maple Leaf Foods Inc. - Business segments
Maple Leaf Foods Inc. - Key offerings
Maple Leaf Foods Inc. - Segment focus
SWOT

15.12 Organic Valley

Organic Valley - Overview
Organic Valley - Product / Service
Organic Valley - Key offerings
SWOT

15.13 Otsuka Holdings Co. Ltd.

Otsuka Holdings Co. Ltd. - Overview
Otsuka Holdings Co. Ltd. - Business segments
Otsuka Holdings Co. Ltd. - Key news
Otsuka Holdings Co. Ltd. - Key offerings
Otsuka Holdings Co. Ltd. - Segment focus
SWOT

15.14 Ripple Foods PBC

Ripple Foods PBC - Overview
Ripple Foods PBC - Product / Service
Ripple Foods PBC - Key offerings
SWOT

15.15 Saputo Inc.

Saputo Inc. - Overview
Saputo Inc. - Business segments
Saputo Inc. - Key offerings
Saputo Inc. - Segment focus
SWOT

15.16 The Hain Celestial Group

The Hain Celestial Group - Overview
The Hain Celestial Group - Business segments
The Hain Celestial Group - Key news
The Hain Celestial Group - Key offerings
The Hain Celestial Group - Segment focus
SWOT

15.17 Tofutti Brands Inc.

Tofutti Brands Inc. - Overview
Tofutti Brands Inc. - Product / Service
Tofutti Brands Inc. - Key offerings
SWOT

15.18 VBites Foods Ltd.

VBites Foods Ltd. - Overview
VBites Foods Ltd. - Product / Service
VBites Foods Ltd. - Key offerings
SWOT

16. Appendix

16.1 Scope of the report

Market definition
Objectives
Notes and caveats

16.2 Inclusions and exclusions checklist

Inclusions checklist
Exclusions checklist

16.3 Currency conversion rates for US$

16.4 Research methodology

16.5 Data procurement

Information sources

16.6 Data validation

16.7 Validation techniques employed for market sizing

16.8 Data synthesis

16.9 360 degree market analysis

16.10 List of abbreviations

Research Methodology

Technavio presents a detailed picture of the market by way of study, synthesis, and summation of data from multiple sources. The analysts have presented the various facets of the market with a particular focus on identifying the key industry influencers. The data thus presented is comprehensive, reliable, and the result of extensive research, both primary and secondary.

INFORMATION SOURCES

Primary sources

  • Manufacturers and suppliers
  • Channel partners
  • Industry experts
  • Strategic decision makers

Secondary sources

  • Industry journals and periodicals
  • Government data
  • Financial reports of key industry players
  • Historical data
  • Press releases

DATA ANALYSIS

Data Synthesis

  • Collation of data
  • Estimation of key figures
  • Analysis of derived insights

Data Validation

  • Triangulation with data models
  • Reference against proprietary databases
  • Corroboration with industry experts

REPORT WRITING

Qualitative

  • Market drivers
  • Market challenges
  • Market trends
  • Five forces analysis

Quantitative

  • Market size and forecast
  • Market segmentation
  • Geographical insights
  • Competitive landscape

Interested in this report?

Get your sample now to see our research methodology and insights!

Download Now

Frequently Asked Questions

Vegan Food market growth will increase by USD 45910.5 million during 2026-2030.

The Vegan Food market is expected to grow at a CAGR of 17.4% during 2026-2030.

Vegan Food market is segmented by Distribution channel (Offline, Online) Product (Dairy alternative, Meat alternative, Others) Source (Soy based, Wheat based, Oats based, Others)

Amys Kitchen Inc., Bega Cheese Ltd., Beyond Meat Inc., Blue Diamond Growers, Danone S.A., Earths Own Food Co. Inc., Eden Foods Inc., First Grade International Ltd., Maple Leaf Foods Inc., Organic Valley, Otsuka Holdings Co. Ltd., Ripple Foods PBC, Saputo Inc., SunOpta Inc., The Hain Celestial Group, Tofutti Brands Inc., VBites Foods Ltd. are a few of the key vendors in the Vegan Food market.

North America will register the highest growth rate of 45% among the other regions. Therefore, the Vegan Food market in North America is expected to garner significant business opportunities for the vendors during the forecast period.

US, Canada, Mexico, Germany, UK, France, Italy, Spain, The Netherlands, China, Japan, India, South Korea, Australia, Indonesia, Brazil, Argentina, Chile, Saudi Arabia, UAE, South Africa, Israel, Turkey

  • Growing number of vegan consumers is the driving factor this market.

The Vegan Food market vendors should focus on grabbing business opportunities from the Distribution channel segment as it accounted for the largest market share in the base year.