Vegan Popsicles Market Analysis, Size, and Forecast 2026-2030: North America (US, Canada, and Mexico), Europe (Germany, UK, and France), APAC (China, India, and Japan), South America (Brazil, Argentina, and Colombia), Middle East and Africa (Saudi Arabia, UAE, and South Africa), and Rest of World (ROW)

Vegan Popsicles Market Analysis, Size, and Forecast 2026-2030:
North America (US, Canada, and Mexico), Europe (Germany, UK, and France), APAC (China, India, and Japan), South America (Brazil, Argentina, and Colombia), Middle East and Africa (Saudi Arabia, UAE, and South Africa), and Rest of World (ROW)

Published: Jan 2026 291 Pages SKU: IRTNTR81245

Market Overview at a Glance

$106.29 Mn
Market Opportunity
15.6%
CAGR 2025 - 2030
35.9%
North America Growth
$67.41 Mn
Fruit-based segment 2024

Vegan Popsicles Market Size 2026-2030

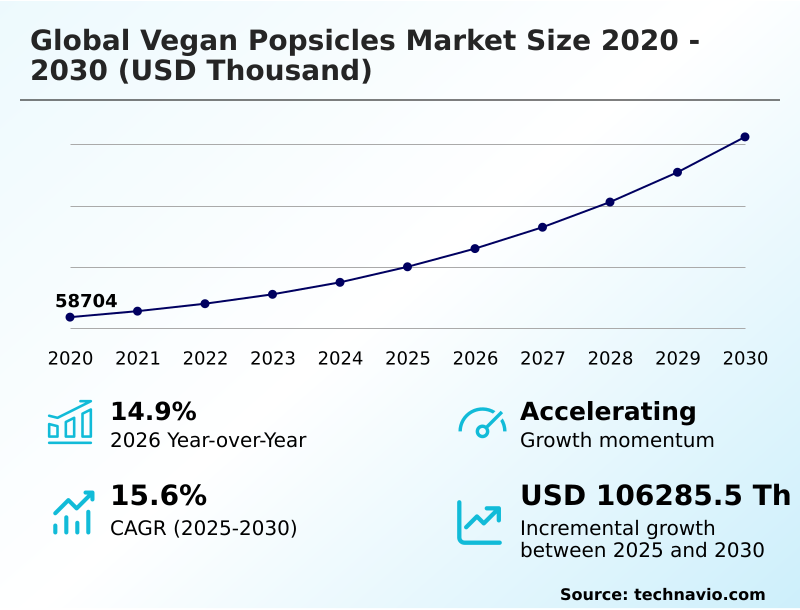
The vegan popsicles market size is valued to increase by USD 106.29 million, at a CAGR of 15.6% from 2025 to 2030. Surging global demand for plant-based and dairy-free alternatives will drive the vegan popsicles market.

Major Market Trends & Insights

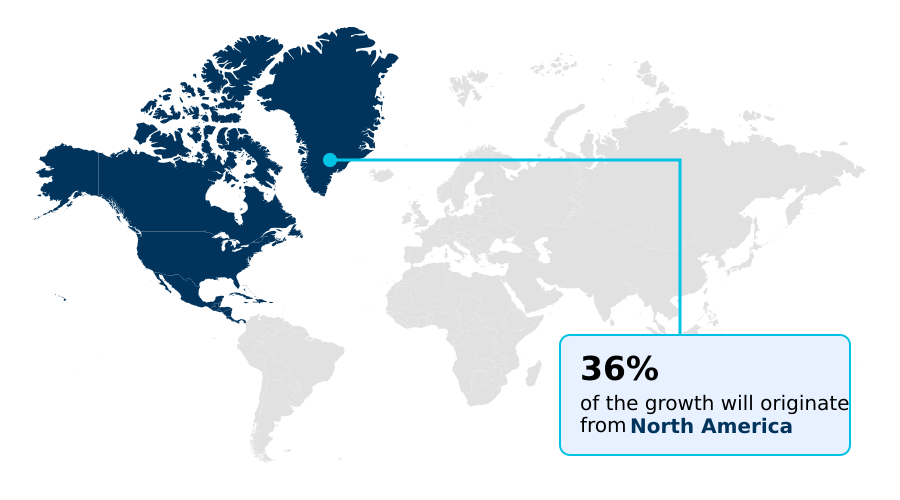
  • North America dominated the market and accounted for a 35.9% growth during the forecast period.
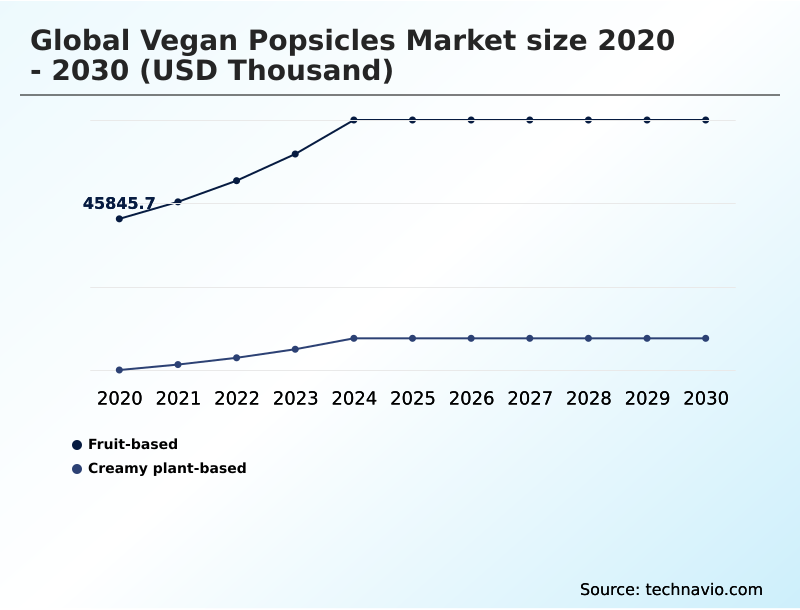
  • By Type - Fruit-based segment was valued at USD 67.41 million in 2024
  • By Flavor - Fruit segment accounted for the largest market revenue share in 2024

Market Size & Forecast

  • Market Opportunities:
  • Market Future Opportunities: USD 106.29 million
  • CAGR from 2025 to 2030 : 15.6%

Market Summary

  • The vegan popsicles market is expanding as consumer preferences shift toward health-conscious and ethical food choices. This growth is driven by a rising awareness of lactose intolerance and the environmental impact of dairy farming, compelling a broader demographic, including flexitarians, to seek plant-based alternatives.
  • Key trends shaping the industry include the premiumization of products through gourmet flavor profiles and the incorporation of functional ingredients like probiotics and vitamins, transforming desserts into wellness-centric snacks. For instance, a manufacturer might leverage advanced plant protein stabilization techniques to create a creamy texture in its oat milk-based bars, while using biodegradable packaging to appeal to eco-conscious consumers.
  • However, the market faces challenges related to the high cost of quality, non-GMO ingredients and the complexities of maintaining a reliable cold chain infrastructure. Success in this competitive landscape depends on a company's ability to innovate continuously, manage supply chain efficiencies, and communicate a strong brand narrative centered on health and sustainability.

What will be the Size of the Vegan Popsicles Market during the forecast period?

Get Key Insights on Market Forecast (PDF) Request Free Sample

How is the Vegan Popsicles Market Segmented?

The vegan popsicles industry research report provides comprehensive data (region-wise segment analysis), with forecasts and estimates in "USD thousand" for the period 2026-2030, as well as historical data from 2020-2024 for the following segments.

  • Type
    • Fruit-based
    • Creamy plant-based
  • Flavor
    • Fruit
    • Tropical
    • Exotic
  • Distribution channel
    • Supermarkets and hypermarkets
    • Online
    • Convenience stores
  • Geography
    • North America
      • US
      • Canada
      • Mexico
    • Europe
      • Germany
      • UK
      • France
    • APAC
      • China
      • India
      • Japan
    • South America
      • Brazil
      • Argentina
      • Colombia
    • Middle East and Africa
      • Saudi Arabia
      • UAE
      • South Africa
    • Rest of World (ROW)

By Type Insights

The fruit-based segment is estimated to witness significant growth during the forecast period.

The fruit-based segment is a cornerstone of the market, primarily appealing to consumers seeking healthy frozen snacks and natural frozen desserts.

These offerings, which include organic fruit bars and other low-calorie frozen desserts, are formulated with fruit puree concentrate and natural sweeteners. Producers are leveraging cryogenic cooling technique to create a smoother texture, differentiating their handheld frozen desserts from competitors.

Innovations in plant-based fat stabilization are also enabling the creation of shelf-stable fruit pops suitable for year-round treats, expanding beyond seasonal demand.

This segment's growth, contributing over 35% of the market's incremental expansion in North America, is driven by the demand for clean, simple, and refreshing single-serve frozen treats that do not compromise on taste.

Request Free Sample

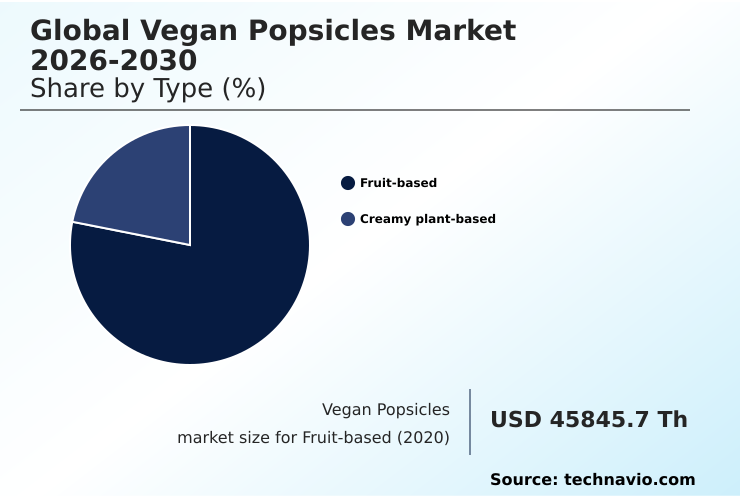
The Fruit-based segment was valued at USD 67.41 million in 2024 and showed a gradual increase during the forecast period.

Request Free Sample

Regional Analysis

North America is estimated to contribute 35.9% to the growth of the global market during the forecast period.Technavio’s analysts have elaborately explained the regional trends and drivers that shape the market during the forecast period.

See How Vegan Popsicles Market Demand is Rising in North America Request Free Sample

The geographic landscape of the dairy-free frozen novelties market is diverse, with North America accounting for 35.9% of incremental growth, driven by a mature retail environment and high consumer health awareness.

In this region, indulgent vegan treats made with oat milk frozen dessert and cashew cream formulation are popular.

Meanwhile, the APAC region is the fastest-growing market, projected to capture over 24% of the market opportunity, largely due to high rates of lactose intolerance and traditional diets incorporating ingredients like those found in red bean ice bars.

Europe is distinguished by its demand for sustainable plant-based confectionery and gourmet vegan desserts featuring international flavor trends.

Across all regions, the use of a coconut milk base and acai berry sorbet is common, with ongoing innovations in plant protein stabilization catering to the demand for high-protein frozen desserts and superior dairy-free ice cream bars.

Market Dynamics

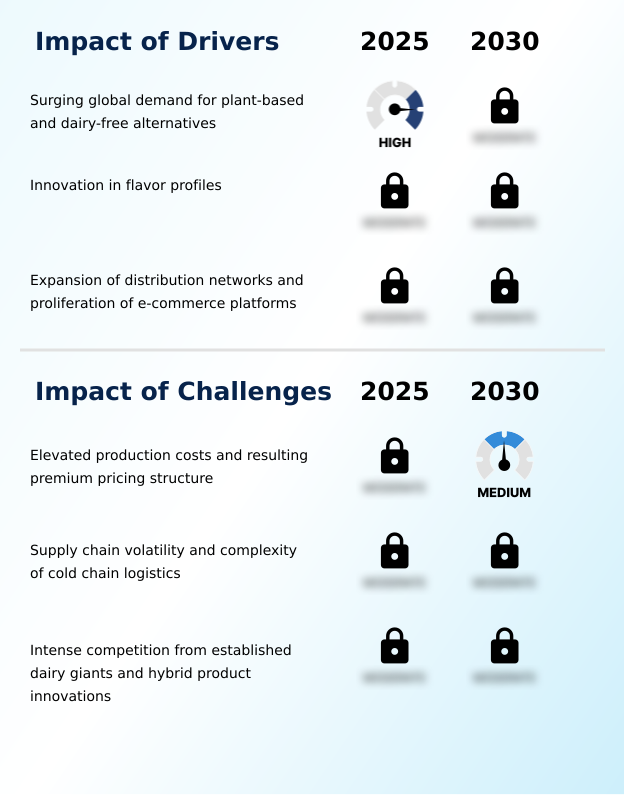
Our researchers analyzed the data with 2025 as the base year, along with the key drivers, trends, and challenges. A holistic analysis of drivers will help companies refine their marketing strategies to gain a competitive advantage.

  • The future of the global vegan popsicles market will be defined by specialization and targeted product development. Success hinges on understanding the nuances of consumer demand, from the best creamy plant-based popsicles to low-calorie vegan fruit bars. Brands that effectively communicate the benefits of functional ingredients in frozen desserts and adaptogens in snacks will capture the wellness-focused segment.
  • Concurrently, sustainability is a non-negotiable factor, where innovations in sustainable packaging for popsicles are becoming as important as the product itself. The marketing strategies for vegan desserts must highlight these differentiators, whether it is offering gourmet vegan popsicle flavors, dairy-free desserts for kids, or vegan popsicles with no added sugar.
  • In-depth consumer education, such as comparing oat milk vs coconut milk popsicles, can build trust and brand loyalty. Operationally, mitigating the impact of cold chain on vegan desserts is critical; companies using advanced monitoring have seen spoilage rates drop by over 15% compared to traditional logistics.
  • The growth of artisanal vegan popsicles, especially those offering high-protein snacks for athletes, underscores the premiumization trends in frozen treats. As online distribution of frozen snacks expands, even niche products can achieve broad reach, intensifying the need for clean label vegan dessert brands to stand out.
  • Ultimately, the market is a battleground of plant-based alternatives to dairy ice cream, where both emerging tropical fruit popsicle flavors and the use of natural sweeteners in frozen desserts play a crucial role in overcoming challenges in vegan popsicle production.

What are the key market drivers leading to the rise in the adoption of Vegan Popsicles Industry?

  • A key market driver is the surging global demand for plant-based and dairy-free alternatives, fueled by evolving consumer health and ethical preferences.

  • Market growth is significantly driven by consumer demand for ethical dessert options and sustainable frozen desserts.
  • This is reflected in the emphasis on clean-label ingredients and transparent, sustainable sourcing practices, with products featuring fair-trade certified ingredients seeing a 15% increase in consumer trust scores.
  • The expansion of direct-to-consumer frozen foods and other online channels has broadened market access, with e-commerce platforms reporting a sales velocity for plant-based snack innovations that is 40% higher than in traditional retail.
  • Furthermore, the adoption of eco-friendly food packaging, such as biodegradable packaging materials, reinforces brand integrity.
  • The industry's ability to cater to both strict vegans and a growing number of flexitarian dessert choices, particularly those seeking lactose-free frozen desserts, through diverse plant-based milk alternatives underpins its robust expansion.
  • Efficient cold chain logistics are essential to support this growth.

What are the market trends shaping the Vegan Popsicles Industry?

  • The market is witnessing a significant trend toward the proliferation of functional ingredients. This shift is driven by a focus on wellness-centric formulations that offer added health benefits.

  • Key trends are reshaping the market as products evolve from simple treats to functional foods. The premiumization strategy is evident, with a focus on gourmet popsicles featuring unique gourmet flavor profiles and botanical infusions that deliver a sophisticated sensory experience. This shift is supported by consumer demand for wellness-centric formulations, leading to the rise of adaptogen-infused treats and probiotic-fortified snacks.
  • Brands that incorporate these functional ingredients report a 20% higher social media engagement rate. Continuous innovation in texture enhancement for these fortified frozen snacks is crucial, as premium plant-based desserts are expected to offer an indulgent mouthfeel.
  • This push toward specialty frozen desserts creates new avenues for growth, driven by evolving frozen dessert flavor trends and consumer desire for value-added products.

What challenges does the Vegan Popsicles Industry face during its growth?

  • A primary challenge affecting industry growth is the elevated production costs associated with premium ingredients, which results in a higher pricing structure for consumers.

  • The market faces considerable hurdles, primarily stemming from the high costs associated with premium and specialized production. The sourcing of high-quality, non-GMO certified ingredients for clean-label frozen desserts can increase raw material expenses by over 50% compared to conventional dairy inputs. This makes it difficult to price impulse-buy frozen snacks competitively.
  • Furthermore, developing effective allergen-free formulation that also delivers on taste and texture requires significant investment in emulsification technology. The push for sustainability adds another layer of expense, as the adoption of compostable wrappers and processes supporting water usage reduction in artisanal production methods impacts margins.
  • These factors challenge the scalability of artisanal frozen novelties and non-dairy frozen alternatives, making it difficult for smaller brands to compete with the organic frozen confectionery lines of larger, established players, especially when targeting consumers seeking allergy-friendly frozen snacks.

Exclusive Technavio Analysis on Customer Landscape

The vegan popsicles market forecasting report includes the adoption lifecycle of the market, covering from the innovator’s stage to the laggard’s stage. It focuses on adoption rates in different regions based on penetration. Furthermore, the vegan popsicles market report also includes key purchase criteria and drivers of price sensitivity to help companies evaluate and develop their market growth analysis strategies.

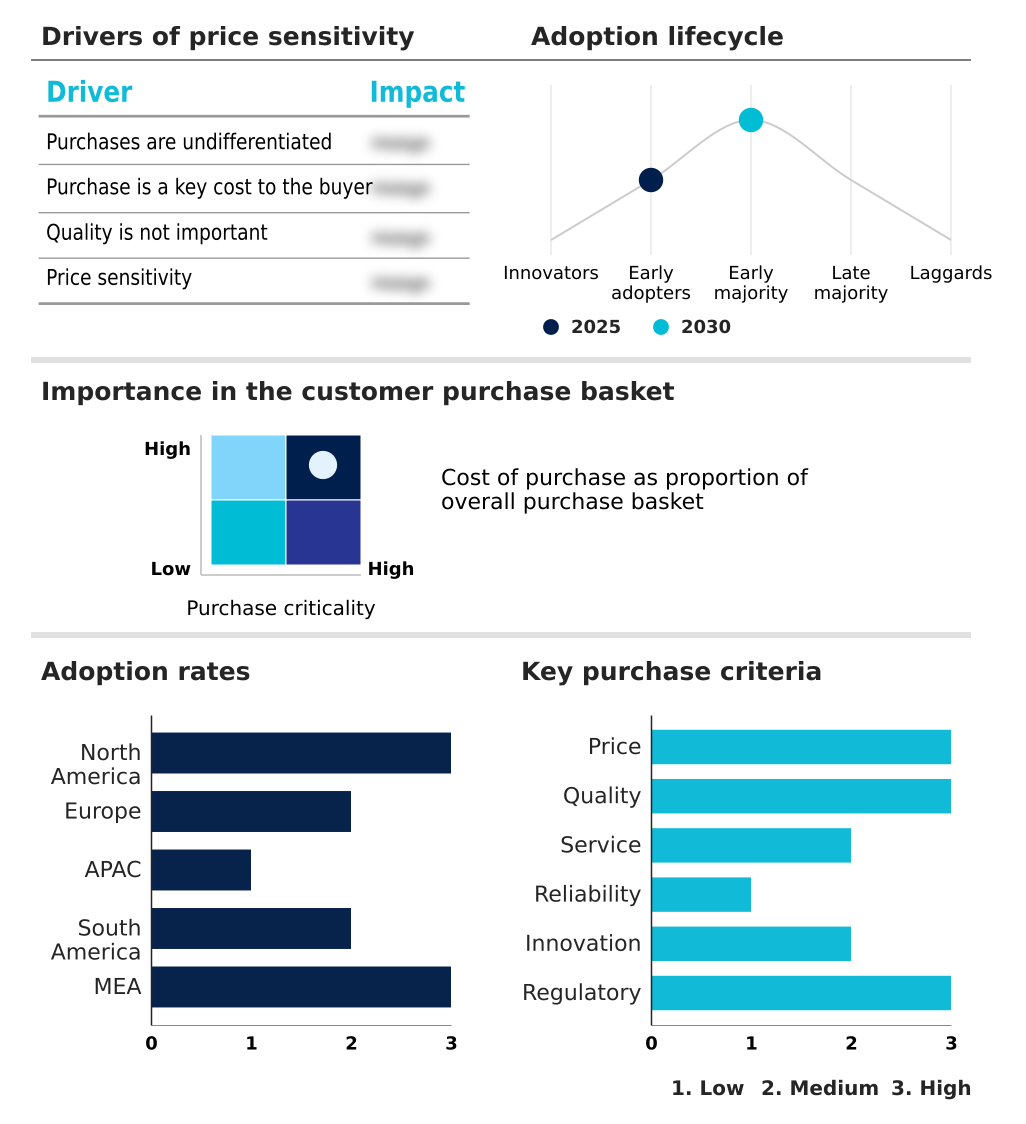
Customer Landscape of Vegan Popsicles Industry

Competitive Landscape

Companies are implementing various strategies, such as strategic alliances, vegan popsicles market forecast, partnerships, mergers and acquisitions, geographical expansion, and product/service launches, to enhance their presence in the industry.

Arctic Zero Inc. - Offerings are defined by sophisticated plant-based milk alternatives and premium natural ingredients, creating advanced formulations for the frozen dessert category.

The industry research and growth report includes detailed analyses of the competitive landscape of the market and information about key companies, including:

  • Arctic Zero Inc.
  • Daiya Foods Inc.
  • Danone S.A.
  • DeeBee's Organics
  • Froneri International Ltd.
  • General Mills Inc.
  • GoodPop
  • Imuraya Group
  • Jolly Llama
  • JonnyPops
  • NadaMoo
  • Nestle SA
  • Oatly Group AB
  • Sambazon Inc.
  • Trader Joes
  • Unilever PLC
  • Wells Enterprises Inc.

Qualitative and quantitative analysis of companies has been conducted to help clients understand the wider business environment as well as the strengths and weaknesses of key industry players. Data is qualitatively analyzed to categorize companies as pure play, category-focused, industry-focused, and diversified; it is quantitatively analyzed to categorize companies as dominant, leading, strong, tentative, and weak.

Recent Development and News in Vegan popsicles market

  • In February 2025, House of Pops signed a strategic alliance with the Majid Al Futtaim group to expand its plant-based wellness pops distribution across Carrefour hypermarkets in the GCC.
  • In February 2025, Danone-owned Alpro launched its first-ever high-protein vegan popsicle line in France and the UK, targeting the health-conscious frozen snack segment.
  • In March 2025, the International Trade Organization implemented new refrigerated transport regulations mandating a significant reduction in the carbon emissions of cooling units, impacting freight rates for frozen confectionery products.
  • In November 2024, a leading multinational food corporation acquired a prominent artisanal brand known for its oat milk-based frozen bars, signaling a strategic move to capture the premium, creamy plant-based market segment.

Dive into Technavio’s robust research methodology, blending expert interviews, extensive data synthesis, and validated models for unparalleled Vegan Popsicles Market insights. See full methodology.

Market Scope
Page number 291
Base year 2025
Historic period 2020-2024
Forecast period 2026-2030
Growth momentum & CAGR Accelerate at a CAGR of 15.6%
Market growth 2026-2030 USD 106285.5 thousand
Market structure Fragmented
YoY growth 2025-2026(%) 14.9%
Key countries US, Canada, Mexico, Germany, UK, France, Italy, The Netherlands, Spain, China, India, Japan, South Korea, Australia, Indonesia, Brazil, Argentina, Colombia, Saudi Arabia, UAE, South Africa, Israel and Turkey
Competitive landscape Leading Companies, Market Positioning of Companies, Competitive Strategies, and Industry Risks

Request Free Sample

Research Analyst Overview

  • The vegan popsicles market's architecture is built on advanced food science and complex supply chains. Key developments center on plant protein stabilization and emulsification technology, which are critical for texture enhancement in dairy-free frozen novelties. Ingredients such as fruit puree concentrate, plant-based milk alternatives like oat milk frozen dessert, and natural sweeteners like agave nectar define product quality.
  • Boardroom decisions are heavily influenced by production cost challenges, as the pursuit of clean-label ingredients and non-GMO certification drives up expenses, with premium offerings often priced more than double their dairy counterparts.
  • A major strategic focus is sustainable sourcing practices, including the use of fair-trade certified ingredients and materials like biodegradable packaging materials and compostable wrappers, which aligns with brand values but requires significant capital investment. Navigating cold chain logistics for temperature-sensitive ingredients, from acai berry sorbet to products made with a coconut milk base, remains a core operational challenge.
  • Consequently, companies must balance innovation in areas like botanical infusions and functional ingredients with the economic realities of artisanal production methods and plant-based fat stabilization.

What are the Key Data Covered in this Vegan Popsicles Market Research and Growth Report?

  • What is the expected growth of the Vegan Popsicles Market between 2026 and 2030?

    • USD 106.29 million, at a CAGR of 15.6%

  • What segmentation does the market report cover?

    • The report is segmented by Type (Fruit-based, and Creamy plant-based), Flavor (Fruit, Tropical, and Exotic), Distribution Channel (Supermarkets and hypermarkets, Online, and Convenience stores) and Geography (North America, Europe, APAC, South America, Middle East and Africa)

  • Which regions are analyzed in the report?

    • North America, Europe, APAC, South America and Middle East and Africa

  • What are the key growth drivers and market challenges?

    • Surging global demand for plant-based and dairy-free alternatives, Elevated production costs and resulting premium pricing structure

  • Who are the major players in the Vegan Popsicles Market?

    • Arctic Zero Inc., Daiya Foods Inc., Danone S.A., DeeBee's Organics, Froneri International Ltd., General Mills Inc., GoodPop, Imuraya Group, Jolly Llama, JonnyPops, NadaMoo, Nestle SA, Oatly Group AB, Sambazon Inc., Trader Joes, Unilever PLC and Wells Enterprises Inc.

Market Research Insights

  • Market dynamics are shaped by consumer demand for healthy frozen snacks that double as indulgent vegan treats and ethical dessert options. The availability of diverse plant-based confectionery, from simple organic frozen confectionery to gourmet popsicles, caters to a wide audience, including those seeking allergy-friendly frozen snacks and lactose-free frozen desserts.
  • While these non-dairy frozen alternatives appeal to flexitarian dessert choices, they often carry a premium price, costing up to 50% more than dairy-based counterparts. To justify this, brands focus on superior quality and experience, with data showing that improvements in texture for dairy-free ice cream bars can boost repeat customer rates by over 25%.
  • This innovation imperative is crucial for capturing impulse-buy frozen snacks and building loyalty for specialty frozen desserts amid a competitive landscape of plant-based snack innovations.

We can help! Our analysts can customize this vegan popsicles market research report to meet your requirements.

Get in touch

1. Executive Summary

1.1 Market overview

Executive Summary - Chart on Market Overview
Executive Summary - Data Table on Market Overview
Executive Summary - Chart on Global Market Characteristics
Executive Summary - Chart on Market by Geography
Executive Summary - Chart on Market Segmentation by Type
Executive Summary - Chart on Market Segmentation by Flavor
Executive Summary - Chart on Market Segmentation by Distribution Channel
Executive Summary - Chart on Incremental Growth
Executive Summary - Data Table on Incremental Growth
Executive Summary - Chart on Company Market Positioning

2. Technavio Analysis

2.1 Analysis of price sensitivity, lifecycle, customer purchase basket, adoption rates, and purchase criteria

2.2 Criticality of inputs and Factors of differentiation

Chart on Overview on criticality of inputs and factors of differentiation

2.3 Factors of disruption

Chart on Overview on factors of disruption

2.4 Impact of drivers and challenges

Chart on Impact of drivers and challenges in 2025 and 2030

3. Market Landscape

3.1 Market ecosystem

Chart on Parent Market
Data Table on - Parent Market

3.2 Market characteristics

Chart on Market characteristics analysis

3.3 Value chain analysis

Chart on Value chain analysis

4. Market Sizing

4.1 Market definition

Data Table on Offerings of companies included in the market definition

4.2 Market segment analysis

Market segments

4.3 Market size 2025

4.4 Market outlook: Forecast for 2025-2030

Chart on Global - Market size and forecast 2025-2030 ($ thousand)
Data Table on Global - Market size and forecast 2025-2030 ($ thousand)
Chart on Global Market: Year-over-year growth 2025-2030 (%)
Data Table on Global Market: Year-over-year growth 2025-2030 (%)

5. Historic Market Size

5.1 Global Vegan Popsicles Market 2020 - 2024

Historic Market Size - Data Table on Global Vegan Popsicles Market 2020 - 2024 ($ thousand)

5.2 Type segment analysis 2020 - 2024

Historic Market Size - Type Segment 2020 - 2024 ($ thousand)

5.3 Flavor segment analysis 2020 - 2024

Historic Market Size - Flavor Segment 2020 - 2024 ($ thousand)

5.4 Distribution Channel segment analysis 2020 - 2024

Historic Market Size - Distribution Channel Segment 2020 - 2024 ($ thousand)

5.5 Geography segment analysis 2020 - 2024

Historic Market Size - Geography Segment 2020 - 2024 ($ thousand)

5.6 Country segment analysis 2020 - 2024

Historic Market Size - Country Segment 2020 - 2024 ($ thousand)

6. Qualitative Analysis

6.1 Impact of AI on the Global Vegan Popsicles Market

7. Five Forces Analysis

7.1 Five forces summary

Five forces analysis - Comparison between 2025 and 2030

7.2 Bargaining power of buyers

Bargaining power of buyers - Impact of key factors 2025 and 2030

7.3 Bargaining power of suppliers

Bargaining power of suppliers - Impact of key factors in 2025 and 2030

7.4 Threat of new entrants

Threat of new entrants - Impact of key factors in 2025 and 2030

7.5 Threat of substitutes

Threat of substitutes - Impact of key factors in 2025 and 2030

7.6 Threat of rivalry

Threat of rivalry - Impact of key factors in 2025 and 2030

7.7 Market condition

Chart on Market condition - Five forces 2025 and 2030

8. Market Segmentation by Type

8.1 Market segments

Chart on Type - Market share 2025-2030 (%)
Data Table on Type - Market share 2025-2030 (%)

8.2 Comparison by Type

Chart on Comparison by Type
Data Table on Comparison by Type

8.3 Fruit-based - Market size and forecast 2025-2030

Chart on Fruit-based - Market size and forecast 2025-2030 ($ thousand)
Data Table on Fruit-based - Market size and forecast 2025-2030 ($ thousand)
Chart on Fruit-based - Year-over-year growth 2025-2030 (%)
Data Table on Fruit-based - Year-over-year growth 2025-2030 (%)

8.4 Creamy plant-based - Market size and forecast 2025-2030

Chart on Creamy plant-based - Market size and forecast 2025-2030 ($ thousand)
Data Table on Creamy plant-based - Market size and forecast 2025-2030 ($ thousand)
Chart on Creamy plant-based - Year-over-year growth 2025-2030 (%)
Data Table on Creamy plant-based - Year-over-year growth 2025-2030 (%)

8.5 Market opportunity by Type

Market opportunity by Type ($ thousand)
Data Table on Market opportunity by Type ($ thousand)

9. Market Segmentation by Flavor

9.1 Market segments

Chart on Flavor - Market share 2025-2030 (%)
Data Table on Flavor - Market share 2025-2030 (%)

9.2 Comparison by Flavor

Chart on Comparison by Flavor
Data Table on Comparison by Flavor

9.3 Fruit - Market size and forecast 2025-2030

Chart on Fruit - Market size and forecast 2025-2030 ($ thousand)
Data Table on Fruit - Market size and forecast 2025-2030 ($ thousand)
Chart on Fruit - Year-over-year growth 2025-2030 (%)
Data Table on Fruit - Year-over-year growth 2025-2030 (%)

9.4 Tropical - Market size and forecast 2025-2030

Chart on Tropical - Market size and forecast 2025-2030 ($ thousand)
Data Table on Tropical - Market size and forecast 2025-2030 ($ thousand)
Chart on Tropical - Year-over-year growth 2025-2030 (%)
Data Table on Tropical - Year-over-year growth 2025-2030 (%)

9.5 Exotic - Market size and forecast 2025-2030

Chart on Exotic - Market size and forecast 2025-2030 ($ thousand)
Data Table on Exotic - Market size and forecast 2025-2030 ($ thousand)
Chart on Exotic - Year-over-year growth 2025-2030 (%)
Data Table on Exotic - Year-over-year growth 2025-2030 (%)

9.6 Market opportunity by Flavor

Market opportunity by Flavor ($ thousand)
Data Table on Market opportunity by Flavor ($ thousand)

10. Market Segmentation by Distribution Channel

10.1 Market segments

Chart on Distribution Channel - Market share 2025-2030 (%)
Data Table on Distribution Channel - Market share 2025-2030 (%)

10.2 Comparison by Distribution Channel

Chart on Comparison by Distribution Channel
Data Table on Comparison by Distribution Channel

10.3 Supermarkets and hypermarkets - Market size and forecast 2025-2030

Chart on Supermarkets and hypermarkets - Market size and forecast 2025-2030 ($ thousand)
Data Table on Supermarkets and hypermarkets - Market size and forecast 2025-2030 ($ thousand)
Chart on Supermarkets and hypermarkets - Year-over-year growth 2025-2030 (%)
Data Table on Supermarkets and hypermarkets - Year-over-year growth 2025-2030 (%)

10.4 Online - Market size and forecast 2025-2030

Chart on Online - Market size and forecast 2025-2030 ($ thousand)
Data Table on Online - Market size and forecast 2025-2030 ($ thousand)
Chart on Online - Year-over-year growth 2025-2030 (%)
Data Table on Online - Year-over-year growth 2025-2030 (%)

10.5 Convenience stores - Market size and forecast 2025-2030

Chart on Convenience stores - Market size and forecast 2025-2030 ($ thousand)
Data Table on Convenience stores - Market size and forecast 2025-2030 ($ thousand)
Chart on Convenience stores - Year-over-year growth 2025-2030 (%)
Data Table on Convenience stores - Year-over-year growth 2025-2030 (%)

10.6 Market opportunity by Distribution Channel

Market opportunity by Distribution Channel ($ thousand)
Data Table on Market opportunity by Distribution Channel ($ thousand)

11. Customer Landscape

11.1 Customer landscape overview

Analysis of price sensitivity, lifecycle, customer purchase basket, adoption rates, and purchase criteria

12. Geographic Landscape

12.1 Geographic segmentation

Chart on Market share by geography 2025-2030 (%)
Data Table on Market share by geography 2025-2030 (%)

12.2 Geographic comparison

Chart on Geographic comparison
Data Table on Geographic comparison

12.3 North America - Market size and forecast 2025-2030

Chart on North America - Market size and forecast 2025-2030 ($ thousand)
Data Table on North America - Market size and forecast 2025-2030 ($ thousand)
Chart on North America - Year-over-year growth 2025-2030 (%)
Data Table on North America - Year-over-year growth 2025-2030 (%)
Chart on Regional Comparison - North America
Data Table on Regional Comparison - North America

12.3.1 US - Market size and forecast 2025-2030

Chart on US - Market size and forecast 2025-2030 ($ thousand)
Data Table on US - Market size and forecast 2025-2030 ($ thousand)
Chart on US - Year-over-year growth 2025-2030 (%)
Data Table on US - Year-over-year growth 2025-2030 (%)

12.3.2 Canada - Market size and forecast 2025-2030

Chart on Canada - Market size and forecast 2025-2030 ($ thousand)
Data Table on Canada - Market size and forecast 2025-2030 ($ thousand)
Chart on Canada - Year-over-year growth 2025-2030 (%)
Data Table on Canada - Year-over-year growth 2025-2030 (%)

12.3.3 Mexico - Market size and forecast 2025-2030

Chart on Mexico - Market size and forecast 2025-2030 ($ thousand)
Data Table on Mexico - Market size and forecast 2025-2030 ($ thousand)
Chart on Mexico - Year-over-year growth 2025-2030 (%)
Data Table on Mexico - Year-over-year growth 2025-2030 (%)

12.4 Europe - Market size and forecast 2025-2030

Chart on Europe - Market size and forecast 2025-2030 ($ thousand)
Data Table on Europe - Market size and forecast 2025-2030 ($ thousand)
Chart on Europe - Year-over-year growth 2025-2030 (%)
Data Table on Europe - Year-over-year growth 2025-2030 (%)
Chart on Regional Comparison - Europe
Data Table on Regional Comparison - Europe

12.4.1 Germany - Market size and forecast 2025-2030

Chart on Germany - Market size and forecast 2025-2030 ($ thousand)
Data Table on Germany - Market size and forecast 2025-2030 ($ thousand)
Chart on Germany - Year-over-year growth 2025-2030 (%)
Data Table on Germany - Year-over-year growth 2025-2030 (%)

12.4.2 UK - Market size and forecast 2025-2030

Chart on UK - Market size and forecast 2025-2030 ($ thousand)
Data Table on UK - Market size and forecast 2025-2030 ($ thousand)
Chart on UK - Year-over-year growth 2025-2030 (%)
Data Table on UK - Year-over-year growth 2025-2030 (%)

12.4.3 France - Market size and forecast 2025-2030

Chart on France - Market size and forecast 2025-2030 ($ thousand)
Data Table on France - Market size and forecast 2025-2030 ($ thousand)
Chart on France - Year-over-year growth 2025-2030 (%)
Data Table on France - Year-over-year growth 2025-2030 (%)

12.4.4 Italy - Market size and forecast 2025-2030

Chart on Italy - Market size and forecast 2025-2030 ($ thousand)
Data Table on Italy - Market size and forecast 2025-2030 ($ thousand)
Chart on Italy - Year-over-year growth 2025-2030 (%)
Data Table on Italy - Year-over-year growth 2025-2030 (%)

12.4.5 The Netherlands - Market size and forecast 2025-2030

Chart on The Netherlands - Market size and forecast 2025-2030 ($ thousand)
Data Table on The Netherlands - Market size and forecast 2025-2030 ($ thousand)
Chart on The Netherlands - Year-over-year growth 2025-2030 (%)
Data Table on The Netherlands - Year-over-year growth 2025-2030 (%)

12.4.6 Spain - Market size and forecast 2025-2030

Chart on Spain - Market size and forecast 2025-2030 ($ thousand)
Data Table on Spain - Market size and forecast 2025-2030 ($ thousand)
Chart on Spain - Year-over-year growth 2025-2030 (%)
Data Table on Spain - Year-over-year growth 2025-2030 (%)

12.5 APAC - Market size and forecast 2025-2030

Chart on APAC - Market size and forecast 2025-2030 ($ thousand)
Data Table on APAC - Market size and forecast 2025-2030 ($ thousand)
Chart on APAC - Year-over-year growth 2025-2030 (%)
Data Table on APAC - Year-over-year growth 2025-2030 (%)
Chart on Regional Comparison - APAC
Data Table on Regional Comparison - APAC

12.5.1 China - Market size and forecast 2025-2030

Chart on China - Market size and forecast 2025-2030 ($ thousand)
Data Table on China - Market size and forecast 2025-2030 ($ thousand)
Chart on China - Year-over-year growth 2025-2030 (%)
Data Table on China - Year-over-year growth 2025-2030 (%)

12.5.2 India - Market size and forecast 2025-2030

Chart on India - Market size and forecast 2025-2030 ($ thousand)
Data Table on India - Market size and forecast 2025-2030 ($ thousand)
Chart on India - Year-over-year growth 2025-2030 (%)
Data Table on India - Year-over-year growth 2025-2030 (%)

12.5.3 Japan - Market size and forecast 2025-2030

Chart on Japan - Market size and forecast 2025-2030 ($ thousand)
Data Table on Japan - Market size and forecast 2025-2030 ($ thousand)
Chart on Japan - Year-over-year growth 2025-2030 (%)
Data Table on Japan - Year-over-year growth 2025-2030 (%)

12.5.4 South Korea - Market size and forecast 2025-2030

Chart on South Korea - Market size and forecast 2025-2030 ($ thousand)
Data Table on South Korea - Market size and forecast 2025-2030 ($ thousand)
Chart on South Korea - Year-over-year growth 2025-2030 (%)
Data Table on South Korea - Year-over-year growth 2025-2030 (%)

12.5.5 Australia - Market size and forecast 2025-2030

Chart on Australia - Market size and forecast 2025-2030 ($ thousand)
Data Table on Australia - Market size and forecast 2025-2030 ($ thousand)
Chart on Australia - Year-over-year growth 2025-2030 (%)
Data Table on Australia - Year-over-year growth 2025-2030 (%)

12.5.6 Indonesia - Market size and forecast 2025-2030

Chart on Indonesia - Market size and forecast 2025-2030 ($ thousand)
Data Table on Indonesia - Market size and forecast 2025-2030 ($ thousand)
Chart on Indonesia - Year-over-year growth 2025-2030 (%)
Data Table on Indonesia - Year-over-year growth 2025-2030 (%)

12.6 South America - Market size and forecast 2025-2030

Chart on South America - Market size and forecast 2025-2030 ($ thousand)
Data Table on South America - Market size and forecast 2025-2030 ($ thousand)
Chart on South America - Year-over-year growth 2025-2030 (%)
Data Table on South America - Year-over-year growth 2025-2030 (%)
Chart on Regional Comparison - South America
Data Table on Regional Comparison - South America

12.6.1 Brazil - Market size and forecast 2025-2030

Chart on Brazil - Market size and forecast 2025-2030 ($ thousand)
Data Table on Brazil - Market size and forecast 2025-2030 ($ thousand)
Chart on Brazil - Year-over-year growth 2025-2030 (%)
Data Table on Brazil - Year-over-year growth 2025-2030 (%)

12.6.2 Argentina - Market size and forecast 2025-2030

Chart on Argentina - Market size and forecast 2025-2030 ($ thousand)
Data Table on Argentina - Market size and forecast 2025-2030 ($ thousand)
Chart on Argentina - Year-over-year growth 2025-2030 (%)
Data Table on Argentina - Year-over-year growth 2025-2030 (%)

12.6.3 Colombia - Market size and forecast 2025-2030

Chart on Colombia - Market size and forecast 2025-2030 ($ thousand)
Data Table on Colombia - Market size and forecast 2025-2030 ($ thousand)
Chart on Colombia - Year-over-year growth 2025-2030 (%)
Data Table on Colombia - Year-over-year growth 2025-2030 (%)

12.7 Middle East and Africa - Market size and forecast 2025-2030

Chart on Middle East and Africa - Market size and forecast 2025-2030 ($ thousand)
Data Table on Middle East and Africa - Market size and forecast 2025-2030 ($ thousand)
Chart on Middle East and Africa - Year-over-year growth 2025-2030 (%)
Data Table on Middle East and Africa - Year-over-year growth 2025-2030 (%)
Chart on Regional Comparison - Middle East and Africa
Data Table on Regional Comparison - Middle East and Africa

12.7.1 Saudi Arabia - Market size and forecast 2025-2030

Chart on Saudi Arabia - Market size and forecast 2025-2030 ($ thousand)
Data Table on Saudi Arabia - Market size and forecast 2025-2030 ($ thousand)
Chart on Saudi Arabia - Year-over-year growth 2025-2030 (%)
Data Table on Saudi Arabia - Year-over-year growth 2025-2030 (%)

12.7.2 UAE - Market size and forecast 2025-2030

Chart on UAE - Market size and forecast 2025-2030 ($ thousand)
Data Table on UAE - Market size and forecast 2025-2030 ($ thousand)
Chart on UAE - Year-over-year growth 2025-2030 (%)
Data Table on UAE - Year-over-year growth 2025-2030 (%)

12.7.3 South Africa - Market size and forecast 2025-2030

Chart on South Africa - Market size and forecast 2025-2030 ($ thousand)
Data Table on South Africa - Market size and forecast 2025-2030 ($ thousand)
Chart on South Africa - Year-over-year growth 2025-2030 (%)
Data Table on South Africa - Year-over-year growth 2025-2030 (%)

12.7.4 Israel - Market size and forecast 2025-2030

Chart on Israel - Market size and forecast 2025-2030 ($ thousand)
Data Table on Israel - Market size and forecast 2025-2030 ($ thousand)
Chart on Israel - Year-over-year growth 2025-2030 (%)
Data Table on Israel - Year-over-year growth 2025-2030 (%)

12.7.5 Turkey - Market size and forecast 2025-2030

Chart on Turkey - Market size and forecast 2025-2030 ($ thousand)
Data Table on Turkey - Market size and forecast 2025-2030 ($ thousand)
Chart on Turkey - Year-over-year growth 2025-2030 (%)
Data Table on Turkey - Year-over-year growth 2025-2030 (%)

12.8 Market opportunity by geography

Market opportunity by geography ($ thousand)
Data Tables on Market opportunity by geography ($ thousand)

13. Drivers, Challenges, and Opportunity

13.1 Market drivers

Surging global demand for plant-based and dairy-free alternatives
Innovation in flavor profiles
Expansion of distribution networks and proliferation of e-commerce platforms

13.2 Market challenges

Elevated production costs and resulting premium pricing structure
Supply chain volatility and complexity of cold chain logistics
Intense competition from established dairy giants and hybrid product innovations

13.3 Impact of drivers and challenges

Impact of drivers and challenges in 2025 and 2030

13.4 Market opportunities

Proliferation of functional ingredients and wellness-centric formulations
Sustainability as core brand metric and packaging innovation
Premiumization through artisanal craftsmanship

14. Competitive Landscape

14.1 Overview

14.2

Overview on criticality of inputs and factors of differentiation

14.3 Landscape disruption

Overview on factors of disruption

14.4 Industry risks

Impact of key risks on business

15. Competitive Analysis

15.1 Companies profiled

Companies covered

15.2 Company ranking index

15.3 Market positioning of companies

Matrix on companies position and classification

15.4 Arctic Zero Inc.

Arctic Zero Inc. - Overview
Arctic Zero Inc. - Product / Service
Arctic Zero Inc. - Key offerings
SWOT

15.5 Daiya Foods Inc.

Daiya Foods Inc. - Overview
Daiya Foods Inc. - Product / Service
Daiya Foods Inc. - Key offerings
SWOT

15.6 Danone S.A.

Danone S.A. - Overview
Danone S.A. - Business segments
Danone S.A. - Key news
Danone S.A. - Key offerings
Danone S.A. - Segment focus
SWOT

15.7 DeeBee's Organics

DeeBee's Organics - Overview
DeeBee's Organics - Product / Service
DeeBee's Organics - Key offerings
SWOT

15.8 Froneri International Ltd.

Froneri International Ltd. - Overview
Froneri International Ltd. - Product / Service
Froneri International Ltd. - Key offerings
SWOT

15.9 General Mills Inc.

General Mills Inc. - Overview
General Mills Inc. - Business segments
General Mills Inc. - Key news
General Mills Inc. - Key offerings
General Mills Inc. - Segment focus
SWOT

15.10 GoodPop

GoodPop - Overview
GoodPop - Product / Service
GoodPop - Key offerings
SWOT

15.11 Imuraya Group

Imuraya Group - Overview
Imuraya Group - Product / Service
Imuraya Group - Key offerings
SWOT

15.12 Jolly Llama

Jolly Llama - Overview
Jolly Llama - Product / Service
Jolly Llama - Key offerings
SWOT

15.13 JonnyPops

JonnyPops - Overview
JonnyPops - Product / Service
JonnyPops - Key offerings
SWOT

15.14 Nestle SA

Nestle SA - Overview
Nestle SA - Business segments
Nestle SA - Key news
Nestle SA - Key offerings
Nestle SA - Segment focus
SWOT

15.15 Oatly Group AB

Oatly Group AB - Overview
Oatly Group AB - Product / Service
Oatly Group AB - Key news
Oatly Group AB - Key offerings
SWOT

15.16 Sambazon Inc.

Sambazon Inc. - Overview
Sambazon Inc. - Product / Service
Sambazon Inc. - Key offerings
SWOT

15.17 Unilever PLC

Unilever PLC - Overview
Unilever PLC - Business segments
Unilever PLC - Key offerings
Unilever PLC - Segment focus
SWOT

15.18 Wells Enterprises Inc.

Wells Enterprises Inc. - Overview
Wells Enterprises Inc. - Product / Service
Wells Enterprises Inc. - Key offerings
SWOT

16. Appendix

16.1 Scope of the report

Market definition
Objectives
Notes and caveats

16.2 Inclusions and exclusions checklist

Inclusions checklist
Exclusions checklist

16.3 Currency conversion rates for US$

16.4 Research methodology

16.5 Data procurement

Information sources

16.6 Data validation

16.7 Validation techniques employed for market sizing

16.8 Data synthesis

16.9 360 degree market analysis

16.10 List of abbreviations

Research Methodology

Technavio presents a detailed picture of the market by way of study, synthesis, and summation of data from multiple sources. The analysts have presented the various facets of the market with a particular focus on identifying the key industry influencers. The data thus presented is comprehensive, reliable, and the result of extensive research, both primary and secondary.

INFORMATION SOURCES

Primary sources

  • Manufacturers and suppliers
  • Channel partners
  • Industry experts
  • Strategic decision makers

Secondary sources

  • Industry journals and periodicals
  • Government data
  • Financial reports of key industry players
  • Historical data
  • Press releases

DATA ANALYSIS

Data Synthesis

  • Collation of data
  • Estimation of key figures
  • Analysis of derived insights

Data Validation

  • Triangulation with data models
  • Reference against proprietary databases
  • Corroboration with industry experts

REPORT WRITING

Qualitative

  • Market drivers
  • Market challenges
  • Market trends
  • Five forces analysis

Quantitative

  • Market size and forecast
  • Market segmentation
  • Geographical insights
  • Competitive landscape

Interested in this report?

Get your sample now to see our research methodology and insights!

Download Now

Frequently Asked Questions

Vegan Popsicles market growth will increase by USD 106285.5 thousand thousand during 2026-2030 .

The Vegan Popsicles market is expected to grow at a CAGR of 15.6% during 2026-2030 .

Vegan Popsicles market is segmented by Type (Fruit-based, Creamy plant-based) Flavor (Fruit, Tropical, Exotic) Distribution channel (Supermarkets and hypermarkets, Online, Convenience stores)

Arctic Zero Inc., Daiya Foods Inc., Danone S.A., DeeBee's Organics, Froneri International Ltd., General Mills Inc., GoodPop, Imuraya Group, Jolly Llama, JonnyPops, NadaMoo, Nestle SA, Oatly Group AB, Sambazon Inc., Trader Joes, Unilever PLC, Wells Enterprises Inc. are a few of the key vendors in the Vegan Popsicles market.

North America will register the highest growth rate of 35.9% among the other regions. Therefore, the Vegan Popsicles market in North America is expected to garner significant business opportunities for the vendors during the forecast period.

US, Canada, Mexico, Germany, UK, France, Italy, The Netherlands, Spain, China, India, Japan, South Korea, Australia, Indonesia, Brazil, Argentina, Colombia, Saudi Arabia, UAE, South Africa, Israel, Turkey

  • Surging global demand for plant-based and dairy-free alternatives is the driving factor this market.

The Vegan Popsicles market vendors should focus on grabbing business opportunities from the Type segment as it accounted for the largest market share in the base year.