Virtual Production Market Analysis North America, APAC, Europe, Middle East and Africa, South America - US, UK, China, Canada, France - Size and Forecast 2024-2028

Virtual Production Market Analysis North America, APAC, Europe, Middle East and Africa, South America - US, UK, China, Canada, France - Size and Forecast 2024-2028

Published: May 2024 174 Pages SKU: IRTNTR71436

Market Overview at a Glance

$3.91 B
Market Opportunity
21.48%
CAGR
17.41
YoY growth 2023-2024(%)

Virtual Production Market Size 2024-2028 

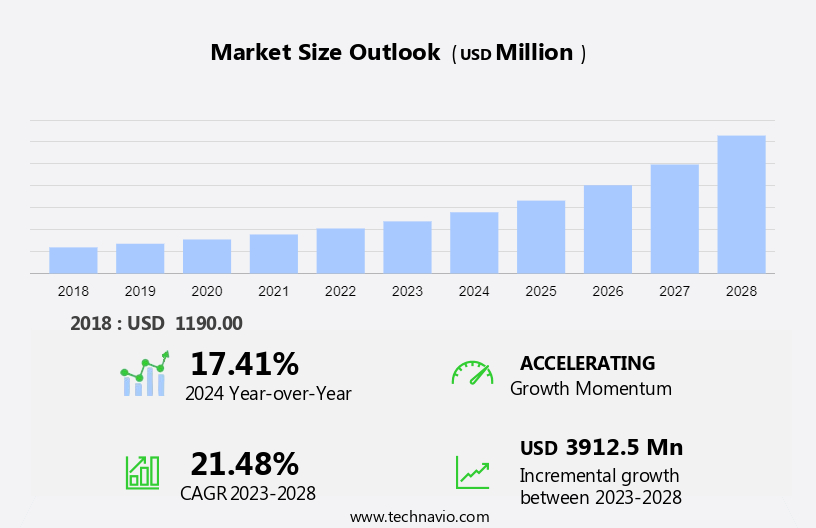
The virtual production market size is forecast to increase by USD 3.91 billion at a CAGR of 21.48% between 2023 and 2028.

  • The market is experiencing significant growth due to the increasing adoption of virtual production technologies in various industries, particularly in the gaming sector. This trend is driven by the ability of virtual production to offer more realistic and immersive experiences, reducing production costs, and enhancing creativity. Strategies such as product launches, mergers and acquisitions (M&A), collaborations, and partnerships are being employed by key players to expand their market presence and enhance their offerings. Moreover, the adoption of virtual production technology in the entertainment industry is driven by consumer preferences for more immersive and visually stunning content. However, challenges persist in the form of technical issues related to LED screens used in virtual production, which require continuous innovation and improvement to ensure high-quality output. Overall, the market is poised for robust growth, driven by these trends and the ongoing efforts to address the challenges associated with the technology.

What will be the Size of the Market During the Forecast Period?

Virtual Production Market Size

 Request Free Sample

  • Virtual production studios have revolutionized the way movies and television are produced by integrating virtual production technology into the entertainment industry. This innovative approach combines real-world filming with computer-generated imagery (CGI), allowing filmmakers to visualize and manipulate virtual environments in real-time. Visual effects (VFX) have become an integral part of modern storytelling, with virtual production technology playing a pivotal role in creating immersive and interactive experiences for audiences. Real-time rendering engines power virtual production studios, enabling filmmakers to see the effects of their creative decisions instantly. Virtual cameras offer unparalleled flexibility, allowing for complex camera movements and shots that would be difficult or impossible to achieve on set.
  • Virtual production software further enhances the process, providing tools for motion capture, lighting, and compositing. Virtual production studios are increasingly being used to create innovative and interactive experiences, blurring the lines between reality and fiction. Real-time rendering is a key component of virtual production technology, enabling filmmakers to make adjustments in real-time and streamline the production process. LED screens are also used to project virtual environments, providing a more realistic and immersive experience for actors and crew members.
  • The entertainment industry is continually exploring new applications for virtual production technology, from film and television to advertising and live events. Companies such as Adx Lab, Epic Games, Quantum Media Systems, DCI, Bel Air Circuit, and EBU are at the forefront of this technological evolution, pushing the boundaries of what is possible in virtual production. In conclusion, virtual production studios are transforming the way movies and television are produced, offering filmmakers the ability to create immersive and interactive experiences in real-time. The integration of virtual production technology into the entertainment industry is driven by consumer preferences and the ongoing pursuit of innovation.

How is this market segmented and which is the largest segment?

The market research report provides comprehensive data (region-wise segment analysis), with forecasts and estimates in "USD million" for the period 2024-2028, as well as historical data from 2018-2022 for the following segments.

  • Component
    • Software
    • Services
    • Hardware
  • Type
    • Post-production
    • Production
    • Pre-production
  • Geography
    • North America
      • Canada
      • US
    • APAC
      • China
    • Europe
      • UK
      • France
    • Middle East and Africa
    • South America

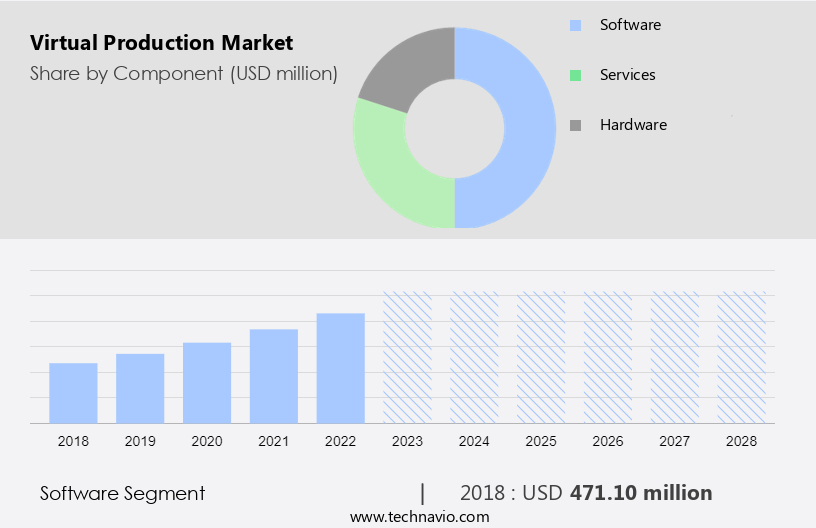
By Component Insights

  • The software segment is estimated to witness significant growth during the forecast period.

The market is experiencing significant growth due to the integration of advanced technologies such as deep learning and machine learning in VirtualFX (VFX) and Computer-Generated Imagery (CGI). These technologies enhance the resolution of virtual production by enabling denoising, improved asset indexing and retrieval, and neural rendering for performance transfer. In April 2023, Boris FX, a leading developer of visual effects plugins and video editing software, acquired CrumplePop, an innovative company specializing in AI-driven audio plugins and video plugins. This strategic acquisition will expand Boris FX's product lines, including Continuum, Sapphire, Silhouette, Optics, and Mocha Pro, making them more advanced and suitable for the evolving demands of the virtual production industry.

Virtual Production Market Size

Get a glance at the market report of share of various segments Request Free Sample

The software segment was valued at USD 471.10 million in 2018 and showed a gradual increase during the forecast period.

Regional Analysis

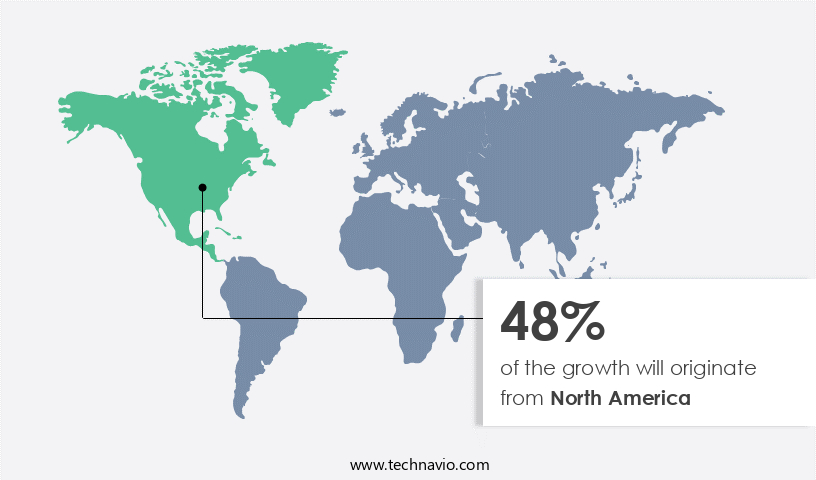
  • North America is estimated to contribute 48% to the growth of the global market during the forecast period.

Technavio's analysts have elaborately explained the regional trends and drivers that shape the market during the forecast period.

Virtual Production Market Share by Geography

For more insights on the market share of various regions Request Free Sample

The North American region leads The market due to the significant adoption of this technology in major film studios. Companies in this region have invested heavily in research and development to innovate advanced virtual production software solutions, fueling market growth. Furthermore, the film industry in North America has seen an increase in production budgets and the utilization of virtual effects, particularly in Hollywood. The shift towards streaming platforms for movie consumption since 2022 has enabled filmmakers to reach a larger audience, thereby driving market expansion in North America during the forecast period. Virtual production is revolutionizing film, television, and gaming industries in the region, offering immersive and interactive experiences for consumers.

Market Dynamics

Our researchers analyzed the data with 2023 as the base year, along with the key drivers, trends, and challenges. A holistic analysis of drivers will help companies refine their marketing strategies to gain a competitive advantage.

What are the key market drivers leading to the rise in adoption of Virtual Production Market?

The growing implementation of virtual production in gaming industry is the key driver of the market.

  • Virtual production technology has revolutionized the entertainment industry, particularly in movies and television industries, by enabling the creation of immersive and interactive experiences. Virtual production studios utilize real-time rendering engines, virtual cameras, and virtual production software to generate computer-generated imagery (CGI), machine learning algorithms (ML), artificial intelligence (AI), augmented reality (AR), virtual reality (VR), and extended reality (XR). Filmmakers are increasingly adopting this technology to produce more engaging and cost-effective content. The market encompasses various components, including hardware, software, and services. High-performance computing, cameras, and VR/AR headsets are essential hardware components. Software includes virtual set design, post-production integration, and real-time rendering technologies.
  • Services include expertise in ML, AI, AR, VR, and XR. Virtual production is not limited to the film and television industries. It also finds applications in gaming, advertising, architecture, healthcare, virtual events, and live streaming. The entertainment industry's shift towards immersive and interactive experiences, driven by consumer preferences, is expected to fuel the growth of the market. LED screens, such as those provided by Leyard and Bel Air Circuit, are increasingly being used in virtual production. HDR-enabled LED walls by DCI and IMDA offer enhanced visual effects. Quantum Media Systems and Epic Games are pioneers in virtual production technology, providing advanced solutions for film, television, and gaming industries.

What are the market trends shaping the Virtual Production Market?

Adoption of strategies such as product launch, merger and acquisition (M and A), collaboration, and partnership is the upcoming trend in the market.

  • Virtual production studios are revolutionizing the entertainment industry by integrating advanced technologies such as real-time rendering engines, virtual cameras, and virtual production software to create immersive experiences for movies and television industries. Filmmakers are leveraging these technologies to produce high-quality visual effects (VFX) and computer-generated imagery (CGI) in real-time, reducing production time and costs. Virtual production technology is not limited to the film and television industries; it is also being adopted in gaming, advertising, architecture, healthcare, virtual events, and live streaming. Leading companies in the market, including ADX Lab, Epic Games, Quantum Media Systems, DCI, Bel Air Circuit, EBU, Leyard, IMDA, and Studio Fares, are investing in high-performance computing, LED screens, and HDR-enabled LED walls to enhance virtual production capabilities.
  • Machine learning algorithms and artificial intelligence (AI) are being integrated into virtual production software to improve efficiency and accuracy. Virtual production technology is also enabling the creation of interactive experiences, such as augmented reality (AR) and virtual reality (VR), for consumers. The market is expected to grow significantly in the coming years due to increasing consumer preferences for immersive experiences and the cost efficiencies offered by virtual production. Some companies in the market are adopting strategies such as mergers and acquisitions, collaboration, and partnerships to gain a competitive advantage and increase market share. For instance, Autodesk Inc. Acquired PIX of X2X to foster broader collaboration and communication and drive greater efficiencies in the virtual production process.

What challenges does the Virtual Production Market face during its growth?

Issues associated with the virtual production of LED screens are a key challenge affecting market growth.

  • Virtual production studios have increasingly adopted LED screens as a key component in their production process for movies and television industries. However, the implementation of LED walls faces challenges such as the ghosting effect and cross pattern formation. The ghosting effect occurs due to the charging and discharging of parasitic capacitance in column changes on the screen, resulting in LEDs lighting up unintentionally. This issue is particularly noticeable in low grayscale images and time-multiplexing designs. Another challenge is the cross pattern formed by failed LEDs in an LED display, which can be confusing for end-users. These problems hinder the growth of The market.
  • Virtual production technology, including real-time rendering engines, virtual cameras, and VFX software, relies on advanced technologies like machine learning algorithms, AI, AR, VR, XR, deep learning, and high-performance computing. The entertainment industry, including film, television, gaming, advertising, architecture, healthcare, virtual events, and live streaming, benefits from virtual production. Companies such as ADX Lab, Epic Games, Quantum Media Systems, DCI, Bel Air Circuit, EBU, Leyard, IMDA, and Studio Fares provide expertise and services in virtual production. Despite these challenges, the market for virtual production continues to evolve, with advancements in HDR-enabled LED walls and real-time rendering technologies. Cost efficiencies and product applications in various industries drive the demand for virtual production.

Exclusive Customer Landscape

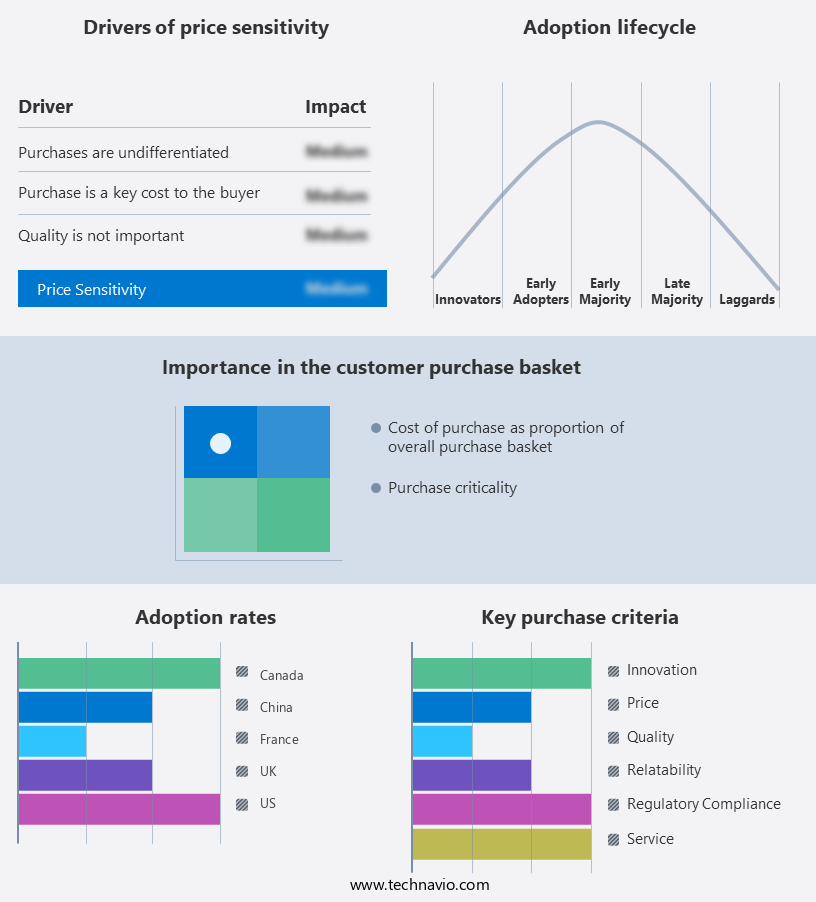
The market forecasting report includes the adoption lifecycle of the market, covering from the innovator's stage to the laggard's stage. It focuses on adoption rates in different regions based on penetration. Furthermore, the market report also includes key purchase criteria and drivers of price sensitivity to help companies evaluate and develop their market growth analysis strategies.

Virtual Production Market Share by Geography

 Customer Landscape

Key Companies & Market Insights

Companies are implementing various strategies, such as strategic alliances, market forecast, partnerships, mergers and acquisitions, geographical expansion, and product/service launches, to enhance their presence in the market.

The market research and growth report includes detailed analyses of the competitive landscape of the market and information about key companies, including:

  • 360Rize
  • Adobe Inc.
  • Arashi Vision Co. Ltd.
  • Autodesk Inc.
  • BORIS FX Inc.
  • Brompton Technology Ltd.
  • Deloitte Touche Tohmatsu Ltd.
  • Epic Games Inc.
  • HTC Corp.
  • Humaneyes Technologies Ltd.
  • Mo Sys Engineering Ltd.
  • NVIDIA Corp.
  • Panocam3d.com
  • ROE Visual Co. Ltd.
  • Side Effects Software Inc.
  • Technicolor SA
  • The Walt Disney Co.
  • Unity Technologies Inc.
  • Vicon Motion Systems Ltd.
  • Weta Digital Ltd.

Qualitative and quantitative analysis of companies has been conducted to help clients understand the wider business environment as well as the strengths and weaknesses of key market players. Data is qualitatively analyzed to categorize companies as pure play, category-focused, industry-focused, and diversified; it is quantitatively analyzed to categorize companies as dominant, leading, strong, tentative, and weak.

Research Analyst Overview

The market is experiencing significant growth as technology continues to advance, transforming the way content is created for movies, television industries, and various other industries. Virtual production studios leverage virtual production technology, real-time rendering engines, virtual cameras, and virtual production software to produce high-quality visual effects (VFX), computer-generated imagery (CGI), and immersive experiences. Filmmakers are increasingly adopting virtual production techniques to streamline the production phase, enabling them to visualize and modify scenes in real-time. Virtual production technology offers numerous benefits, including cost efficiencies, enhanced creativity, and the ability to produce content more quickly. Real-time rendering engines play a crucial role in virtual production by enabling the generation of photorealistic images and animations in real-time. These engines are used in conjunction with virtual cameras, which can be programmed to mimic the behavior of traditional film cameras, providing filmmakers with a familiar workflow. Virtual production software is another essential component of virtual production studios. It enables the integration of CGI, motion capture, and other visual effects into live-action footage, creating a seamless blend of real and virtual elements. Machine learning algorithms and artificial intelligence (AI) are also being integrated into virtual production software, enabling more efficient and accurate visual effects production. The entertainment industry is not the only sector benefiting from virtual production technology.

Moreover, the market is expected to continue growing as the demand for more immersive and interactive experiences increases. The market is segmented by component, including hardware, software, and services. High-performance computing, cameras, and VR/AR headsets are some of the key hardware components driving the market's growth. Virtual production technology is also being used to create virtual sets for television series and other platforms, enabling producers to create more complex and visually stunning productions without the need for physical sets. This is particularly beneficial for productions with limited budgets or those that require complex or dangerous environments. In conclusion, the market is transforming the entertainment industry and beyond, offering more immersive and interactive experiences for consumers. Virtual production technology is enabling filmmakers, advertisers, architects, healthcare professionals, and others to create high-quality content more efficiently and cost-effectively. The market is expected to continue growing as technology advances and consumer preferences shift towards more immersive and interactive experiences.

Market Scope

Report Coverage

Details

Page number

174

Base year

2023

Historic period

2018-2022

Forecast period

2024-2028

Growth momentum & CAGR

Accelerate at a CAGR of 21.48%

Market growth 2024-2028

USD 3.91 billion

Market structure

Fragmented

YoY growth 2023-2024(%)

17.41

Key countries

US, UK, China, Canada, and France

Competitive landscape

Leading Companies, Market Positioning of Companies, Competitive Strategies, and Industry Risks

Request Free Sample

What are the Key Data Covered in this Market Research and Growth Report?

  • CAGR of the market during the forecast period
  • Detailed information on factors that will drive the market growth and forecasting between 2024 and 2028
  • Precise estimation of the size of the market  and its contribution of the market in focus to the parent market
  • Accurate predictions about upcoming market growth and trends and changes in consumer behaviour
  • Growth of the market across North America, APAC, Europe, Middle East and Africa, and South America
  • Thorough analysis of the market's competitive landscape and detailed information about companies
  • Comprehensive analysis of factors that will challenge the growth of market companies

We can help! Our analysts can customize this market research report to meet your requirements. Get in touch

1 Executive Summary

  • 1.1 Market overview
    • Executive Summary - Chart on Market Overview
    • Executive Summary - Data Table on Market Overview
    • Executive Summary - Chart on Global Market Characteristics
    • Executive Summary - Chart on Market by Geography
    • Executive Summary - Chart on Market Segmentation by Component
    • Executive Summary - Chart on Market Segmentation by Type
    • Executive Summary - Chart on Incremental Growth
    • Executive Summary - Data Table on Incremental Growth
    • Executive Summary - Chart on Company Market Positioning

2 Market Landscape

  • 2.1 Market ecosystem
    • Parent Market
    • Data Table on - Parent Market
  • 2.2 Market characteristics
    • Market characteristics analysis
  • 2.3 Value chain analysis
    • Value Chain Analysis

3 Market Sizing

  • 3.1 Market definition
    • Offerings of companies included in the market definition
  • 3.2 Market segment analysis
    • Market segments
  • 3.3 Market size 2023
    • 3.4 Market outlook: Forecast for 2023-2028
      • Chart on Global - Market size and forecast 2023-2028 ($ million)
      • Data Table on Global - Market size and forecast 2023-2028 ($ million)
      • Chart on Global Market: Year-over-year growth 2023-2028 (%)
      • Data Table on Global Market: Year-over-year growth 2023-2028 (%)

    4 Historic Market Size

    • 4.1 Global Virtual Production Market 2018 - 2022
      • Historic Market Size - Data Table on Global Virtual Production Market 2018 - 2022 ($ million)
    • 4.2 Component segment analysis 2018 - 2022
      • Historic Market Size - Component Segment 2018 - 2022 ($ million)
    • 4.3 Type segment analysis 2018 - 2022
      • Historic Market Size - Type Segment 2018 - 2022 ($ million)
    • 4.4 Geography segment analysis 2018 - 2022
      • Historic Market Size - Geography Segment 2018 - 2022 ($ million)
    • 4.5 Country segment analysis 2018 - 2022
      • Historic Market Size - Country Segment 2018 - 2022 ($ million)

    5 Five Forces Analysis

    • 5.1 Five forces summary
      • Five forces analysis - Comparison between 2023 and 2028
    • 5.2 Bargaining power of buyers
      • Bargaining power of buyers - Impact of key factors 2023 and 2028
    • 5.3 Bargaining power of suppliers
      • Bargaining power of suppliers - Impact of key factors in 2023 and 2028
    • 5.4 Threat of new entrants
      • Threat of new entrants - Impact of key factors in 2023 and 2028
    • 5.5 Threat of substitutes
      • Threat of substitutes - Impact of key factors in 2023 and 2028
    • 5.6 Threat of rivalry
      • Threat of rivalry - Impact of key factors in 2023 and 2028
    • 5.7 Market condition
      • Chart on Market condition - Five forces 2023 and 2028

    6 Market Segmentation by Component

    • 6.1 Market segments
      • Chart on Component - Market share 2023-2028 (%)
      • Data Table on Component - Market share 2023-2028 (%)
    • 6.2 Comparison by Component
      • Chart on Comparison by Component
      • Data Table on Comparison by Component
    • 6.3 Software - Market size and forecast 2023-2028
      • Chart on Software - Market size and forecast 2023-2028 ($ million)
      • Data Table on Software - Market size and forecast 2023-2028 ($ million)
      • Chart on Software - Year-over-year growth 2023-2028 (%)
      • Data Table on Software - Year-over-year growth 2023-2028 (%)
    • 6.4 Services - Market size and forecast 2023-2028
      • Chart on Services - Market size and forecast 2023-2028 ($ million)
      • Data Table on Services - Market size and forecast 2023-2028 ($ million)
      • Chart on Services - Year-over-year growth 2023-2028 (%)
      • Data Table on Services - Year-over-year growth 2023-2028 (%)
    • 6.5 Hardware - Market size and forecast 2023-2028
      • Chart on Hardware - Market size and forecast 2023-2028 ($ million)
      • Data Table on Hardware - Market size and forecast 2023-2028 ($ million)
      • Chart on Hardware - Year-over-year growth 2023-2028 (%)
      • Data Table on Hardware - Year-over-year growth 2023-2028 (%)
    • 6.6 Market opportunity by Component
      • Market opportunity by Component ($ million)
      • Data Table on Market opportunity by Component ($ million)

    7 Market Segmentation by Type

    • 7.1 Market segments
      • Chart on Type - Market share 2023-2028 (%)
      • Data Table on Type - Market share 2023-2028 (%)
    • 7.2 Comparison by Type
      • Chart on Comparison by Type
      • Data Table on Comparison by Type
    • 7.3 Post-production - Market size and forecast 2023-2028
      • Chart on Post-production - Market size and forecast 2023-2028 ($ million)
      • Data Table on Post-production - Market size and forecast 2023-2028 ($ million)
      • Chart on Post-production - Year-over-year growth 2023-2028 (%)
      • Data Table on Post-production - Year-over-year growth 2023-2028 (%)
    • 7.4 Production - Market size and forecast 2023-2028
      • Chart on Production - Market size and forecast 2023-2028 ($ million)
      • Data Table on Production - Market size and forecast 2023-2028 ($ million)
      • Chart on Production - Year-over-year growth 2023-2028 (%)
      • Data Table on Production - Year-over-year growth 2023-2028 (%)
    • 7.5 Pre-production - Market size and forecast 2023-2028
      • Chart on Pre-production - Market size and forecast 2023-2028 ($ million)
      • Data Table on Pre-production - Market size and forecast 2023-2028 ($ million)
      • Chart on Pre-production - Year-over-year growth 2023-2028 (%)
      • Data Table on Pre-production - Year-over-year growth 2023-2028 (%)
    • 7.6 Market opportunity by Type
      • Market opportunity by Type ($ million)
      • Data Table on Market opportunity by Type ($ million)

    8 Customer Landscape

    • 8.1 Customer landscape overview
      • Analysis of price sensitivity, lifecycle, customer purchase basket, adoption rates, and purchase criteria

    9 Geographic Landscape

    • 9.1 Geographic segmentation
      • Chart on Market share by geography 2023-2028 (%)
      • Data Table on Market share by geography 2023-2028 (%)
    • 9.2 Geographic comparison
      • Chart on Geographic comparison
      • Data Table on Geographic comparison
    • 9.3 North America - Market size and forecast 2023-2028
      • Chart on North America - Market size and forecast 2023-2028 ($ million)
      • Data Table on North America - Market size and forecast 2023-2028 ($ million)
      • Chart on North America - Year-over-year growth 2023-2028 (%)
      • Data Table on North America - Year-over-year growth 2023-2028 (%)
    • 9.4 APAC - Market size and forecast 2023-2028
      • Chart on APAC - Market size and forecast 2023-2028 ($ million)
      • Data Table on APAC - Market size and forecast 2023-2028 ($ million)
      • Chart on APAC - Year-over-year growth 2023-2028 (%)
      • Data Table on APAC - Year-over-year growth 2023-2028 (%)
    • 9.5 Europe - Market size and forecast 2023-2028
      • Chart on Europe - Market size and forecast 2023-2028 ($ million)
      • Data Table on Europe - Market size and forecast 2023-2028 ($ million)
      • Chart on Europe - Year-over-year growth 2023-2028 (%)
      • Data Table on Europe - Year-over-year growth 2023-2028 (%)
    • 9.6 Middle East and Africa - Market size and forecast 2023-2028
      • Chart on Middle East and Africa - Market size and forecast 2023-2028 ($ million)
      • Data Table on Middle East and Africa - Market size and forecast 2023-2028 ($ million)
      • Chart on Middle East and Africa - Year-over-year growth 2023-2028 (%)
      • Data Table on Middle East and Africa - Year-over-year growth 2023-2028 (%)
    • 9.7 South America - Market size and forecast 2023-2028
      • Chart on South America - Market size and forecast 2023-2028 ($ million)
      • Data Table on South America - Market size and forecast 2023-2028 ($ million)
      • Chart on South America - Year-over-year growth 2023-2028 (%)
      • Data Table on South America - Year-over-year growth 2023-2028 (%)
    • 9.8 US - Market size and forecast 2023-2028
      • Chart on US - Market size and forecast 2023-2028 ($ million)
      • Data Table on US - Market size and forecast 2023-2028 ($ million)
      • Chart on US - Year-over-year growth 2023-2028 (%)
      • Data Table on US - Year-over-year growth 2023-2028 (%)
    • 9.9 China - Market size and forecast 2023-2028
      • Chart on China - Market size and forecast 2023-2028 ($ million)
      • Data Table on China - Market size and forecast 2023-2028 ($ million)
      • Chart on China - Year-over-year growth 2023-2028 (%)
      • Data Table on China - Year-over-year growth 2023-2028 (%)
    • 9.10 UK - Market size and forecast 2023-2028
      • Chart on UK - Market size and forecast 2023-2028 ($ million)
      • Data Table on UK - Market size and forecast 2023-2028 ($ million)
      • Chart on UK - Year-over-year growth 2023-2028 (%)
      • Data Table on UK - Year-over-year growth 2023-2028 (%)
    • 9.11 Canada - Market size and forecast 2023-2028
      • Chart on Canada - Market size and forecast 2023-2028 ($ million)
      • Data Table on Canada - Market size and forecast 2023-2028 ($ million)
      • Chart on Canada - Year-over-year growth 2023-2028 (%)
      • Data Table on Canada - Year-over-year growth 2023-2028 (%)
    • 9.12 France - Market size and forecast 2023-2028
      • Chart on France - Market size and forecast 2023-2028 ($ million)
      • Data Table on France - Market size and forecast 2023-2028 ($ million)
      • Chart on France - Year-over-year growth 2023-2028 (%)
      • Data Table on France - Year-over-year growth 2023-2028 (%)
    • 9.13 Market opportunity by geography
      • Market opportunity by geography ($ million)
      • Data Tables on Market opportunity by geography ($ million)

    10 Drivers, Challenges, and Opportunity/Restraints

    • 10.1 Market drivers
      • 10.2 Market challenges
        • 10.3 Impact of drivers and challenges
          • Impact of drivers and challenges in 2023 and 2028
        • 10.4 Market opportunities/restraints

          11 Competitive Landscape

          • 11.1 Overview
            • 11.2 Competitive Landscape
              • Overview on criticality of inputs and factors of differentiation
            • 11.3 Landscape disruption
              • Overview on factors of disruption
            • 11.4 Industry risks
              • Impact of key risks on business

            12 Competitive Analysis

            • 12.1 Companies profiled
              • Companies covered
            • 12.2 Market positioning of companies
              • Matrix on companies position and classification
            • 360Rize
              • 360Rize - Overview
              • 360Rize - Product / Service
              • 360Rize - Key offerings
            • 12.4 Adobe Inc.
              • Adobe Inc. - Overview
              • Adobe Inc. - Business segments
              • Adobe Inc. - Key news
              • Adobe Inc. - Key offerings
              • Adobe Inc. - Segment focus
            • 12.5 Arashi Vision Co. Ltd.
              • Arashi Vision Co. Ltd. - Overview
              • Arashi Vision Co. Ltd. - Product / Service
              • Arashi Vision Co. Ltd. - Key offerings
            • 12.6 Autodesk Inc.
              • Autodesk Inc. - Overview
              • Autodesk Inc. - Product / Service
              • Autodesk Inc. - Key news
              • Autodesk Inc. - Key offerings
            • 12.7 BORIS FX Inc.
              • BORIS FX Inc. - Overview
              • BORIS FX Inc. - Product / Service
              • BORIS FX Inc. - Key offerings
            • 12.8 Epic Games Inc.
              • Epic Games Inc. - Overview
              • Epic Games Inc. - Product / Service
              • Epic Games Inc. - Key offerings
            • 12.9 HTC Corp.
              • HTC Corp. - Overview
              • HTC Corp. - Product / Service
              • HTC Corp. - Key offerings
            • 12.10 Humaneyes Technologies Ltd.
              • Humaneyes Technologies Ltd. - Overview
              • Humaneyes Technologies Ltd. - Product / Service
              • Humaneyes Technologies Ltd. - Key offerings
            • 12.11 Mo Sys Engineering Ltd.
              • Mo Sys Engineering Ltd. - Overview
              • Mo Sys Engineering Ltd. - Product / Service
              • Mo Sys Engineering Ltd. - Key offerings
            • 12.12 NVIDIA Corp.
              • NVIDIA Corp. - Overview
              • NVIDIA Corp. - Business segments
              • NVIDIA Corp. - Key news
              • NVIDIA Corp. - Key offerings
              • NVIDIA Corp. - Segment focus
            • 12.13 Panocam3d.com
              • Panocam3d.com - Overview
              • Panocam3d.com - Product / Service
              • Panocam3d.com - Key offerings
            • 12.14 Side Effects Software Inc.
              • Side Effects Software Inc. - Overview
              • Side Effects Software Inc. - Product / Service
              • Side Effects Software Inc. - Key offerings
            • 12.15 Technicolor SA
              • Technicolor SA - Overview
              • Technicolor SA - Product / Service
              • Technicolor SA - Key offerings
            • 12.16 The Walt Disney Co.
              • The Walt Disney Co. - Overview
              • The Walt Disney Co. - Business segments
              • The Walt Disney Co. - Key news
              • The Walt Disney Co. - Key offerings
              • The Walt Disney Co. - Segment focus
            • 12.17 Vicon Motion Systems Ltd.
              • Vicon Motion Systems Ltd. - Overview
              • Vicon Motion Systems Ltd. - Product / Service
              • Vicon Motion Systems Ltd. - Key offerings

            13 Appendix

            • 13.1 Scope of the report
              • 13.2 Inclusions and exclusions checklist
                • Inclusions checklist
                • Exclusions checklist
              • 13.3 Currency conversion rates for US$
                • Currency conversion rates for US$
              • 13.4 Research methodology
                • Research methodology
              • 13.5 Data procurement
                • Information sources
              • 13.6 Data validation
                • Data validation
              • 13.7 Validation techniques employed for market sizing
                • Validation techniques employed for market sizing
              • 13.8 Data synthesis
                • Data synthesis
              • 13.9 360 degree market analysis
                • 360 degree market analysis
              • 13.10 List of abbreviations
                • List of abbreviations

              Research Methodology

              Technavio presents a detailed picture of the market by way of study, synthesis, and summation of data from multiple sources. The analysts have presented the various facets of the market with a particular focus on identifying the key industry influencers. The data thus presented is comprehensive, reliable, and the result of extensive research, both primary and secondary.

              INFORMATION SOURCES

              Primary sources

              • Manufacturers and suppliers
              • Channel partners
              • Industry experts
              • Strategic decision makers

              Secondary sources

              • Industry journals and periodicals
              • Government data
              • Financial reports of key industry players
              • Historical data
              • Press releases

              DATA ANALYSIS

              Data Synthesis

              • Collation of data
              • Estimation of key figures
              • Analysis of derived insights

              Data Validation

              • Triangulation with data models
              • Reference against proprietary databases
              • Corroboration with industry experts

              REPORT WRITING

              Qualitative

              • Market drivers
              • Market challenges
              • Market trends
              • Five forces analysis

              Quantitative

              • Market size and forecast
              • Market segmentation
              • Geographical insights
              • Competitive landscape

              Interested in this report?

              Get your sample now to see our research methodology and insights!

              Download Now

              Frequently Asked Questions

              Virtual Production market growth will increase by $ 3912.5 mn during 2024-2028.

              The Virtual Production market is expected to grow at a CAGR of 21.48% during 2024-2028.

              Virtual Production market is segmented by Component( Software, Services, Hardware) Type( Post-production, Production, Pre-production)

              360Rize, Adobe Inc., Arashi Vision Co. Ltd., Autodesk Inc., BORIS FX Inc., Brompton Technology Ltd., Deloitte Touche Tohmatsu Ltd., Epic Games Inc., HTC Corp., Humaneyes Technologies Ltd., Mo Sys Engineering Ltd., NVIDIA Corp., Panocam3d.com, ROE Visual Co. Ltd., Side Effects Software Inc., Technicolor SA, The Walt Disney Co., Unity Technologies Inc., Vicon Motion Systems Ltd., Weta Digital Ltd. are a few of the key vendors in the Virtual Production market.

              North America will register the highest growth rate of 48% among the other regions. Therefore, the Virtual Production market in North America is expected to garner significant business opportunities for the vendors during the forecast period.

              US, UK, China, Canada, France

              • Growing implementation of virtual production in gaming industryThe gaming industry has been one of the popular applications of virtual production technology. The creation of virtual production games requires skills in 3D designing is the driving factor this market.
              • animation is the driving factor this market.
              • and software programming is the driving factor this market.
              • as well as needs creativity and innovative ideas. Virtual production games for mobile phones also exist and are likely to boom once smartphones are equipped with more powerful processors is the driving factor this market.
              • better graphics is the driving factor this market.
              • precise motion tracking is the driving factor this market.
              • and long-lasting batteries.The other application areas of virtual production are storytelling and art is the driving factor this market.
              • communication and social interaction is the driving factor this market.
              • awareness-raising is the driving factor this market.
              • and live entertainment. Such wide application areas of virtual production is the driving factor this market.
              • coupled with consistent technological advances is the driving factor this market.
              • will drive the growth of the global virtual production market during the forecast period. is the driving factor this market.

              The Virtual Production market vendors should focus on grabbing business opportunities from the Software segment as it accounted for the largest market share in the base year.
              RIA - Research AI Assistant
              Ask RIA