Virtual Reality VR Headset Market Analysis North America, APAC, Europe, Middle East and Africa, South America - US, China, UK, Japan, Canada, India, Germany, France, Italy, Brazil - Size and Forecast 2025-2029

Virtual Reality VR Headset Market Analysis North America, APAC, Europe, Middle East and Africa, South America - US, China, UK, Japan, Canada, India, Germany, France, Italy, Brazil - Size and Forecast 2025-2029

Published: Jan 2025 191 Pages SKU: IRTNTR76984

Market Overview at a Glance

$43.64 B
Market Opportunity
51.1%
CAGR
44.4
YoY growth 2024-2025(%)

Virtual Reality VR Headset Market Size 2025-2029

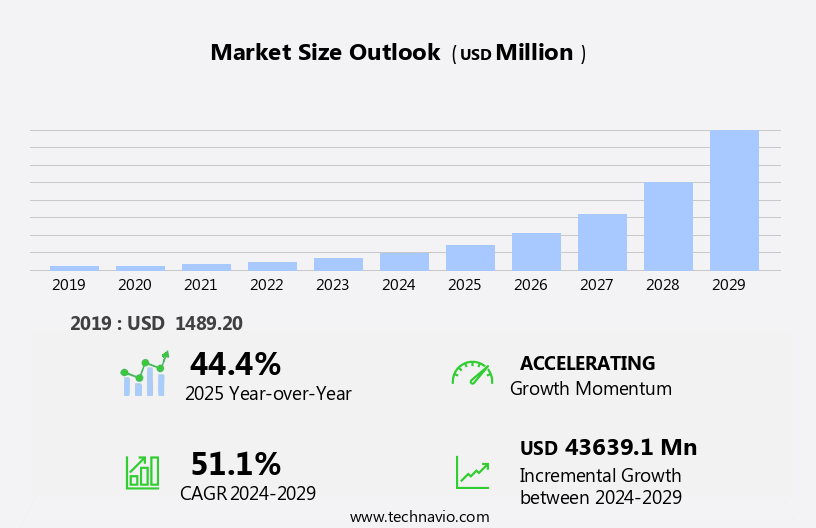
The virtual reality vr headset market size is forecast to increase by USD 43.64 billion at a CAGR of 51.1% between 2024 and 2029.

  • The Virtual Reality (VR) headset market is experiencing significant growth, driven primarily by the surging interest and investment In the gaming industry. This sector's expansion is fueled by advancements in technology, which offer increasingly experiences for users. Another key trend is the growing integration of Augmented Reality (AR) and VR technologies by companies, broadening the application scope of these devices beyond gaming. However, challenges persist, including rising health concerns and user comfort issues. As more consumers adopt VR headsets for extended periods, there is a growing awareness of potential eye strain, headaches, and motion sickness.
  • Companies seeking to capitalize on this market's opportunities must focus on addressing these challenges through innovative design and ergonomic solutions. By staying abreast of these trends and addressing user needs, businesses can effectively navigate the strategic landscape of the VR headset market.

What will be the Size of the Virtual Reality VR Headset Market during the forecast period?

Virtual Reality VR Headset Market Size

 Request Free Sample

  • The virtual reality (VR) headset market is experiencing significant growth, driven by advancements in VR technology and increasing demand across various sectors. According to market research, the global VR headset market size is projected to reach substantial revenue by 2026, growing at a steady compound annual growth rate. Consumers are increasingly adopting VR headsets for gaming experiences, while industries such as healthcare, military, training, and retail are exploring the technology for innovative applications. Notable sectors include Google Cardboard and other mobile VR solutions, console-connected headsets like PlayStation, and standalone devices such as Meta Quest and future offerings like Apple Vision Pro and Meta Quest Pro.
  • VR technology continues to revolutionize industries, offering enhanced training simulations, improved patient care, and new retail experiences.

How is this Virtual Reality VR Headset Industry segmented?

The virtual reality vr headset industry research report provides comprehensive data (region-wise segment analysis), with forecasts and estimates in "USD million" for the period 2025-2029, as well as historical data from 2019-2023 for the following segments.

  • Application
    • Commercial
    • Individual
  • Type
    • Mid-range device
    • Low-end device
    • High-end device
  • Geography
    • North America
      • US
      • Canada
    • APAC
      • China
      • India
      • Japan
    • Europe
      • France
      • Germany
      • Italy
      • UK
    • Middle East and Africa
      • South America
        • Brazil

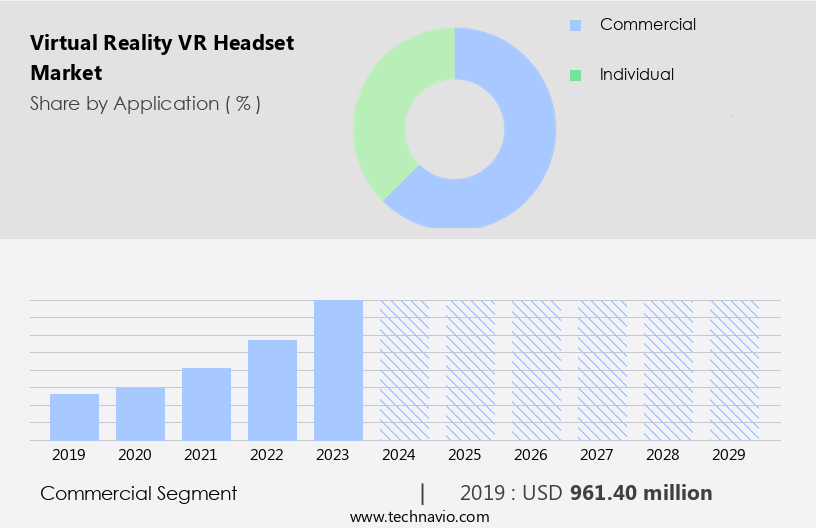
    By Application Insights

    The commercial segment is estimated to witness significant growth during the forecast period.

    The virtual reality (VR) headset market encompasses significant commercial applications, accounting for a substantial market share. Businesses leverage VR technology to enhance training, experiences, and productivity in various sectors, ranging from education and entertainment to enterprise solutions. Notably, VR headsets are extensively utilized in corporate training and simulation, enabling employees to practice skills in a risk-free virtual environment. This approach not only boosts worker performance but also reduces training costs compared to traditional methods. In addition to corporate applications, VR headsets find extensive use in healthcare, virtual training, simulation events, and live virtual entertainment. Companies like PlayStation, Microsoft, and start-ups offer innovative solutions such as the PlayStation Headset, Microsoft HoloLens, and VR simulators.

    VR devices, including head-mounted displays and gesture-tracking devices, are adopted by large technology companies and healthcare provisions for patient care systems, medical training, planned ries, and healthcare applications. The VR market continues to expand, with high-resolution displays, compact devices, and head-up displays gaining traction. Despite advancements, challenges such as VR sickness, neck pain, and low resolution persist. Nonetheless, the market's potential in commercial industries, real estate, and healthcare applications is vast, with AR devices and VR projectors also gaining popularity.

    Virtual Reality VR Headset Market Size

    Get a glance at the market report of share of various segments Request Free Sample

    The Commercial segment was valued at USD 961.40 billion in 2019 and showed a gradual increase during the forecast period.

    Regional Analysis

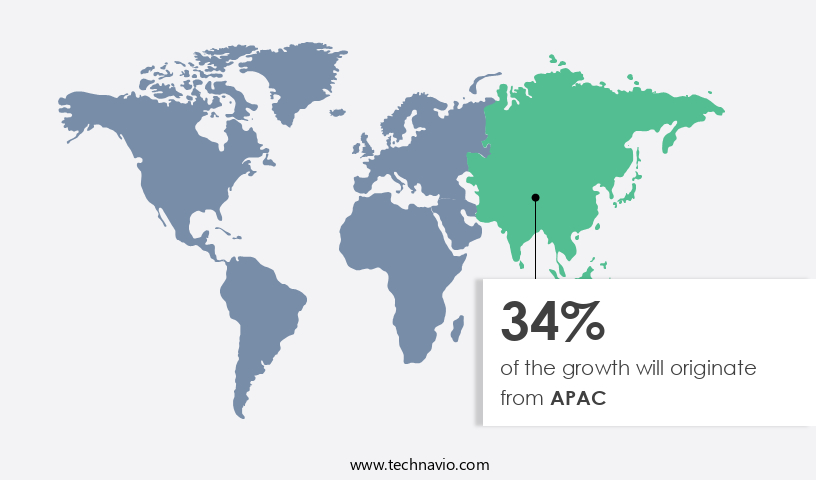
    APAC is estimated to contribute 34% to the growth of the global market during the forecast period.Technavio’s analysts have elaborately explained the regional trends and drivers that shape the market during the forecast period.

    Virtual Reality VR Headset Market Share by Geography

    For more insights on the market size of various regions, Request Free Sample

    The North American virtual reality (VR) headset market has experienced substantial growth due to increasing consumer interest in digital experiences. Major players In the region include Meta Platforms (Oculus), HTC, Sony, and Valve. Oculus, owned by Meta Platforms, has been In the consumer VR headset segment with its popular Rift and Quest series. The Quest 3, launched in October 2023, gained popularity due to its wireless, all-in-one design and competitive pricing. Available in 128 Giga Byte (GB) and 512 GB variants, it offers a compelling VR experience for consumers. The VR market further expands into industries such as healthcare, commercial, and retail sectors.

    Devices like PlayStation Headset, Microsoft HoloLens, and VR simulators cater to virtual training, simulation events, and medical applications, including planned ries, patient care systems, and medical training. VR headsets, head-mounted displays, and gesture-tracking devices are essential components of this market. Large technology companies and start-ups continue to innovate, developing compact, high-resolution devices and head-up displays, VR projectors, and AR devices. Despite advancements, concerns regarding health issues, such as VR sickness, neck pain, and low resolution, remain.

    Market Dynamics

    Our researchers analyzed the data with 2024 as the base year, along with the key drivers, trends, and challenges. A holistic analysis of drivers will help companies refine their marketing strategies to gain a competitive advantage.

    What are the key market drivers leading to the rise In the adoption of Virtual Reality VR Headset Industry?

    Rising interest and growth in gaming industry is the key driver of the market. 

    • The global virtual reality (VR) headset market has experienced remarkable growth, fueled by the expanding gaming and entertainment industries. Consumers' increasing demand for experiences has driven VR technology into the mainstream. VR headsets offer a groundbreaking solution for gamers seeking more realistic and engaging experiences, with advanced graphics, spatial audio, and interactive gameplay in virtual environments. This convergence of technology and consumer preferences has significantly expanded the market for VR headset producers.
    • The gaming sector's massive expansion has been a major catalyst for this growth.

    What are the market trends shaping the Virtual Reality VR Headset Industry?

    Growing AR/VR Integration introduced by s is the upcoming market trend. 

    • Augmented Reality (AR) and Virtual Reality (VR) technologies are revolutionizing user experiences by integrating digital content with the physical world. AR overlays digital information onto the real environment, while VR creates an entirely digital environment. The convergence of AR and VR is gaining momentum due to its potential to enhance user experiences, particularly In the gaming industry. Major gaming companies are incorporating AR elements into their VR games, such as Microsoft's HoloLens 2, which projects holographic images onto the user's environment.
    • Beyond gaming, AR/VR is also being adopted In the enterprise sector for training, simulations, and collaboration. Companies like Oculus and HTC are producing VR headsets with AR capabilities specifically for business applications. This technological fusion is transforming industries, offering innovative solutions for various applications.

    What challenges does the Virtual Reality VR Headset Industry face during its growth?

    Rising health concerns and problems related to user comfort is a key challenge affecting the industry growth. 

    • Virtual Reality (VR) headsets have gained significant attention In the technology industry, offering users an experience. However, the use of VR headsets comes with health risks, primarily motion sickness and visual fatigue. Motion sickness, also known as virtual reality sickness, occurs when there is a discrepancy between the user's perceived motion and actual motion experienced. This phenomenon can result in symptoms such as nausea, vertigo, and pain, limiting the widespread adoption of VR technology. Moreover, prolonged usage of VR headsets can lead to visual fatigue and eye strain. The nature of virtual reality requires users to focus intently, leading to eye strain and potential long-term visual problems.
    • As a result, manufacturers are under increasing pressure to develop solutions that mitigate these negative impacts and enhance user comfort. This market trend underscores the importance of addressing health concerns to expand the user base and maximize the potential of this innovative technology.

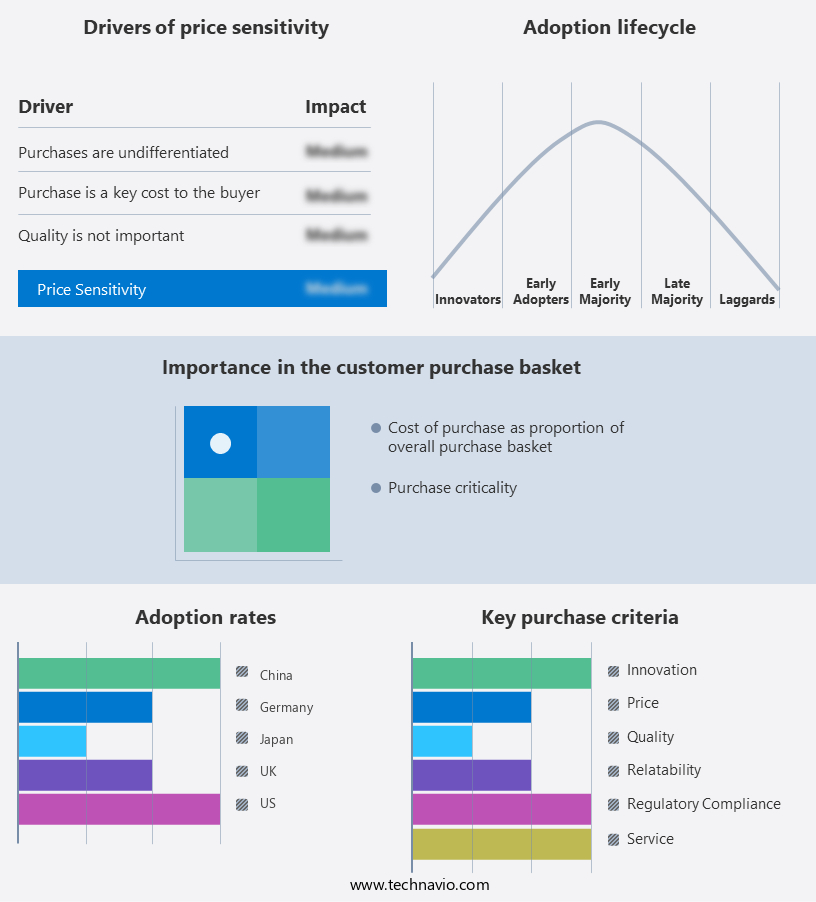
    Exclusive Customer Landscape

    The virtual reality vr headset market forecasting report includes the adoption lifecycle of the market, covering from the innovator’s stage to the laggard’s stage. It focuses on adoption rates in different regions based on penetration. Furthermore, the virtual reality vr headset market report also includes key purchase criteria and drivers of price sensitivity to help companies evaluate and develop their market growth analysis strategies.

    Virtual Reality VR Headset Market Share by Geography

     Customer Landscape

    Key Companies & Market Insights

    Companies are implementing various strategies, such as strategic alliances, virtual reality vr headset market forecast, partnerships, mergers and acquisitions, geographical expansion, and product/service launches, to enhance their presence In the industry.

    Apple Inc. - The company introduces a cutting-edge virtual reality (VR) headset, the Apple Vision Pro, enhancing experiences for users. This innovative device aligns with our commitment to delivering advanced technology solutions. The VR headset's integration of state-of-the-art features significantly improves user engagement and interaction, providing a more captivating and interactive environment. By focusing on delivering a high-quality VR experience, we aim to lead the market and set new industry standards.

    The industry research and growth report includes detailed analyses of the competitive landscape of the market and information about key companies, including:

    • Apple Inc.
    • ASUSTeK Computer Inc.
    • ByteDance Ltd.
    • FOVE Inc.
    • Goertek Inc.
    • Google LLC
    • HP Inc.
    • HTC Corp.
    • LG Corp.
    • Meta Platforms Inc.
    • Microsoft Corp.
    • NOLO Co. Ltd.
    • Pimax Inc.
    • Samsung Electronics Co. Ltd.
    • Seiko Epson Corp.
    • Sony Group Corp.
    • Valve Corp.
    • Varjo Technologies Oy
    • WorldViz Inc.
    • Xiaomi Inc.

    Qualitative and quantitative analysis of companies has been conducted to help clients understand the wider business environment as well as the strengths and weaknesses of key industry players. Data is qualitatively analyzed to categorize companies as pure play, category-focused, industry-focused, and diversified; it is quantitatively analyzed to categorize companies as dominant, leading, strong, tentative, and weak.

    Research Analyst Overview

    Virtual Reality (VR) headsets have emerged as a transformative technology, revolutionizing various sectors by offering experiences. This market encompasses a range of devices, from non- to fully head-mounted displays (HMDs), as well as gesture-tracking devices and head-up displays. The VR market is experiencing significant growth, driven by advancements in technology and increasing adoption across commercial industries. One of the primary sectors witnessing substantial growth is healthcare, where VR is being utilized for virtual training, simulation events, and patient care systems. In planned ries, VR technology enables medical professionals to rehearse procedures, leading to improved precision and patient outcomes.

    Moreover, VR headsets have found applications In the retail sector, enabling businesses to offer customers shopping experiences. In the realm of computer hardware, VR devices have become essential components, with large technology companies and start-ups investing heavily in research and development. Virtual Reality technology offers numerous benefits, including the ability to create realistic simulations and environments. However, it also presents challenges, such as health concerns related to VR sickness and physical discomfort. Eye and hearing issues are among the most common concerns, with prolonged use of low-resolution displays potentially causing eye strain and discomfort. Despite these challenges, the market for VR headsets continues to expand, with new devices and applications emerging regularly.

    High-resolution displays and compact, lightweight designs are becoming increasingly popular, addressing concerns related to comfort and immersion. Furthermore, VR technology is not limited to HMDs alone. Augmented Reality (AR) devices, which overlay digital information onto the real world, are also gaining traction. These devices offer unique applications, particularly in commercial industries and real estate, where they can be used for virtual property tours and product demonstrations. The VR market is dynamic and evolving, with new players and innovations continually entering the scene. As technology advances and adoption rates increase, the potential applications for VR headsets are virtually limitless. Whether it's in healthcare, retail, or any other industry, VR is poised to transform the way we live, work, and interact with the world around us.

    Market Scope

    Report Coverage

    Details

    Page number

    191

    Base year

    2024

    Historic period

    2019-2023

    Forecast period

    2025-2029

    Growth momentum & CAGR

    Accelerate at a CAGR of 51.1%

    Market growth 2025-2029

    USD 43639.1 million

    Market structure

    Fragmented

    YoY growth 2024-2025(%)

    44.4

    Key countries

    US, China, UK, Japan, Canada, India, Germany, France, Italy, and Brazil

    Competitive landscape

    Leading Companies, Market Positioning of Companies, Competitive Strategies, and Industry Risks

    Request Free Sample

    What are the Key Data Covered in this Virtual Reality VR Headset Market Research and Growth Report?

    • CAGR of the Virtual Reality VR Headset industry during the forecast period
    • Detailed information on factors that will drive the growth and forecasting between 2025 and 2029
    • Precise estimation of the size of the market and its contribution of the industry in focus to the parent market
    • Accurate predictions about upcoming growth and trends and changes in consumer behaviour
    • Growth of the market across North America, APAC, Europe, Middle East and Africa, and South America
    • Thorough analysis of the market’s competitive landscape and detailed information about companies
    • Comprehensive analysis of factors that will challenge the virtual reality vr headset market growth of industry companies

    We can help! Our analysts can customize this virtual reality vr headset market research report to meet your requirements.

    Get in touch


    1 Executive Summary

    • 1.1 Market overview
      • Executive Summary - Chart on Market Overview
      • Executive Summary - Data Table on Market Overview
      • Executive Summary - Chart on Global Market Characteristics
      • Executive Summary - Chart on Market by Geography
      • Executive Summary - Chart on Market Segmentation by Application
      • Executive Summary - Chart on Market Segmentation by Type
      • Executive Summary - Chart on Incremental Growth
      • Executive Summary - Data Table on Incremental Growth
      • Executive Summary - Chart on Company Market Positioning

    2 Technavio Analysis

    • 2.1 Analysis of price sensitivity, lifecycle, customer purchase basket, adoption rates, and purchase criteria
      • Analysis of price sensitivity, lifecycle, customer purchase basket, adoption rates, and purchase criteria
    • 2.2 Criticality of inputs and Factors of differentiation
      • Overview on criticality of inputs and factors of differentiation
    • 2.3 Factors of disruption
      • Overview on factors of disruption
    • 2.4 Impact of drivers and challenges
      • Impact of drivers and challenges in 2024 and 2029

    3 Market Landscape

    • 3.1 Market ecosystem
      • Parent Market
      • Data Table on - Parent Market
    • 3.2 Market characteristics
      • Market characteristics analysis
    • 3.3 Value chain analysis
      • Value chain analysis

    4 Market Sizing

    • 4.1 Market definition
      • Offerings of companies included in the market definition
    • 4.2 Market segment analysis
      • Market segments
    • 4.3 Market size 2024
      • 4.4 Market outlook: Forecast for 2024-2029
        • Chart on Global - Market size and forecast 2024-2029 ($ million)
        • Data Table on Global - Market size and forecast 2024-2029 ($ million)
        • Chart on Global Market: Year-over-year growth 2024-2029 (%)
        • Data Table on Global Market: Year-over-year growth 2024-2029 (%)

      5 Historic Market Size

      • 5.1 Global Virtual Reality VR Headset Market 2019 - 2023
        • Historic Market Size - Data Table on Global Virtual Reality VR Headset Market 2019 - 2023 ($ million)
      • 5.2 Application segment analysis 2019 - 2023
        • Historic Market Size - Application Segment 2019 - 2023 ($ million)
      • 5.3 Type segment analysis 2019 - 2023
        • Historic Market Size - Type Segment 2019 - 2023 ($ million)
      • 5.4 Geography segment analysis 2019 - 2023
        • Historic Market Size - Geography Segment 2019 - 2023 ($ million)
      • 5.5 Country segment analysis 2019 - 2023
        • Historic Market Size - Country Segment 2019 - 2023 ($ million)

      6 Qualitative Analysis

      • 6.1 Impact of AI in global virtual reality (VR) headset market

        7 Five Forces Analysis

        • 7.1 Five forces summary
          • Five forces analysis - Comparison between 2024 and 2029
        • 7.2 Bargaining power of buyers
          • Bargaining power of buyers - Impact of key factors 2024 and 2029
        • 7.3 Bargaining power of suppliers
          • Bargaining power of suppliers - Impact of key factors in 2024 and 2029
        • 7.4 Threat of new entrants
          • Threat of new entrants - Impact of key factors in 2024 and 2029
        • 7.5 Threat of substitutes
          • Threat of substitutes - Impact of key factors in 2024 and 2029
        • 7.6 Threat of rivalry
          • Threat of rivalry - Impact of key factors in 2024 and 2029
        • 7.7 Market condition
          • Chart on Market condition - Five forces 2024 and 2029

        8 Market Segmentation by Application

        • 8.1 Market segments
          • Chart on Application - Market share 2024-2029 (%)
          • Data Table on Application - Market share 2024-2029 (%)
        • 8.2 Comparison by Application
          • Chart on Comparison by Application
          • Data Table on Comparison by Application
        • 8.3 Commercial - Market size and forecast 2024-2029
          • Chart on Commercial - Market size and forecast 2024-2029 ($ million)
          • Data Table on Commercial - Market size and forecast 2024-2029 ($ million)
          • Chart on Commercial - Year-over-year growth 2024-2029 (%)
          • Data Table on Commercial - Year-over-year growth 2024-2029 (%)
        • 8.4 Individual - Market size and forecast 2024-2029
          • Chart on Individual - Market size and forecast 2024-2029 ($ million)
          • Data Table on Individual - Market size and forecast 2024-2029 ($ million)
          • Chart on Individual - Year-over-year growth 2024-2029 (%)
          • Data Table on Individual - Year-over-year growth 2024-2029 (%)
        • 8.5 Market opportunity by Application
          • Market opportunity by Application ($ million)
          • Data Table on Market opportunity by Application ($ million)

        9 Market Segmentation by Type

        • 9.1 Market segments
          • Chart on Type - Market share 2024-2029 (%)
          • Data Table on Type - Market share 2024-2029 (%)
        • 9.2 Comparison by Type
          • Chart on Comparison by Type
          • Data Table on Comparison by Type
        • 9.3 Mid-range device - Market size and forecast 2024-2029
          • Chart on Mid-range device - Market size and forecast 2024-2029 ($ million)
          • Data Table on Mid-range device - Market size and forecast 2024-2029 ($ million)
          • Chart on Mid-range device - Year-over-year growth 2024-2029 (%)
          • Data Table on Mid-range device - Year-over-year growth 2024-2029 (%)
        • 9.4 Low-end device - Market size and forecast 2024-2029
          • Chart on Low-end device - Market size and forecast 2024-2029 ($ million)
          • Data Table on Low-end device - Market size and forecast 2024-2029 ($ million)
          • Chart on Low-end device - Year-over-year growth 2024-2029 (%)
          • Data Table on Low-end device - Year-over-year growth 2024-2029 (%)
        • 9.5 High-end device - Market size and forecast 2024-2029
          • Chart on High-end device - Market size and forecast 2024-2029 ($ million)
          • Data Table on High-end device - Market size and forecast 2024-2029 ($ million)
          • Chart on High-end device - Year-over-year growth 2024-2029 (%)
          • Data Table on High-end device - Year-over-year growth 2024-2029 (%)
        • 9.6 Market opportunity by Type
          • Market opportunity by Type ($ million)
          • Data Table on Market opportunity by Type ($ million)

        10 Customer Landscape

        • 10.1 Customer landscape overview
          • Analysis of price sensitivity, lifecycle, customer purchase basket, adoption rates, and purchase criteria

        11 Geographic Landscape

        • 11.1 Geographic segmentation
          • Chart on Market share by geography 2024-2029 (%)
          • Data Table on Market share by geography 2024-2029 (%)
        • 11.2 Geographic comparison
          • Chart on Geographic comparison
          • Data Table on Geographic comparison
        • 11.3 North America - Market size and forecast 2024-2029
          • Chart on North America - Market size and forecast 2024-2029 ($ million)
          • Data Table on North America - Market size and forecast 2024-2029 ($ million)
          • Chart on North America - Year-over-year growth 2024-2029 (%)
          • Data Table on North America - Year-over-year growth 2024-2029 (%)
        • 11.4 APAC - Market size and forecast 2024-2029
          • Chart on APAC - Market size and forecast 2024-2029 ($ million)
          • Data Table on APAC - Market size and forecast 2024-2029 ($ million)
          • Chart on APAC - Year-over-year growth 2024-2029 (%)
          • Data Table on APAC - Year-over-year growth 2024-2029 (%)
        • 11.5 Europe - Market size and forecast 2024-2029
          • Chart on Europe - Market size and forecast 2024-2029 ($ million)
          • Data Table on Europe - Market size and forecast 2024-2029 ($ million)
          • Chart on Europe - Year-over-year growth 2024-2029 (%)
          • Data Table on Europe - Year-over-year growth 2024-2029 (%)
        • 11.6 Middle East and Africa - Market size and forecast 2024-2029
          • Chart on Middle East and Africa - Market size and forecast 2024-2029 ($ million)
          • Data Table on Middle East and Africa - Market size and forecast 2024-2029 ($ million)
          • Chart on Middle East and Africa - Year-over-year growth 2024-2029 (%)
          • Data Table on Middle East and Africa - Year-over-year growth 2024-2029 (%)
        • 11.7 South America - Market size and forecast 2024-2029
          • Chart on South America - Market size and forecast 2024-2029 ($ million)
          • Data Table on South America - Market size and forecast 2024-2029 ($ million)
          • Chart on South America - Year-over-year growth 2024-2029 (%)
          • Data Table on South America - Year-over-year growth 2024-2029 (%)
        • 11.8 US - Market size and forecast 2024-2029
          • Chart on US - Market size and forecast 2024-2029 ($ million)
          • Data Table on US - Market size and forecast 2024-2029 ($ million)
          • Chart on US - Year-over-year growth 2024-2029 (%)
          • Data Table on US - Year-over-year growth 2024-2029 (%)
        • 11.9 China - Market size and forecast 2024-2029
          • Chart on China - Market size and forecast 2024-2029 ($ million)
          • Data Table on China - Market size and forecast 2024-2029 ($ million)
          • Chart on China - Year-over-year growth 2024-2029 (%)
          • Data Table on China - Year-over-year growth 2024-2029 (%)
        • 11.10 UK - Market size and forecast 2024-2029
          • Chart on UK - Market size and forecast 2024-2029 ($ million)
          • Data Table on UK - Market size and forecast 2024-2029 ($ million)
          • Chart on UK - Year-over-year growth 2024-2029 (%)
          • Data Table on UK - Year-over-year growth 2024-2029 (%)
        • 11.11 Japan - Market size and forecast 2024-2029
          • Chart on Japan - Market size and forecast 2024-2029 ($ million)
          • Data Table on Japan - Market size and forecast 2024-2029 ($ million)
          • Chart on Japan - Year-over-year growth 2024-2029 (%)
          • Data Table on Japan - Year-over-year growth 2024-2029 (%)
        • 11.12 Canada - Market size and forecast 2024-2029
          • Chart on Canada - Market size and forecast 2024-2029 ($ million)
          • Data Table on Canada - Market size and forecast 2024-2029 ($ million)
          • Chart on Canada - Year-over-year growth 2024-2029 (%)
          • Data Table on Canada - Year-over-year growth 2024-2029 (%)
        • 11.13 India - Market size and forecast 2024-2029
          • Chart on India - Market size and forecast 2024-2029 ($ million)
          • Data Table on India - Market size and forecast 2024-2029 ($ million)
          • Chart on India - Year-over-year growth 2024-2029 (%)
          • Data Table on India - Year-over-year growth 2024-2029 (%)
        • 11.14 Germany - Market size and forecast 2024-2029
          • Chart on Germany - Market size and forecast 2024-2029 ($ million)
          • Data Table on Germany - Market size and forecast 2024-2029 ($ million)
          • Chart on Germany - Year-over-year growth 2024-2029 (%)
          • Data Table on Germany - Year-over-year growth 2024-2029 (%)
        • 11.15 France - Market size and forecast 2024-2029
          • Chart on France - Market size and forecast 2024-2029 ($ million)
          • Data Table on France - Market size and forecast 2024-2029 ($ million)
          • Chart on France - Year-over-year growth 2024-2029 (%)
          • Data Table on France - Year-over-year growth 2024-2029 (%)
        • 11.16 Italy - Market size and forecast 2024-2029
          • Chart on Italy - Market size and forecast 2024-2029 ($ million)
          • Data Table on Italy - Market size and forecast 2024-2029 ($ million)
          • Chart on Italy - Year-over-year growth 2024-2029 (%)
          • Data Table on Italy - Year-over-year growth 2024-2029 (%)
        • 11.17 Brazil - Market size and forecast 2024-2029
          • Chart on Brazil - Market size and forecast 2024-2029 ($ million)
          • Data Table on Brazil - Market size and forecast 2024-2029 ($ million)
          • Chart on Brazil - Year-over-year growth 2024-2029 (%)
          • Data Table on Brazil - Year-over-year growth 2024-2029 (%)
        • 11.18 Market opportunity by geography
          • Market opportunity by geography ($ million)
          • Data Tables on Market opportunity by geography ($ million)

        12 Drivers, Challenges, and Opportunity/Restraints

        • 12.1 Market drivers
          • 12.2 Market challenges
            • 12.3 Impact of drivers and challenges
              • Impact of drivers and challenges in 2024 and 2029
            • 12.4 Market opportunities/restraints

              13 Competitive Landscape

              • 13.1 Overview
                • 13.2 Competitive Landscape
                  • Overview on criticality of inputs and factors of differentiation
                • 13.3 Landscape disruption
                  • Overview on factors of disruption
                • 13.4 Industry risks
                  • Impact of key risks on business

                14 Competitive Analysis

                • 14.1 Companies profiled
                  • Companies covered
                • 14.2 Company ranking index
                  • Company ranking index
                • 14.3 Market positioning of companies
                  • Matrix on companies position and classification
                • 14.4 Apple Inc.
                  • Apple Inc. - Overview
                  • Apple Inc. - Business segments
                  • Apple Inc. - Key news
                  • Apple Inc. - Key offerings
                  • Apple Inc. - Segment focus
                  • SWOT
                • 14.5 ASUSTeK Computer Inc.
                  • ASUSTeK Computer Inc. - Overview
                  • ASUSTeK Computer Inc. - Product / Service
                  • ASUSTeK Computer Inc. - Key news
                  • ASUSTeK Computer Inc. - Key offerings
                  • SWOT
                • 14.6 Goertek Inc.
                  • Goertek Inc. - Overview
                  • Goertek Inc. - Product / Service
                  • Goertek Inc. - Key offerings
                  • SWOT
                • 14.7 Google LLC
                  • Google LLC - Overview
                  • Google LLC - Product / Service
                  • Google LLC - Key offerings
                  • SWOT
                • 14.8 HP Inc.
                  • HP Inc. - Overview
                  • HP Inc. - Business segments
                  • HP Inc. - Key news
                  • HP Inc. - Key offerings
                  • HP Inc. - Segment focus
                  • SWOT
                • 14.9 HTC Corp.
                  • HTC Corp. - Overview
                  • HTC Corp. - Product / Service
                  • HTC Corp. - Key offerings
                  • SWOT
                • 14.10 LG Corp.
                  • LG Corp. - Overview
                  • LG Corp. - Product / Service
                  • LG Corp. - Key offerings
                  • SWOT
                • 14.11 Meta Platforms Inc.
                  • Meta Platforms Inc. - Overview
                  • Meta Platforms Inc. - Product / Service
                  • Meta Platforms Inc. - Key news
                  • Meta Platforms Inc. - Key offerings
                  • SWOT
                • 14.12 Microsoft Corp.
                  • Microsoft Corp. - Overview
                  • Microsoft Corp. - Business segments
                  • Microsoft Corp. - Key news
                  • Microsoft Corp. - Key offerings
                  • Microsoft Corp. - Segment focus
                  • SWOT
                • 14.13 Samsung Electronics Co. Ltd.
                  • Samsung Electronics Co. Ltd. - Overview
                  • Samsung Electronics Co. Ltd. - Business segments
                  • Samsung Electronics Co. Ltd. - Key news
                  • Samsung Electronics Co. Ltd. - Key offerings
                  • Samsung Electronics Co. Ltd. - Segment focus
                  • SWOT
                • 14.14 Seiko Epson Corp.
                  • Seiko Epson Corp. - Overview
                  • Seiko Epson Corp. - Business segments
                  • Seiko Epson Corp. - Key news
                  • Seiko Epson Corp. - Key offerings
                  • Seiko Epson Corp. - Segment focus
                  • SWOT
                • 14.15 Sony Group Corp.
                  • Sony Group Corp. - Overview
                  • Sony Group Corp. - Business segments
                  • Sony Group Corp. - Key news
                  • Sony Group Corp. - Key offerings
                  • Sony Group Corp. - Segment focus
                  • SWOT
                • 14.16 Valve Corp.
                  • Valve Corp. - Overview
                  • Valve Corp. - Product / Service
                  • Valve Corp. - Key offerings
                  • SWOT
                • 14.17 Varjo Technologies Oy
                  • Varjo Technologies Oy - Overview
                  • Varjo Technologies Oy - Product / Service
                  • Varjo Technologies Oy - Key offerings
                  • SWOT
                • 14.18 Xiaomi Inc.
                  • Xiaomi Inc. - Overview
                  • Xiaomi Inc. - Business segments
                  • Xiaomi Inc. - Key news
                  • Xiaomi Inc. - Key offerings
                  • Xiaomi Inc. - Segment focus
                  • SWOT

                15 Appendix

                • 15.1 Scope of the report
                  • 15.2 Inclusions and exclusions checklist
                    • Inclusions checklist
                    • Exclusions checklist
                  • 15.3 Currency conversion rates for US$
                    • Currency conversion rates for US$
                  • 15.4 Research methodology
                    • Research methodology
                  • 15.5 Data procurement
                    • Information sources
                  • 15.6 Data validation
                    • Data validation
                  • 15.7 Validation techniques employed for market sizing
                    • Validation techniques employed for market sizing
                  • 15.8 Data synthesis
                    • Data synthesis
                  • 15.9 360 degree market analysis
                    • 360 degree market analysis
                  • 15.10 List of abbreviations
                    • List of abbreviations

                  Research Methodology

                  Technavio presents a detailed picture of the market by way of study, synthesis, and summation of data from multiple sources. The analysts have presented the various facets of the market with a particular focus on identifying the key industry influencers. The data thus presented is comprehensive, reliable, and the result of extensive research, both primary and secondary.

                  INFORMATION SOURCES

                  Primary sources

                  • Manufacturers and suppliers
                  • Channel partners
                  • Industry experts
                  • Strategic decision makers

                  Secondary sources

                  • Industry journals and periodicals
                  • Government data
                  • Financial reports of key industry players
                  • Historical data
                  • Press releases

                  DATA ANALYSIS

                  Data Synthesis

                  • Collation of data
                  • Estimation of key figures
                  • Analysis of derived insights

                  Data Validation

                  • Triangulation with data models
                  • Reference against proprietary databases
                  • Corroboration with industry experts

                  REPORT WRITING

                  Qualitative

                  • Market drivers
                  • Market challenges
                  • Market trends
                  • Five forces analysis

                  Quantitative

                  • Market size and forecast
                  • Market segmentation
                  • Geographical insights
                  • Competitive landscape

                  Interested in this report?

                  Get your sample now to see our research methodology and insights!

                  Download Now

                  Frequently Asked Questions

                  Virtual Reality Vr Headset market growth will increase by $ 43639.1 mn during 2025-2029.

                  The Virtual Reality Vr Headset market is expected to grow at a CAGR of 51.1% during 2025-2029.

                  Virtual Reality Vr Headset market is segmented by Application( Commercial, Individual) Type( Mid-range device, Low-end device, High-end device)

                  Apple Inc., ASUSTeK Computer Inc., ByteDance Ltd., FOVE Inc., Goertek Inc., Google LLC, HP Inc., HTC Corp., LG Corp., Meta Platforms Inc., Microsoft Corp., NOLO Co. Ltd., Pimax Inc., Samsung Electronics Co. Ltd., Seiko Epson Corp., Sony Group Corp., Valve Corp., Varjo Technologies Oy, WorldViz Inc., Xiaomi Inc. are a few of the key vendors in the Virtual Reality Vr Headset market.

                  APAC will register the highest growth rate of 34% among the other regions. Therefore, the Virtual Reality Vr Headset market in APAC is expected to garner significant business opportunities for the vendors during the forecast period.

                  US, China, UK, Japan, Canada, India, Germany, France, Italy, Brazil

                  • Rising interest and growth in gaming industryThe rapidly expanding gaming and entertainment industries have played a major role in propelling the global virtual reality (VR) headset market to unprecedented heights. VR headset producers now have a rich market as a result of the convergence of cutting-edge technology and consumer demand for immersive experiences is the driving factor this market.
                  • which has driven virtual reality into the mainstream. The global virtual reality (VR) headset market has grown significantly owing to the massive expansion of the gaming sector. VR headsets provide a revolutionary solution to satisfy gamers  ongoing needs for experiences that are more realistic and immersive than ever before. The gaming experience has been enhanced to new levels by the incorporation of cutting-edge graphics is the driving factor this market.
                  • spatial audio is the driving factor this market.
                  • and interactive gameplay within virtual surroundings. Prominent gaming corporations is the driving factor this market.
                  • namely Oculus (a subsidiary of Meta Platforms) is the driving factor this market.
                  • HTC is the driving factor this market.
                  • and Sony is the driving factor this market.
                  • have utilized this trend by creating superior virtual reality headsets is the driving factor this market.
                  • namely Oculus Rift is the driving factor this market.
                  • HTC Vive is the driving factor this market.
                  • and PlayStation VR. Such factors involving the rising interest and growth in the gaming industry will propel the growth of the global virtual reality (VR) headset market during the forecast period. is the driving factor this market.

                  The Virtual Reality Vr Headset market vendors should focus on grabbing business opportunities from the Commercial segment as it accounted for the largest market share in the base year.