
Warehousing And Distribution Logistics Market Size 2025-2029
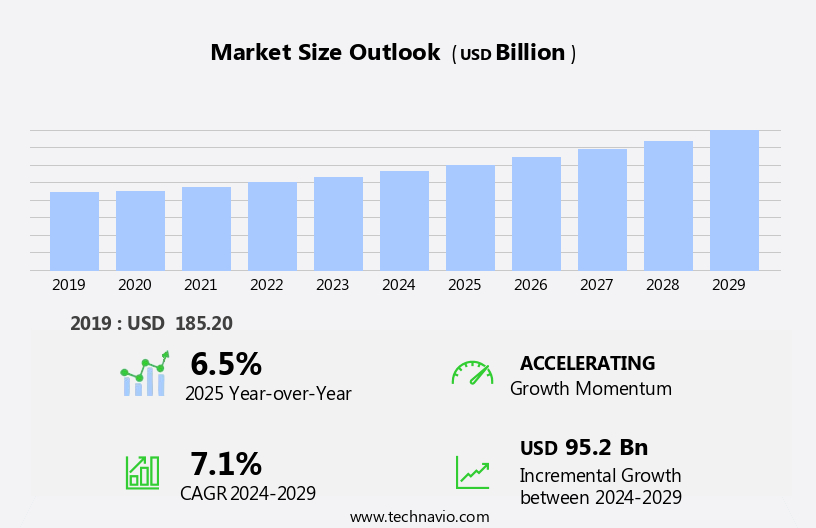
The warehousing and distribution logistics market size is forecast to increase by USD 95.2 billion, at a CAGR of 7.1% between 2024 and 2029.
- The market is experiencing significant growth, driven by the burgeoning e-commerce industry. With the increasing preference for online shopping, there is a surging demand for efficient and reliable warehousing and distribution solutions. On-time delivery and performance metrics are crucial for logistics management and fleet management, ensuring efficient and effective operations. Service providers are capitalizing on this trend by utilizing advanced IT potentials, such as automation and real-time tracking, to streamline operations and enhance customer satisfaction. However, despite these opportunities, challenges persist.
- By adopting innovative technologies and best practices, they can improve efficiency, reduce waste, and stay competitive in this dynamic market. Overall, the market presents both opportunities and challenges for players, requiring strategic planning and adaptability to succeed. Value-added services, such as reverse logistics and returns management, are becoming increasingly important in today's market. Redundant procedures and high operational costs remain obstacles for market participants. To navigate these challenges, companies must focus on optimizing their processes and exploring cost-saving measures.
What will be the Size of the Warehousing And Distribution Logistics Market during the forecast period?
Explore in-depth regional segment analysis with market size data - historical 2019-2023 and forecasts 2025-2029 - in the full report.
Request Free Sample
The market continues to evolve, with dynamic market activities shaping the industry across various sectors. Warehouse security and space optimization remain key priorities, with the integration of Internet of Things (IoT) sensors enabling real-time monitoring and control. The ongoing adoption of technology, such as RFID tracking and conveyor systems, enhances order picking efficiency and inventory control. E-commerce logistics and fourth-party logistics (4PL) are driving the need for supply chain visibility and real-time tracking, while emission reduction and KPI dashboards are essential for data analytics and cost optimization.
Transportation modes, including ocean freight, rail freight, truckload (TL), less-than-truckload (LTL), and intermodal transportation, are subject to safety regulations and continuous optimization. The integration of warehouse automation and pallet racking systems contributes to inventory management and demand forecasting, while route planning and order accuracy are essential for delivery optimization. The market's continuous dynamism is reflected in the evolving patterns of air freight, freight forwarding, and warehouse layout design. The focus on sustainability, such as carbon footprint and fuel efficiency, is a significant trend shaping the future of the market.
How is this Warehousing And Distribution Logistics Industry segmented?
The warehousing and distribution logistics industry research report provides comprehensive data (region-wise segment analysis), with forecasts and estimates in "USD billion" for the period 2025-2029, as well as historical data from 2019-2023 for the following segments.
- Business Segment
- Warehousing
- Distribution logistics
- Value added services
- End-user
- Healthcare
- Manufacturing
- Aerospace
- Telecommunication
- Others
- Type
- Storage
- Roadways distribution
- Seaways distribution
- Others
- Geography
- North America
- US
- Canada
- Europe
- France
- Germany
- UK
- APAC
- Australia
- China
- India
- Japan
- South Korea
- Rest of World (ROW)
- North America
By Business Segment Insights
The warehousing segment is estimated to witness significant growth during the forecast period. Warehousing is an essential component of the supply chain for businesses dealing in tangible inventory. It involves storing goods in large quantities before distribution to retail customers or other businesses. Service providers are enhancing warehousing capabilities by focusing on capacity planning, efficient receiving of incoming shipments, improved inventory tracking, and innovative storage methods. Supply chain visibility and real-time tracking enable better management of market conditions and inventory rearrangement. Emission reduction is a priority, with the implementation of KPI dashboards, data analytics, and value-added services. RFID tracking, rail freight, and truckload transportation modes are increasingly utilized for cost optimization.
Safety regulations are strictly enforced for order fulfillment and inventory control. Delivery optimization is achieved through less-than-truckload and intermodal transportation. Warehouse automation incorporates conveyor systems, reach trucks, and pallet racking. Performance metrics, such as on-time delivery and order accuracy, are crucial. Reverse logistics and freight forwarding are essential for managing returns and transportation modes. Carbon footprint and fuel efficiency are key concerns, with third-party logistics providers offering solutions. Warehouse security and space optimization are essential, with IoT sensors and warehouse layout design playing significant roles. Demand forecasting and route planning are crucial for maintaining inventory levels and efficient transportation.
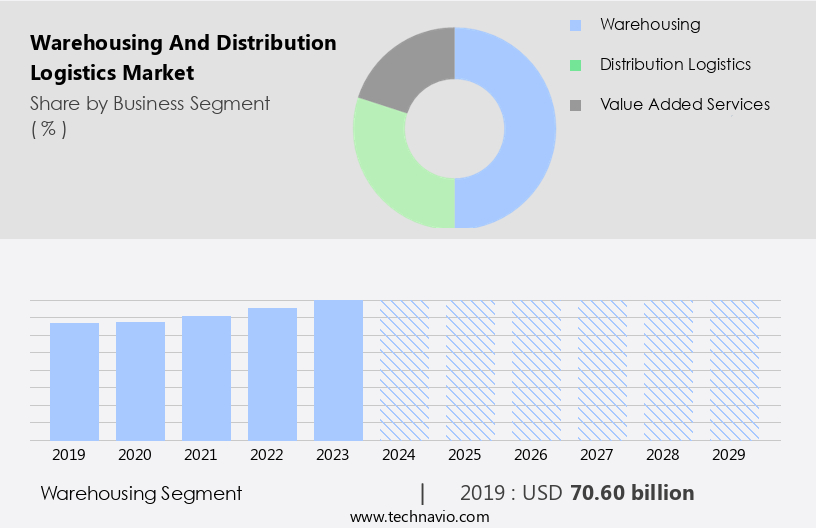
The Warehousing segment was valued at USD 70.60 billion in 2019 and showed a gradual increase during the forecast period.
Regional Analysis
APAC is estimated to contribute 50% to the growth of the global market during the forecast period. Technavio's analysts have elaborately explained the regional trends and drivers that shape the market during the forecast period.

The market is experiencing significant growth, particularly in countries like India and China, where e-commerce industries are expanding. Limited land availability and increasing land costs near cities necessitate innovative solutions, such as multi-story warehouses. These structures are increasingly popular due to the proximity they offer to urban areas, facilitating faster delivery for e-commerce businesses. The implementation of the Goods and Services Tax (GST) in India has further fueled market growth by streamlining interstate trade and encouraging the development of larger, centralized logistics hubs. In the realm of logistics management, there is a focus on optimization and efficiency. Real-time tracking and supply chain visibility are essential for effective order fulfillment and inventory control.
Emission reduction is a priority, with the adoption of transportation modes like rail freight and intermodal transportation. Third-party logistics providers (3PLs) offer value-added services, such as freight forwarding, reverse logistics, and performance metrics, to help businesses manage their supply chains more effectively. Warehouse automation plays a crucial role in this market, with technologies like conveyor systems, reach trucks, and RFID tracking streamlining operations. Safety regulations are strictly enforced, ensuring secure warehouse environments. Order accuracy and on-time delivery are key performance indicators, with KPI dashboards and data analytics providing valuable insights. As the market evolves, there is a growing emphasis on cost optimization, with less-than-truckload (LTL) and truckload (TL) shipping becoming increasingly popular.
Space optimization is another crucial factor, with the integration of IoT sensors and warehouse layout design playing a significant role. The carbon footprint and fuel efficiency of logistics operations are also under scrutiny, with a focus on reducing emissions and improving sustainability. Third-party logistics (3PL) providers offer cost-effective and efficient solutions for businesses looking to outsource their warehousing and distribution needs.
Market Dynamics
Our researchers analyzed the data with 2024 as the base year, along with the key drivers, trends, and challenges. A holistic analysis of drivers will help companies refine their marketing strategies to gain a competitive advantage.
What are the key market drivers leading to the rise in the adoption of Warehousing And Distribution Logistics Industry?
- The thriving e-commerce sector serves as the primary catalyst for market growth. The e-commerce sector's growing demand and the need for efficient order fulfillment and inventory control have significantly driven the expansion of the market. The implementation of automation technologies, such as conveyor systems and warehouse automation, has become essential for businesses to optimize costs and delivery times. Additionally, the increasing popularity of intermodal transportation, including rail freight and less-than-truckload (LTL), has streamlined the movement of goods and reduced transportation costs.
- The global economic development, particularly in emerging markets like China, India, Brazil, and South Africa, has further fueled the market's growth. Logistics companies are expanding their operations in these regions to support local manufacturers' overseas expansion and anticipate potential trading condition changes. Overall, these factors have contributed to the dynamic growth of the market. Safety regulations also play a crucial role in the market's growth, ensuring secure handling and transportation of goods. Air freight remains an essential mode of transportation for time-sensitive and high-value consignments.
What are the market trends shaping the Warehousing And Distribution Logistics Industry?
- The utilization of IT potentials by service providers is a mandated trend in today's market. This means that companies are increasingly relying on information technology to enhance their offerings and remain competitive. The integration of information technology (IT) in the warehousing and distribution logistics industry is a significant trend, driven by decreasing technology costs. Advanced tools and systems are now accessible to businesses of all sizes, leading stakeholders to recognize IT's potential for enhancing operational efficiency, streamlining logistics processes, and improving decision-making. Real-time updates on warehousing and distribution activities are a major advantage of IT integration.
- IoT sensors enable real-time monitoring and analysis of warehouse conditions, while freight forwarding and last-mile delivery are improved through transportation mode optimization and fleet management. Performance metrics, such as on-time delivery, are easily tracked and analyzed, contributing to supply chain optimization and logistics management. Systems like warehouse management systems (WMS), transportation management systems (TMS), and RFID tracking provide accurate, up-to-the-minute information on inventory levels, shipment status, and delivery timelines to customers and partners. Furthermore, IT solutions contribute to space optimization, enhancing warehouse security, and facilitating reverse logistics.
What challenges does the Warehousing And Distribution Logistics Industry face during its growth?
- The reduction of redundant procedures and implementation of cost-saving measures are essential for addressing the challenge of enhancing industry growth. Warehousing and distribution logistics is a critical aspect of business operations, encompassing various processes such as returns management, demand forecasting, and inventory management. Inefficiencies in these areas can lead to increased costs and decreased customer satisfaction. One notable area for improvement is the handling of products within warehouses. Traditional procedures often involve multiple employees handling the same item, leading to redundant processes and higher labor costs. To streamline these operations, advanced technologies such as barcode systems and automated systems are being adopted. These solutions help eliminate redundant steps and maximize resource efficiency. For instance, the use of barcode technology enables quick and accurate order picking and inventory management.
- Automated systems, such as reach trucks and pallet racking, further enhance productivity and reduce the need for manual labor. Moreover, there is a growing emphasis on reducing the carbon footprint and improving fuel efficiency in warehousing and distribution logistics. Route planning and optimization are essential strategies for minimizing transportation-related emissions. Effective warehouse layout design and inventory management are also crucial for optimizing warehouse operations. By implementing lean principles and continuous improvement strategies, businesses can minimize waste and maximize space utilization. Overall, the market is dynamic and constantly evolving, with a focus on innovation, efficiency, and sustainability.
Exclusive Customer Landscape
The warehousing and distribution logistics market forecasting report includes the adoption lifecycle of the market, covering from the innovator's stage to the laggard's stage. It focuses on adoption rates in different regions based on penetration. Furthermore, the warehousing and distribution logistics market report also includes key purchase criteria and drivers of price sensitivity to help companies evaluate and develop their market growth analysis strategies.
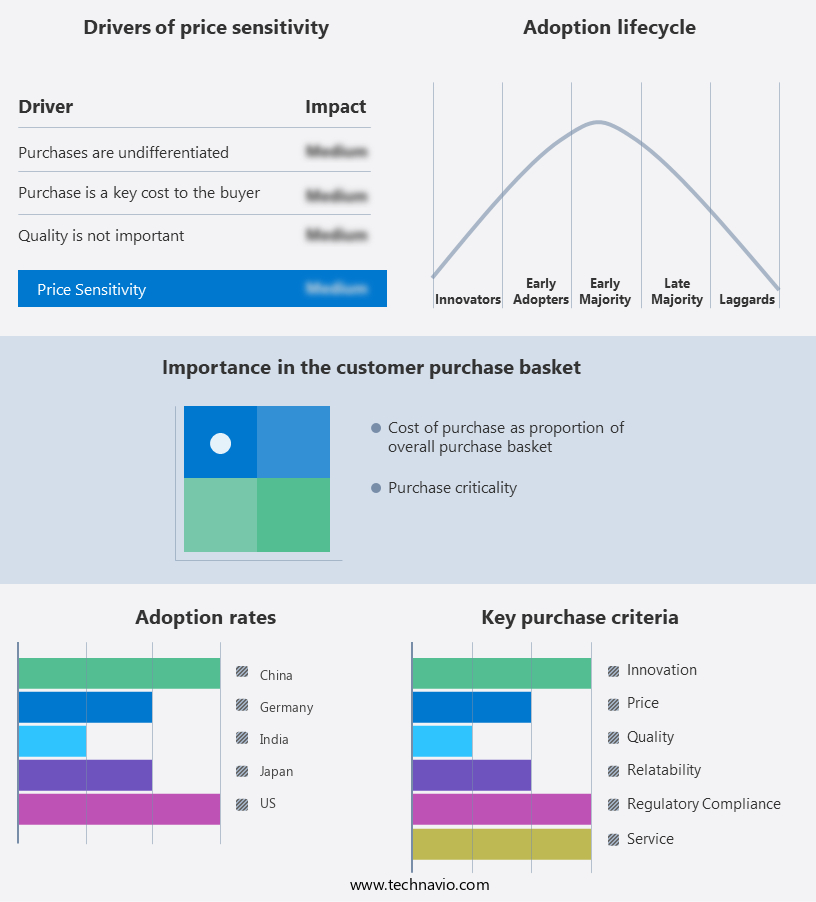
Customer Landscape
Key Companies & Market Insights
Companies are implementing various strategies, such as strategic alliances, warehousing and distribution logistics market forecast, partnerships, mergers and acquisitions, geographical expansion, and product/service launches, to enhance their presence in the industry.
Agility Public Warehousing Co. K.S.C.P - This company specializes in optimizing warehousing and distribution logistics, delivering cost savings, waste reduction, and environmental protection.
The industry research and growth report includes detailed analyses of the competitive landscape of the market and information about key companies, including:
- Agility Public Warehousing Co. K.S.C.P
- Americold Realty Trust Inc.
- CEVA Logistics SA
- CWT Pte. Ltd.
- DB Schenker
- DHL International GmbH
- Expeditors International of Washington Inc.
- Gemadept Corp.
- GEODIS
- Kerry Logistics Network Ltd.
- Kuehne Nagel Management AG
- NFI Industries Inc.
- Nippon Express Holdings Inc.
- Penske Truck Leasing Co. L.P.
- Ryder System Inc.
- Singapore Post Ltd.
- Tiong Nam Logistics Holdings Berhad
- WHA Corp. PCL
- XPO Inc.
- YCH Group
Qualitative and quantitative analysis of companies has been conducted to help clients understand the wider business environment as well as the strengths and weaknesses of key industry players. Data is qualitatively analyzed to categorize companies as pure play, category-focused, industry-focused, and diversified; it is quantitatively analyzed to categorize companies as dominant, leading, strong, tentative, and weak.
Recent Development and News in Warehousing And Distribution Logistics Market
- In January 2024, DHL Supply Chain announced the launch of its new Robotic Picking Solution, significantly enhancing their automated warehouse capabilities. This innovation enables faster order processing and increased efficiency, reducing picking errors by up to 95% (DHL press release).
- In March 2024, Amazon and Alphabet's Wing collaborated to integrate drone delivery services into Amazon's logistics network. This strategic partnership aims to revolutionize last-mile delivery by using Wing's drones for quicker and more efficient delivery of Amazon packages (Amazon press release).
- In April 2025, DB Schenker completed the acquisition of Panalpina World Transport Holding Ltd. This merger created one of the world's leading logistics providers, expanding DB Schenker's global reach and enhancing its air and ocean freight capabilities (DB Schenker press release).
- In May 2025, the European Union approved the Digital Operational Resilience Act (DORA), mandating logistics companies to implement robust cybersecurity measures. This regulatory initiative aims to protect the EU's financial sector from cyber threats, enhancing the overall security of the market (European Commission press release).
Research Analyst Overview
In today's dynamic market, efficiency and accuracy are paramount. Order tracking and delivery confirmation ensure transparency for customers, while customs brokerage streamlines international shipping. Picking accuracy and data integration minimize errors, and claims management mitigates potential losses. Labor optimization, inventory turnover, and delivery speed enhance productivity, as network optimization reduces transportation costs. Predictive analytics and risk management help mitigate potential disruptions, and customer service and disaster recovery maintain business continuity. Sorting systems, picking technology, and material handling improve warehouse productivity, while cloud computing, AI-powered logistics, and packaging efficiency drive innovation. Warehouse design and compliance management ensure sustainability and adherence to shipping regulations.
Sustainable packaging, technology integration, and waste reduction contribute to a greener supply chain. Warehouse staff training and storage solutions ensure a skilled workforce and adequate capacity. Fuel consumption and supply chain resilience remain key concerns for companies, with tracking numbers and real-time visibility providing essential information. Contract logistics and business continuity plans ensure uninterrupted operations, while warehouse productivity and transportation costs remain critical factors in the market.
Dive into Technavio's robust research methodology, blending expert interviews, extensive data synthesis, and validated models for unparalleled Warehousing And Distribution Logistics Market insights. See full methodology.
|
Market Scope |
|
|
Report Coverage |
Details |
|
Page number |
214 |
|
Base year |
2024 |
|
Historic period |
2019-2023 |
|
Forecast period |
2025-2029 |
|
Growth momentum & CAGR |
Accelerate at a CAGR of 7.1% |
|
Market growth 2025-2029 |
USD 95.2 billion |
|
Market structure |
Fragmented |
|
YoY growth 2024-2025(%) |
6.5 |
|
Key countries |
US, China, India, Germany, UK, Japan, Canada, South Korea, France, and Australia |
|
Competitive landscape |
Leading Companies, Market Positioning of Companies, Competitive Strategies, and Industry Risks |
What are the Key Data Covered in this Warehousing And Distribution Logistics Market Research and Growth Report?
- CAGR of the Warehousing And Distribution Logistics industry during the forecast period
- Detailed information on factors that will drive the growth and forecasting between 2025 and 2029
- Precise estimation of the size of the market and its contribution of the industry in focus to the parent market
- Accurate predictions about upcoming growth and trends and changes in consumer behaviour
- Growth of the market across APAC, North America, Europe, South America, and Middle East and Africa
- Thorough analysis of the market's competitive landscape and detailed information about companies
- Comprehensive analysis of factors that will challenge the warehousing and distribution logistics market growth of industry companies
We can help! Our analysts can customize this warehousing and distribution logistics market research report to meet your requirements.
 RIA -
RIA - 
