Water Aeration Systems Market Analysis, Size, and Forecast 2026-2030: APAC (China, Japan, and India), North America (US, Canada, and Mexico), Europe (Germany, UK, and France), Middle East and Africa (Saudi Arabia, UAE, and South Africa), South America (Brazil and Argentina), and Rest of World (ROW)

Water Aeration Systems Market Analysis, Size, and Forecast 2026-2030:
APAC (China, Japan, and India), North America (US, Canada, and Mexico), Europe (Germany, UK, and France), Middle East and Africa (Saudi Arabia, UAE, and South Africa), South America (Brazil and Argentina), and Rest of World (ROW)

Published: Mar 2026 302 Pages SKU: IRTNTR80084

Market Overview at a Glance

$5.14 B
Market Opportunity
5.6%
CAGR 2025 - 2030
42.2%
APAC Growth
$8.73 B
Subsurface aerators segment 2024

Water Aeration Systems Market Size 2026-2030

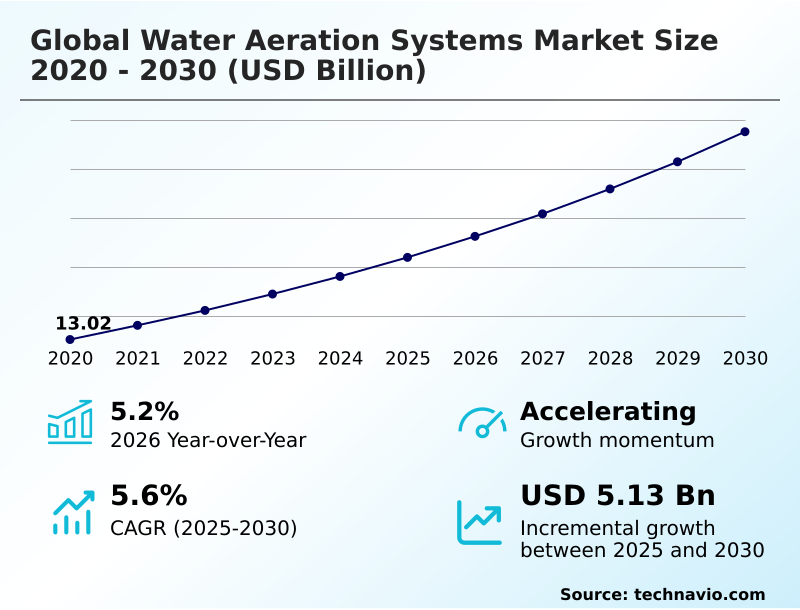
The water aeration systems market size is valued to increase by USD 5.14 billion, at a CAGR of 5.6% from 2025 to 2030. Integration of energy-efficient fine bubble diffusion and industrialization of OPEX reduction mandates will drive the water aeration systems market.

Major Market Trends & Insights

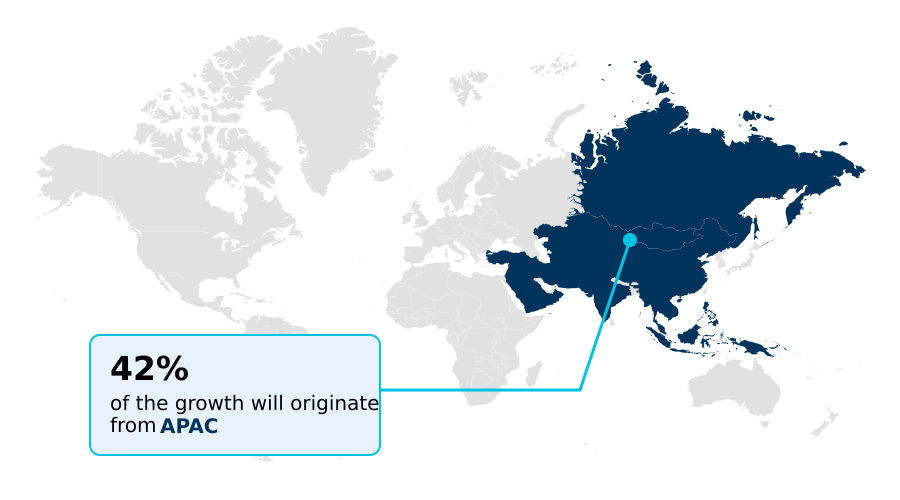
  • APAC dominated the market and accounted for a 42.2% growth during the forecast period.
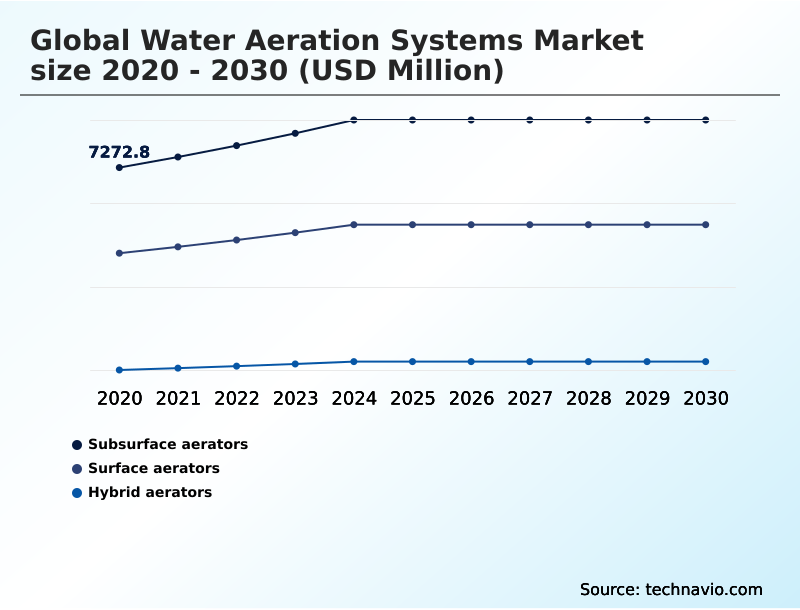
  • By Type - Subsurface aerators segment was valued at USD 8.73 billion in 2024
  • By End-user - Municipalities segment accounted for the largest market revenue share in 2024

Market Size & Forecast

  • Market Opportunities: USD 8.50 billion
  • Market Future Opportunities: USD 5.14 billion
  • CAGR from 2025 to 2030 : 5.6%

Market Summary

  • The water aeration systems market is undergoing a structural expansion, driven by a global focus on resource recovery and utility decarbonization. As the most energy-intensive aspect of biological wastewater treatment, aeration is seeing a shift from traditional mechanical methods toward high-efficiency subsurface fine bubble diffusion, membrane aerated biofilm reactor (MABR), and jet aeration venturi ejector technologies.
  • This evolution is supported by stringent nutrient removal mandates and rising energy costs, which shorten payback periods for infrastructure retrofits. The integration of dissolved oxygen sensor integration and real-time aeration process control is now standard for optimizing performance.
  • For instance, a municipal utility can leverage digital twin simulation for treatment to model aeration performance under varying loads, preventing process upsets and enhancing biological resilience, thereby ensuring consistent compliance without excessive energy use. However, challenges such as membrane fouling and the high capital cost of high-efficiency turbo blowers persist, particularly in regions with less resilient power infrastructure.
  • The expansion of aquaculture and the demand for decentralized treatment units create new avenues for specialized systems, making the convergence of advanced materials and AI-driven process optimization primary growth drivers.

What will be the Size of the Water Aeration Systems Market during the forecast period?

Get Key Insights on Market Forecast (PDF) Request Free Sample

How is the Water Aeration Systems Market Segmented?

The water aeration systems industry research report provides comprehensive data (region-wise segment analysis), with forecasts and estimates in "USD million" for the period 2026-2030, as well as historical data from 2020-2024 for the following segments.

  • Type
    • Subsurface aerators
    • Surface aerators
    • Hybrid aerators
  • End-user
    • Municipalities
    • Industrial
    • Others
  • Technology
    • Fine bubble aeration
    • Coarse bubble aeration
    • Mechanical aeration
    • Jet aeration
    • Others
  • Geography
    • APAC
      • China
      • Japan
      • India
    • North America
      • US
      • Canada
      • Mexico
    • Europe
      • Germany
      • UK
      • France
    • Middle East and Africa
      • Saudi Arabia
      • UAE
      • South Africa
    • South America
      • Brazil
      • Argentina
    • Rest of World (ROW)

By Type Insights

The subsurface aerators segment is estimated to witness significant growth during the forecast period.

The subsurface aerators segment is pivotal, driven by the need for high-efficiency oxygen transfer efficiency optimization in municipal wastewater infrastructure. This category, which includes microporous diffuser technology and jet aeration venturi ejector, introduces air directly into lower water strata.

Adoption is propelled by the need to manage increasing organic loads and the expansion of aquaculture dissolved oxygen management.

The shift toward subsurface fine bubble diffusion is significant, as these high-intensity oxygenation methods can achieve efficiencies exceeding twice that of traditional mechanical units, a key factor in operational expenditure reduction mandate strategies.

This growth is supported by advanced EPDM silicone membranes and innovations in fouling-resistant membrane coatings that improve biological scaling mitigation and align with circular economy water management goals.

Request Free Sample

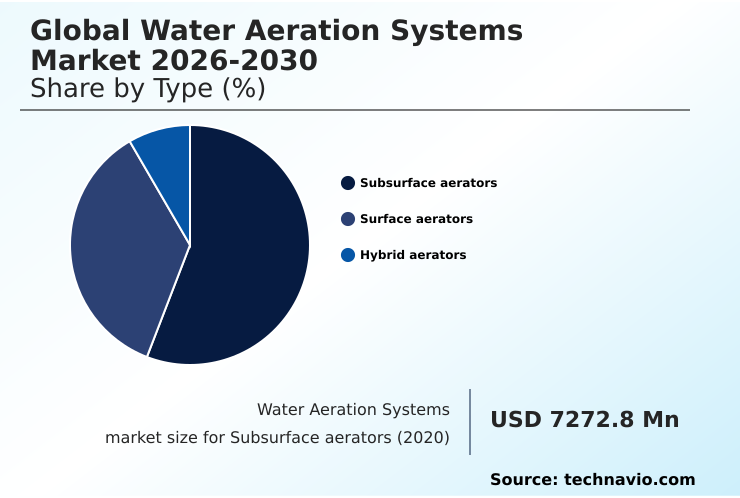
The Subsurface aerators segment was valued at USD 8.73 billion in 2024 and showed a gradual increase during the forecast period.

Request Free Sample

Regional Analysis

APAC is estimated to contribute 42.2% to the growth of the global market during the forecast period.Technavio’s analysts have elaborately explained the regional trends and drivers that shape the market during the forecast period.

See How Water Aeration Systems Market Demand is Rising in APAC Request Free Sample

The geographic landscape is defined by varied adoption rates. In North America and Europe, the focus is on retrofitting with automated blower speed adjustment and real-time aeration process control.

These upgrades have demonstrated operational gains, reducing energy use by up to 50%.

Conversely, APAC drives volume growth, contributing over 42% of the market's incremental growth, with a focus on corrosion-resistant alloy impellers and solar-powered surface aerators for urbanization and aquaculture.

The Middle East demands zero-liquid discharge systems and containerized treatment solutions for landfill leachate pre-treatment. This regional diversification reflects a move toward energy-neutral wastewater treatment and specialized biological process modeling software for lake and reservoir restoration.

Market Dynamics

Our researchers analyzed the data with 2025 as the base year, along with the key drivers, trends, and challenges. A holistic analysis of drivers will help companies refine their marketing strategies to gain a competitive advantage.

  • Strategic decision-making in the water aeration systems market is increasingly complex, requiring a deep understanding of specific applications and performance metrics. For instance, evaluating the impact of fine bubble aeration on OPEX is crucial for municipal planners aiming to achieve fiscal sustainability, as this technology can offer substantial long-term savings over less efficient methods.
  • The technical decision of using jet aerators in deep tanks versus other systems often comes down to the need for simultaneous mixing and oxygenation in high-solids environments. Forward-looking facilities are exploring nanobubble technology for high OTE and the benefits of MABR for decentralized wastewater treatment, which are particularly suited for space-constrained urban areas or remote locations.
  • A key trend involves leveraging AI-driven digital twins for aeration control, a practice that has been shown to improve process stability by over 30% compared to manual systems, directly impacting operational planning and compliance assurance. Other critical considerations include PFAS remediation using foam fractionation, addressing membrane fouling in subsurface aerators, and improving energy efficiency in municipal treatment plants.
  • The rise of IoT for autonomous aeration control is transforming maintenance strategies. Businesses must also consider how to balance mixing and oxygenation with hybrids, optimizing BNR with precise aeration, and the role of VFDs in aeration systems. Effectively managing high-strength industrial effluent while reducing carbon footprint of aeration are top priorities.
  • The market also offers specialized aeration solutions for recirculating aquaculture and innovations aimed at overcoming scaling in fine bubble diffusers. Finally, the total cost of ownership is heavily influenced by the cost of high-frequency maintenance schedules and achieving aeration for zero-liquid discharge goals. The comparison of surface vs subsurface aerator efficiency remains a fundamental evaluation for any new project.

What are the key market drivers leading to the rise in the adoption of Water Aeration Systems Industry?

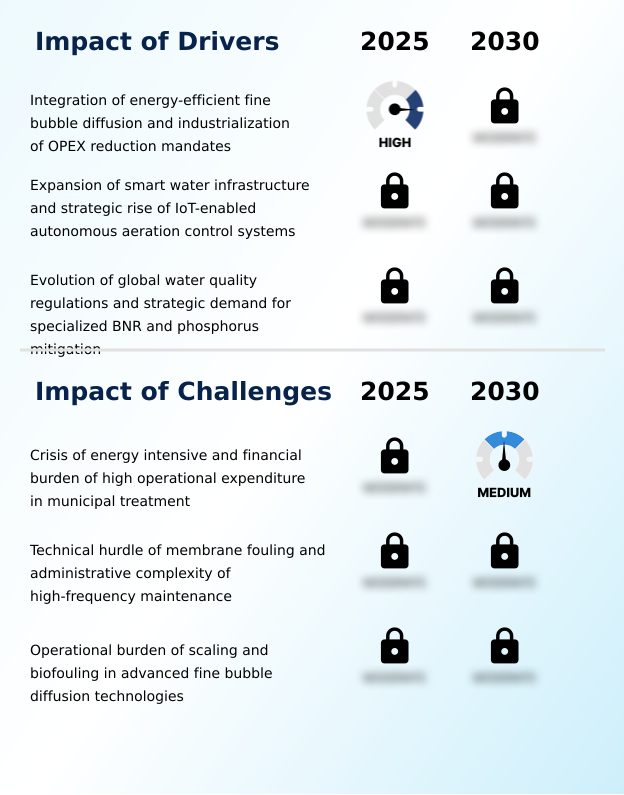
  • The integration of energy-efficient fine bubble diffusion, driven by the industrialization of OPEX reduction mandates, is a key driver for the market.

  • A primary driver is the intense focus on reducing the carbon footprint of water treatment, where aeration can be a major energy consumer.
  • The shift to fine bubble diffusion is critical, as these systems can reduce energy use by nearly 50%. A second driver is the proliferation of smart water infrastructure and IoT for autonomous aeration control.
  • The integration of dissolved oxygen sensor integration and real-time nutrient loading analysis facilitates performance optimization and reduces equipment downtime through remote monitoring and diagnostics.
  • Finally, evolving regulations demanding specialized biological nutrient removal process and phosphorus mitigation are compelling the adoption of high-speed turbo blowers and hybrid systems to meet stricter discharge limits for high-strength industrial wastewater and protect ecosystems.

What are the market trends shaping the Water Aeration Systems Industry?

  • The institutionalization of autonomous aeration control is an emerging market trend. This is characterized by the integration of AI-driven digital twin simulations into wastewater frameworks.

  • An overarching trend is the institutionalization of autonomous aeration control systems, where digital twin simulation for treatment is becoming standard. This integration of cloud-based water analytics and predictive maintenance algorithms enables predictive oxygenation, with facilities reporting aeration energy reductions of up to 30%.
  • The proliferation of nanobubble water treatment and membrane aerated biofilm reactor (MABR) systems is another key trend, with MABR cutting energy use by up to 75% over conventional methods. Furthermore, the market is expanding to include PFAS foam fractionation system for targeted contaminant removal, transforming decentralized treatment units into critical defense mechanisms that support environmental social governance goals.

What challenges does the Water Aeration Systems Industry face during its growth?

  • The high energy intensity and financial burden of operational expenditures in municipal treatment present a significant challenge to industry growth.

  • A significant challenge remains the high energy cost associated with legacy systems, straining municipal budgets. Another hurdle is membrane fouling in activated sludge process enhancement. This degradation reduces efficiency and increases backpressure, with reports indicating cleaning frequency has risen by nearly 15%. This elevates the cost of high-frequency maintenance schedules and is exacerbated by a skilled technical labor shortage.
  • High capital expenditure for high-efficiency blowers is a barrier for smaller municipalities, while the lack of self-cleaning membrane materials and anti-fouling coating development means the industry struggles to maintain theoretical efficiency gains from variable-frequency drive application in sequencing batch reactor design.

Exclusive Technavio Analysis on Customer Landscape

The water aeration systems market forecasting report includes the adoption lifecycle of the market, covering from the innovator’s stage to the laggard’s stage. It focuses on adoption rates in different regions based on penetration. Furthermore, the water aeration systems market report also includes key purchase criteria and drivers of price sensitivity to help companies evaluate and develop their market growth analysis strategies.

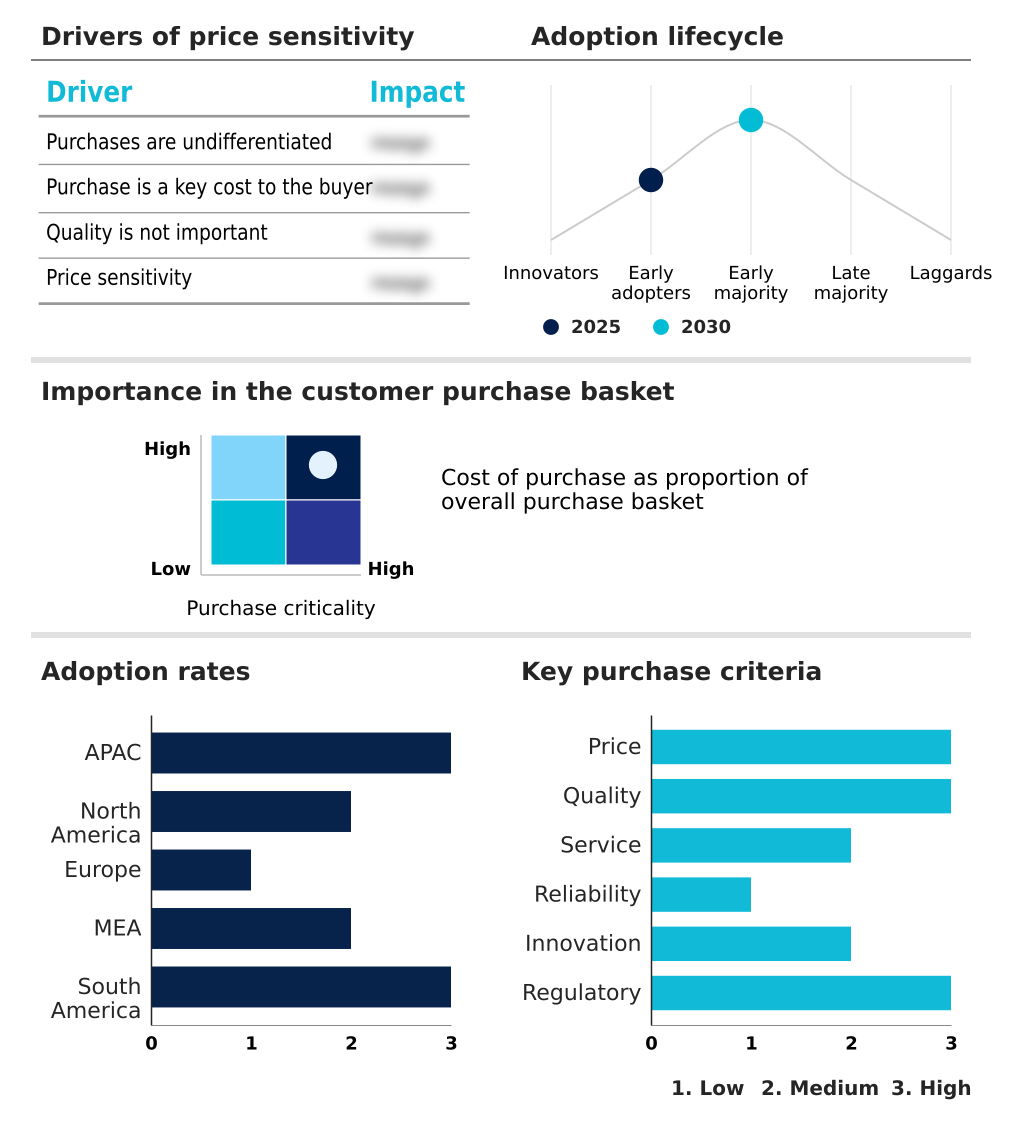
Customer Landscape of Water Aeration Systems Industry

Competitive Landscape

Companies are implementing various strategies, such as strategic alliances, water aeration systems market forecast, partnerships, mergers and acquisitions, geographical expansion, and product/service launches, to enhance their presence in the industry.

Air Products and Chem Inc. - Provides integrated equipment, technology, and systems for municipal and industrial water and wastewater treatment applications, enhancing operational efficiency and compliance.

The industry research and growth report includes detailed analyses of the competitive landscape of the market and information about key companies, including:

  • Air Products and Chem Inc.
  • Airolator Corp.
  • Eco Water Techs
  • Heathland Group Ltd.
  • Hydrologic Distribution Co.
  • JC France Industrie
  • Napier Reid Ltd.
  • Newterra Ltd.
  • Otterbine Barebo Inc.
  • Ovivo Inc.
  • Photon Water
  • SSI Aeration Inc.
  • Sulzer Ltd.
  • Toshio Technology Co. Ltd.
  • Veolia Environment SA
  • Vertex Aquatic Solutions
  • Vishuddhi Enviro Pvt. Ltd.
  • Water Garden Ltd.
  • WesTech Engineering LLC
  • Xylem Inc.

Qualitative and quantitative analysis of companies has been conducted to help clients understand the wider business environment as well as the strengths and weaknesses of key industry players. Data is qualitatively analyzed to categorize companies as pure play, category-focused, industry-focused, and diversified; it is quantitatively analyzed to categorize companies as dominant, leading, strong, tentative, and weak.

Recent Development and News in Water aeration systems market

  • In August 2025, Grundfos finalized its acquisition of Newterra Ltd., a strategic move to bolster its offerings in the decentralized and modular water treatment market.
  • In June 2025, Xylem Inc. announced a significant projection, stating that 25% of public-sector wastewater plants are expected to adopt artificial intelligence for process optimization by the end of 2025, signaling a major industry shift.
  • In March 2025, Sulzer Ltd. secured a comprehensive agreement to supply over six hundred pieces of equipment, including advanced aeration systems, to Inpasa's renewable energy facilities in Brazil.
  • In November 2024, WesTech Engineering LLC launched a new integrated foam fractionation and aeration system specifically designed for the remediation of per- and polyfluoroalkyl substances (PFAS) in industrial effluent.

Dive into Technavio’s robust research methodology, blending expert interviews, extensive data synthesis, and validated models for unparalleled Water Aeration Systems Market insights. See full methodology.

Market Scope
Page number 302
Base year 2025
Historic period 2020-2024
Forecast period 2026-2030
Growth momentum & CAGR Accelerate at a CAGR of 5.6%
Market growth 2026-2030 USD 5135.0 million
Market structure Fragmented
YoY growth 2025-2026(%) 5.2%
Key countries China, Japan, India, South Korea, Australia, Indonesia, US, Canada, Mexico, Germany, UK, France, Italy, Spain, The Netherlands, Saudi Arabia, UAE, South Africa, Turkey, Israel, Brazil, Argentina and Chile
Competitive landscape Leading Companies, Market Positioning of Companies, Competitive Strategies, and Industry Risks

Request Free Sample

Research Analyst Overview

  • The global water aeration systems market 2026-2030 is undergoing a fundamental transformation, shifting from commodity hardware to integrated, intelligent systems focused on efficiency and sustainability. This evolution is driven by the need for operational expenditure reduction mandate compliance and stricter environmental regulations.
  • Key technologies like subsurface fine bubble diffusion, membrane aerated biofilm reactor systems, and nanobubble water treatment are becoming standard. The integration of dissolved oxygen sensor integration with high-efficiency turbo blowers facilitates real-time aeration process control.
  • A critical trend influencing boardroom decisions is the adoption of digital twin simulation for treatment, which allows for predictive modeling to optimize biochemical oxygen demand reduction. Facilities using these simulations have reported a reduction in process upsets by over 30%, directly impacting capital budgeting for municipal wastewater infrastructure.
  • The scope now includes advanced applications such as PFAS foam fractionation system for contaminant removal and specialized equipment for high-strength industrial wastewater and aquaculture dissolved oxygen management. The focus on oxygen transfer efficiency optimization and carbon footprint of water treatment is paramount, with advanced EPDM silicone membranes and microporous diffuser technology at the forefront.
  • Innovations address challenges like biological scaling mitigation and are crucial for lake and reservoir restoration, zero-liquid discharge systems, and nitrification and denitrification cycles in activated sludge process enhancement.

What are the Key Data Covered in this Water Aeration Systems Market Research and Growth Report?

  • What is the expected growth of the Water Aeration Systems Market between 2026 and 2030?

    • USD 5.14 billion, at a CAGR of 5.6%

  • What segmentation does the market report cover?

    • The report is segmented by Type (Subsurface aerators, Surface aerators, and Hybrid aerators), End-user (Municipalities, Industrial, and Others), Technology (Fine bubble aeration, Coarse bubble aeration, Mechanical aeration, Jet aeration, and Others) and Geography (APAC, North America, Europe, Middle East and Africa, South America)

  • Which regions are analyzed in the report?

    • APAC, North America, Europe, Middle East and Africa and South America

  • What are the key growth drivers and market challenges?

    • Integration of energy-efficient fine bubble diffusion and industrialization of OPEX reduction mandates, Crisis of energy intensive and financial burden of high operational expenditure in municipal treatment

  • Who are the major players in the Water Aeration Systems Market?

    • Air Products and Chem Inc., Airolator Corp., Eco Water Techs, Heathland Group Ltd., Hydrologic Distribution Co., JC France Industrie, Napier Reid Ltd., Newterra Ltd., Otterbine Barebo Inc., Ovivo Inc., Photon Water, SSI Aeration Inc., Sulzer Ltd., Toshio Technology Co. Ltd., Veolia Environment SA, Vertex Aquatic Solutions, Vishuddhi Enviro Pvt. Ltd., Water Garden Ltd., WesTech Engineering LLC and Xylem Inc.

Market Research Insights

  • Market dynamics are increasingly shaped by the adoption of autonomous aeration control systems and digital twin simulation for treatment to enhance operational efficiency. This transition from manual adjustments to data-driven optimization is critical, as facilities implementing cloud-based water analytics have reported reductions in aeration energy consumption by up to 30%.
  • The rise of predictive maintenance algorithms helps reduce downtime by over 20%, ensuring continuous compliance with effluent standards. These high-intensity oxygenation methods are pivotal for energy-neutral wastewater treatment goals.
  • While the need for skilled technical labor remains a consideration, the move toward automated remote monitoring and diagnostics allows operators to manage multiple containerized treatment solutions from a central location, improving service reliability and aligning with environmental social governance goals.

We can help! Our analysts can customize this water aeration systems market research report to meet your requirements.

Get in touch

1. Executive Summary

1.1 Market overview

Executive Summary - Chart on Market Overview
Executive Summary - Data Table on Market Overview
Executive Summary - Chart on Global Market Characteristics
Executive Summary - Chart on Market by Geography
Executive Summary - Chart on Market Segmentation by Type
Executive Summary - Chart on Market Segmentation by End-user
Executive Summary - Chart on Market Segmentation by Technology
Executive Summary - Chart on Incremental Growth
Executive Summary - Data Table on Incremental Growth
Executive Summary - Chart on Company Market Positioning

2. Technavio Analysis

2.1 Analysis of price sensitivity, lifecycle, customer purchase basket, adoption rates, and purchase criteria

2.2 Criticality of inputs and Factors of differentiation

Chart on Overview on criticality of inputs and factors of differentiation

2.3 Factors of disruption

Chart on Overview on factors of disruption

2.4 Impact of drivers and challenges

Chart on Impact of drivers and challenges in 2025 and 2030

3. Market Landscape

3.1 Market ecosystem

Chart on Parent Market
Data Table on - Parent Market

3.2 Market characteristics

Chart on Market characteristics analysis

3.3 Value chain analysis

Chart on Value chain analysis

4. Market Sizing

4.1 Market definition

Data Table on Offerings of companies included in the market definition

4.2 Market segment analysis

Market segments

4.3 Market size 2025

4.4 Market outlook: Forecast for 2025-2030

Chart on Global - Market size and forecast 2025-2030 ($ million)
Data Table on Global - Market size and forecast 2025-2030 ($ million)
Chart on Global Market: Year-over-year growth 2025-2030 (%)
Data Table on Global Market: Year-over-year growth 2025-2030 (%)

5. Historic Market Size

5.1 Global Water Aeration Systems Market 2020 - 2024

Historic Market Size - Data Table on Global Water Aeration Systems Market 2020 - 2024 ($ million)

5.2 Type segment analysis 2020 - 2024

Historic Market Size - Type Segment 2020 - 2024 ($ million)

5.3 End-user segment analysis 2020 - 2024

Historic Market Size - End-user Segment 2020 - 2024 ($ million)

5.4 Technology segment analysis 2020 - 2024

Historic Market Size - Technology Segment 2020 - 2024 ($ million)

5.5 Geography segment analysis 2020 - 2024

Historic Market Size - Geography Segment 2020 - 2024 ($ million)

5.6 Country segment analysis 2020 - 2024

Historic Market Size - Country Segment 2020 - 2024 ($ million)

6. Qualitative Analysis

6.1 Impact of AI in global water aeration systems market

6.2 Impact of geopolitical conflict for global water aeration systems market

7. Five Forces Analysis

7.1 Five forces summary

Five forces analysis - Comparison between 2025 and 2030

7.2 Bargaining power of buyers

Bargaining power of buyers - Impact of key factors 2025 and 2030

7.3 Bargaining power of suppliers

Bargaining power of suppliers - Impact of key factors in 2025 and 2030

7.4 Threat of new entrants

Threat of new entrants - Impact of key factors in 2025 and 2030

7.5 Threat of substitutes

Threat of substitutes - Impact of key factors in 2025 and 2030

7.6 Threat of rivalry

Threat of rivalry - Impact of key factors in 2025 and 2030

7.7 Market condition

Chart on Market condition - Five forces 2025 and 2030

8. Market Segmentation by Type

8.1 Market segments

Chart on Type - Market share 2025-2030 (%)
Data Table on Type - Market share 2025-2030 (%)

8.2 Comparison by Type

Chart on Comparison by Type
Data Table on Comparison by Type

8.3 Subsurface aerators - Market size and forecast 2025-2030

Chart on Subsurface aerators - Market size and forecast 2025-2030 ($ million)
Data Table on Subsurface aerators - Market size and forecast 2025-2030 ($ million)
Chart on Subsurface aerators - Year-over-year growth 2025-2030 (%)
Data Table on Subsurface aerators - Year-over-year growth 2025-2030 (%)

8.4 Surface aerators - Market size and forecast 2025-2030

Chart on Surface aerators - Market size and forecast 2025-2030 ($ million)
Data Table on Surface aerators - Market size and forecast 2025-2030 ($ million)
Chart on Surface aerators - Year-over-year growth 2025-2030 (%)
Data Table on Surface aerators - Year-over-year growth 2025-2030 (%)

8.5 Hybrid aerators - Market size and forecast 2025-2030

Chart on Hybrid aerators - Market size and forecast 2025-2030 ($ million)
Data Table on Hybrid aerators - Market size and forecast 2025-2030 ($ million)
Chart on Hybrid aerators - Year-over-year growth 2025-2030 (%)
Data Table on Hybrid aerators - Year-over-year growth 2025-2030 (%)

8.6 Market opportunity by Type

Market opportunity by Type ($ million)
Data Table on Market opportunity by Type ($ million)

9. Market Segmentation by End-user

9.1 Market segments

Chart on End-user - Market share 2025-2030 (%)
Data Table on End-user - Market share 2025-2030 (%)

9.2 Comparison by End-user

Chart on Comparison by End-user
Data Table on Comparison by End-user

9.3 Municipalities - Market size and forecast 2025-2030

Chart on Municipalities - Market size and forecast 2025-2030 ($ million)
Data Table on Municipalities - Market size and forecast 2025-2030 ($ million)
Chart on Municipalities - Year-over-year growth 2025-2030 (%)
Data Table on Municipalities - Year-over-year growth 2025-2030 (%)

9.4 Industrial - Market size and forecast 2025-2030

Chart on Industrial - Market size and forecast 2025-2030 ($ million)
Data Table on Industrial - Market size and forecast 2025-2030 ($ million)
Chart on Industrial - Year-over-year growth 2025-2030 (%)
Data Table on Industrial - Year-over-year growth 2025-2030 (%)

9.5 Others - Market size and forecast 2025-2030

Chart on Others - Market size and forecast 2025-2030 ($ million)
Data Table on Others - Market size and forecast 2025-2030 ($ million)
Chart on Others - Year-over-year growth 2025-2030 (%)
Data Table on Others - Year-over-year growth 2025-2030 (%)

9.6 Market opportunity by End-user

Market opportunity by End-user ($ million)
Data Table on Market opportunity by End-user ($ million)

10. Market Segmentation by Technology

10.1 Market segments

Chart on Technology - Market share 2025-2030 (%)
Data Table on Technology - Market share 2025-2030 (%)

10.2 Comparison by Technology

Chart on Comparison by Technology
Data Table on Comparison by Technology

10.3 Fine bubble aeration - Market size and forecast 2025-2030

Chart on Fine bubble aeration - Market size and forecast 2025-2030 ($ million)
Data Table on Fine bubble aeration - Market size and forecast 2025-2030 ($ million)
Chart on Fine bubble aeration - Year-over-year growth 2025-2030 (%)
Data Table on Fine bubble aeration - Year-over-year growth 2025-2030 (%)

10.4 Coarse bubble aeration - Market size and forecast 2025-2030

Chart on Coarse bubble aeration - Market size and forecast 2025-2030 ($ million)
Data Table on Coarse bubble aeration - Market size and forecast 2025-2030 ($ million)
Chart on Coarse bubble aeration - Year-over-year growth 2025-2030 (%)
Data Table on Coarse bubble aeration - Year-over-year growth 2025-2030 (%)

10.5 Mechanical aeration - Market size and forecast 2025-2030

Chart on Mechanical aeration - Market size and forecast 2025-2030 ($ million)
Data Table on Mechanical aeration - Market size and forecast 2025-2030 ($ million)
Chart on Mechanical aeration - Year-over-year growth 2025-2030 (%)
Data Table on Mechanical aeration - Year-over-year growth 2025-2030 (%)

10.6 Jet aeration - Market size and forecast 2025-2030

Chart on Jet aeration - Market size and forecast 2025-2030 ($ million)
Data Table on Jet aeration - Market size and forecast 2025-2030 ($ million)
Chart on Jet aeration - Year-over-year growth 2025-2030 (%)
Data Table on Jet aeration - Year-over-year growth 2025-2030 (%)

10.7 Others - Market size and forecast 2025-2030

Chart on Others - Market size and forecast 2025-2030 ($ million)
Data Table on Others - Market size and forecast 2025-2030 ($ million)
Chart on Others - Year-over-year growth 2025-2030 (%)
Data Table on Others - Year-over-year growth 2025-2030 (%)

10.8 Market opportunity by Technology

Market opportunity by Technology ($ million)
Data Table on Market opportunity by Technology ($ million)

11. Customer Landscape

11.1 Customer landscape overview

Analysis of price sensitivity, lifecycle, customer purchase basket, adoption rates, and purchase criteria

12. Geographic Landscape

12.1 Geographic segmentation

Chart on Market share by geography 2025-2030 (%)
Data Table on Market share by geography 2025-2030 (%)

12.2 Geographic comparison

Chart on Geographic comparison
Data Table on Geographic comparison

12.3 APAC - Market size and forecast 2025-2030

Chart on APAC - Market size and forecast 2025-2030 ($ million)
Data Table on APAC - Market size and forecast 2025-2030 ($ million)
Chart on APAC - Year-over-year growth 2025-2030 (%)
Data Table on APAC - Year-over-year growth 2025-2030 (%)
Chart on Regional Comparison - APAC
Data Table on Regional Comparison - APAC

12.3.1 China - Market size and forecast 2025-2030

Chart on China - Market size and forecast 2025-2030 ($ million)
Data Table on China - Market size and forecast 2025-2030 ($ million)
Chart on China - Year-over-year growth 2025-2030 (%)
Data Table on China - Year-over-year growth 2025-2030 (%)

12.3.2 Japan - Market size and forecast 2025-2030

Chart on Japan - Market size and forecast 2025-2030 ($ million)
Data Table on Japan - Market size and forecast 2025-2030 ($ million)
Chart on Japan - Year-over-year growth 2025-2030 (%)
Data Table on Japan - Year-over-year growth 2025-2030 (%)

12.3.3 India - Market size and forecast 2025-2030

Chart on India - Market size and forecast 2025-2030 ($ million)
Data Table on India - Market size and forecast 2025-2030 ($ million)
Chart on India - Year-over-year growth 2025-2030 (%)
Data Table on India - Year-over-year growth 2025-2030 (%)

12.3.4 South Korea - Market size and forecast 2025-2030

Chart on South Korea - Market size and forecast 2025-2030 ($ million)
Data Table on South Korea - Market size and forecast 2025-2030 ($ million)
Chart on South Korea - Year-over-year growth 2025-2030 (%)
Data Table on South Korea - Year-over-year growth 2025-2030 (%)

12.3.5 Australia - Market size and forecast 2025-2030

Chart on Australia - Market size and forecast 2025-2030 ($ million)
Data Table on Australia - Market size and forecast 2025-2030 ($ million)
Chart on Australia - Year-over-year growth 2025-2030 (%)
Data Table on Australia - Year-over-year growth 2025-2030 (%)

12.3.6 Indonesia - Market size and forecast 2025-2030

Chart on Indonesia - Market size and forecast 2025-2030 ($ million)
Data Table on Indonesia - Market size and forecast 2025-2030 ($ million)
Chart on Indonesia - Year-over-year growth 2025-2030 (%)
Data Table on Indonesia - Year-over-year growth 2025-2030 (%)

12.4 North America - Market size and forecast 2025-2030

Chart on North America - Market size and forecast 2025-2030 ($ million)
Data Table on North America - Market size and forecast 2025-2030 ($ million)
Chart on North America - Year-over-year growth 2025-2030 (%)
Data Table on North America - Year-over-year growth 2025-2030 (%)
Chart on Regional Comparison - North America
Data Table on Regional Comparison - North America

12.4.1 US - Market size and forecast 2025-2030

Chart on US - Market size and forecast 2025-2030 ($ million)
Data Table on US - Market size and forecast 2025-2030 ($ million)
Chart on US - Year-over-year growth 2025-2030 (%)
Data Table on US - Year-over-year growth 2025-2030 (%)

12.4.2 Canada - Market size and forecast 2025-2030

Chart on Canada - Market size and forecast 2025-2030 ($ million)
Data Table on Canada - Market size and forecast 2025-2030 ($ million)
Chart on Canada - Year-over-year growth 2025-2030 (%)
Data Table on Canada - Year-over-year growth 2025-2030 (%)

12.4.3 Mexico - Market size and forecast 2025-2030

Chart on Mexico - Market size and forecast 2025-2030 ($ million)
Data Table on Mexico - Market size and forecast 2025-2030 ($ million)
Chart on Mexico - Year-over-year growth 2025-2030 (%)
Data Table on Mexico - Year-over-year growth 2025-2030 (%)

12.5 Europe - Market size and forecast 2025-2030

Chart on Europe - Market size and forecast 2025-2030 ($ million)
Data Table on Europe - Market size and forecast 2025-2030 ($ million)
Chart on Europe - Year-over-year growth 2025-2030 (%)
Data Table on Europe - Year-over-year growth 2025-2030 (%)
Chart on Regional Comparison - Europe
Data Table on Regional Comparison - Europe

12.5.1 Germany - Market size and forecast 2025-2030

Chart on Germany - Market size and forecast 2025-2030 ($ million)
Data Table on Germany - Market size and forecast 2025-2030 ($ million)
Chart on Germany - Year-over-year growth 2025-2030 (%)
Data Table on Germany - Year-over-year growth 2025-2030 (%)

12.5.2 UK - Market size and forecast 2025-2030

Chart on UK - Market size and forecast 2025-2030 ($ million)
Data Table on UK - Market size and forecast 2025-2030 ($ million)
Chart on UK - Year-over-year growth 2025-2030 (%)
Data Table on UK - Year-over-year growth 2025-2030 (%)

12.5.3 France - Market size and forecast 2025-2030

Chart on France - Market size and forecast 2025-2030 ($ million)
Data Table on France - Market size and forecast 2025-2030 ($ million)
Chart on France - Year-over-year growth 2025-2030 (%)
Data Table on France - Year-over-year growth 2025-2030 (%)

12.5.4 Italy - Market size and forecast 2025-2030

Chart on Italy - Market size and forecast 2025-2030 ($ million)
Data Table on Italy - Market size and forecast 2025-2030 ($ million)
Chart on Italy - Year-over-year growth 2025-2030 (%)
Data Table on Italy - Year-over-year growth 2025-2030 (%)

12.5.5 Spain - Market size and forecast 2025-2030

Chart on Spain - Market size and forecast 2025-2030 ($ million)
Data Table on Spain - Market size and forecast 2025-2030 ($ million)
Chart on Spain - Year-over-year growth 2025-2030 (%)
Data Table on Spain - Year-over-year growth 2025-2030 (%)

12.5.6 The Netherlands - Market size and forecast 2025-2030

Chart on The Netherlands - Market size and forecast 2025-2030 ($ million)
Data Table on The Netherlands - Market size and forecast 2025-2030 ($ million)
Chart on The Netherlands - Year-over-year growth 2025-2030 (%)
Data Table on The Netherlands - Year-over-year growth 2025-2030 (%)

12.6 Middle East and Africa - Market size and forecast 2025-2030

Chart on Middle East and Africa - Market size and forecast 2025-2030 ($ million)
Data Table on Middle East and Africa - Market size and forecast 2025-2030 ($ million)
Chart on Middle East and Africa - Year-over-year growth 2025-2030 (%)
Data Table on Middle East and Africa - Year-over-year growth 2025-2030 (%)
Chart on Regional Comparison - Middle East and Africa
Data Table on Regional Comparison - Middle East and Africa

12.6.1 Saudi Arabia - Market size and forecast 2025-2030

Chart on Saudi Arabia - Market size and forecast 2025-2030 ($ million)
Data Table on Saudi Arabia - Market size and forecast 2025-2030 ($ million)
Chart on Saudi Arabia - Year-over-year growth 2025-2030 (%)
Data Table on Saudi Arabia - Year-over-year growth 2025-2030 (%)

12.6.2 UAE - Market size and forecast 2025-2030

Chart on UAE - Market size and forecast 2025-2030 ($ million)
Data Table on UAE - Market size and forecast 2025-2030 ($ million)
Chart on UAE - Year-over-year growth 2025-2030 (%)
Data Table on UAE - Year-over-year growth 2025-2030 (%)

12.6.3 South Africa - Market size and forecast 2025-2030

Chart on South Africa - Market size and forecast 2025-2030 ($ million)
Data Table on South Africa - Market size and forecast 2025-2030 ($ million)
Chart on South Africa - Year-over-year growth 2025-2030 (%)
Data Table on South Africa - Year-over-year growth 2025-2030 (%)

12.6.4 Turkey - Market size and forecast 2025-2030

Chart on Turkey - Market size and forecast 2025-2030 ($ million)
Data Table on Turkey - Market size and forecast 2025-2030 ($ million)
Chart on Turkey - Year-over-year growth 2025-2030 (%)
Data Table on Turkey - Year-over-year growth 2025-2030 (%)

12.6.5 Israel - Market size and forecast 2025-2030

Chart on Israel - Market size and forecast 2025-2030 ($ million)
Data Table on Israel - Market size and forecast 2025-2030 ($ million)
Chart on Israel - Year-over-year growth 2025-2030 (%)
Data Table on Israel - Year-over-year growth 2025-2030 (%)

12.7 South America - Market size and forecast 2025-2030

Chart on South America - Market size and forecast 2025-2030 ($ million)
Data Table on South America - Market size and forecast 2025-2030 ($ million)
Chart on South America - Year-over-year growth 2025-2030 (%)
Data Table on South America - Year-over-year growth 2025-2030 (%)
Chart on Regional Comparison - South America
Data Table on Regional Comparison - South America

12.7.1 Brazil - Market size and forecast 2025-2030

Chart on Brazil - Market size and forecast 2025-2030 ($ million)
Data Table on Brazil - Market size and forecast 2025-2030 ($ million)
Chart on Brazil - Year-over-year growth 2025-2030 (%)
Data Table on Brazil - Year-over-year growth 2025-2030 (%)

12.7.2 Argentina - Market size and forecast 2025-2030

Chart on Argentina - Market size and forecast 2025-2030 ($ million)
Data Table on Argentina - Market size and forecast 2025-2030 ($ million)
Chart on Argentina - Year-over-year growth 2025-2030 (%)
Data Table on Argentina - Year-over-year growth 2025-2030 (%)

12.7.3 Chile - Market size and forecast 2025-2030

Chart on Chile - Market size and forecast 2025-2030 ($ million)
Data Table on Chile - Market size and forecast 2025-2030 ($ million)
Chart on Chile - Year-over-year growth 2025-2030 (%)
Data Table on Chile - Year-over-year growth 2025-2030 (%)

12.8 Market opportunity by geography

Market opportunity by geography ($ million)
Data Tables on Market opportunity by geography ($ million)

13. Drivers, Challenges, and Opportunity

13.1 Market drivers

Integration of energy-efficient fine bubble diffusion and industrialization of OPEX reduction mandates
Expansion of smart water infrastructure and strategic rise of IoT-enabled autonomous aeration control systems
Evolution of global water quality regulations and strategic demand for specialized BNR and phosphorus mitigation

13.2 Market challenges

Crisis of energy intensive and financial burden of high operational expenditure in municipal treatment
Technical hurdle of membrane fouling and administrative complexity of high-frequency maintenance
Operational burden of scaling and biofouling in advanced fine bubble diffusion technologies

13.3 Impact of drivers and challenges

Impact of drivers and challenges in 2025 and 2030

13.4 Market opportunities

Institutionalization of autonomous aeration control through AI-driven digital twin integration
Proliferation of nanobubble technology and high-efficiency membrane aerated biofilm reactors
Strategic expansion of PFAS remediation through integrated foam fractionation and aeration systems

14. Competitive Landscape

14.1 Overview

14.2

Overview on criticality of inputs and factors of differentiation

14.3 Landscape disruption

Overview on factors of disruption

14.4 Industry risks

Impact of key risks on business

15. Competitive Analysis

15.1 Companies profiled

Companies covered

15.2 Company ranking index

15.3 Market positioning of companies

Matrix on companies position and classification

15.4 Air Products and Chem Inc.

Air Products and Chem Inc. - Overview
Air Products and Chem Inc. - Business segments
Air Products and Chem Inc. - Key news
Air Products and Chem Inc. - Key offerings
Air Products and Chem Inc. - Segment focus
SWOT

15.5 Airolator Corp.

Airolator Corp. - Overview
Airolator Corp. - Product / Service
Airolator Corp. - Key offerings
SWOT

15.6 Eco Water Techs

Eco Water Techs - Overview
Eco Water Techs - Product / Service
Eco Water Techs - Key offerings
SWOT

15.7 Heathland Group Ltd.

Heathland Group Ltd. - Overview
Heathland Group Ltd. - Product / Service
Heathland Group Ltd. - Key offerings
SWOT

15.8 JC France Industrie

JC France Industrie - Overview
JC France Industrie - Product / Service
JC France Industrie - Key offerings
SWOT

15.9 Newterra Ltd.

Newterra Ltd. - Overview
Newterra Ltd. - Product / Service
Newterra Ltd. - Key offerings
SWOT

15.10 Ovivo Inc.

Ovivo Inc. - Overview
Ovivo Inc. - Product / Service
Ovivo Inc. - Key offerings
SWOT

15.11 Photon Water

Photon Water - Overview
Photon Water - Product / Service
Photon Water - Key offerings
SWOT

15.12 SSI Aeration Inc.

SSI Aeration Inc. - Overview
SSI Aeration Inc. - Product / Service
SSI Aeration Inc. - Key offerings
SWOT

15.13 Sulzer Ltd.

Sulzer Ltd. - Overview
Sulzer Ltd. - Business segments
Sulzer Ltd. - Key news
Sulzer Ltd. - Key offerings
Sulzer Ltd. - Segment focus
SWOT

15.14 Veolia Environment SA

Veolia Environment SA - Overview
Veolia Environment SA - Business segments
Veolia Environment SA - Key offerings
Veolia Environment SA - Segment focus
SWOT

15.15 Vishuddhi Enviro Pvt. Ltd.

Vishuddhi Enviro Pvt. Ltd. - Overview
Vishuddhi Enviro Pvt. Ltd. - Product / Service
Vishuddhi Enviro Pvt. Ltd. - Key offerings
SWOT

15.16 Water Garden Ltd.

Water Garden Ltd. - Overview
Water Garden Ltd. - Product / Service
Water Garden Ltd. - Key offerings
SWOT

15.17 WesTech Engineering LLC

WesTech Engineering LLC - Overview
WesTech Engineering LLC - Product / Service
WesTech Engineering LLC - Key offerings
SWOT

15.18 Xylem Inc.

Xylem Inc. - Overview
Xylem Inc. - Business segments
Xylem Inc. - Key news
Xylem Inc. - Key offerings
Xylem Inc. - Segment focus
SWOT

16. Appendix

16.1 Scope of the report

Market definition
Objectives
Notes and caveats

16.2 Inclusions and exclusions checklist

Inclusions checklist
Exclusions checklist

16.3 Currency conversion rates for US$

16.4 Research methodology

16.5 Data procurement

Information sources

16.6 Data validation

16.7 Validation techniques employed for market sizing

16.8 Data synthesis

16.9 360 degree market analysis

16.10 List of abbreviations

Research Methodology

Technavio presents a detailed picture of the market by way of study, synthesis, and summation of data from multiple sources. The analysts have presented the various facets of the market with a particular focus on identifying the key industry influencers. The data thus presented is comprehensive, reliable, and the result of extensive research, both primary and secondary.

INFORMATION SOURCES

Primary sources

  • Manufacturers and suppliers
  • Channel partners
  • Industry experts
  • Strategic decision makers

Secondary sources

  • Industry journals and periodicals
  • Government data
  • Financial reports of key industry players
  • Historical data
  • Press releases

DATA ANALYSIS

Data Synthesis

  • Collation of data
  • Estimation of key figures
  • Analysis of derived insights

Data Validation

  • Triangulation with data models
  • Reference against proprietary databases
  • Corroboration with industry experts

REPORT WRITING

Qualitative

  • Market drivers
  • Market challenges
  • Market trends
  • Five forces analysis

Quantitative

  • Market size and forecast
  • Market segmentation
  • Geographical insights
  • Competitive landscape

Interested in this report?

Get your sample now to see our research methodology and insights!

Download Now

Frequently Asked Questions

Water Aeration Systems market growth will increase by USD 5135.0 million during 2026-2030.

The Water Aeration Systems market is expected to grow at a CAGR of 5.6% during 2026-2030.

Water Aeration Systems market is segmented by Type (Subsurface aerators, Surface aerators, Hybrid aerators) End-user (Municipalities, Industrial, Others) Technology (Fine bubble aeration, Coarse bubble aeration, Mechanical aeration, Jet aeration, Others)

Air Products and Chem Inc., Airolator Corp., Eco Water Techs, Heathland Group Ltd., Hydrologic Distribution Co., JC France Industrie, Napier Reid Ltd., Newterra Ltd., Otterbine Barebo Inc., Ovivo Inc., Photon Water, SSI Aeration Inc., Sulzer Ltd., Toshio Technology Co. Ltd., Veolia Environment SA, Vertex Aquatic Solutions, Vishuddhi Enviro Pvt. Ltd., Water Garden Ltd., WesTech Engineering LLC, Xylem Inc. are a few of the key vendors in the Water Aeration Systems market.

APAC will register the highest growth rate of 42.2% among the other regions. Therefore, the Water Aeration Systems market in APAC is expected to garner significant business opportunities for the vendors during the forecast period.

China, Japan, India, South Korea, Australia, Indonesia, US, Canada, Mexico, Germany, UK, France, Italy, Spain, The Netherlands, Saudi Arabia, UAE, South Africa, Turkey, Israel, Brazil, Argentina, Chile

  • Integration of energy-efficient fine bubble diffusion and industrialization of OPEX reduction mandates is the driving factor this market.

The Water Aeration Systems market vendors should focus on grabbing business opportunities from the Type segment as it accounted for the largest market share in the base year.
RIA - Research AI Assistant
Ask RIA