Web Application Firewall Market Size 2024-2028
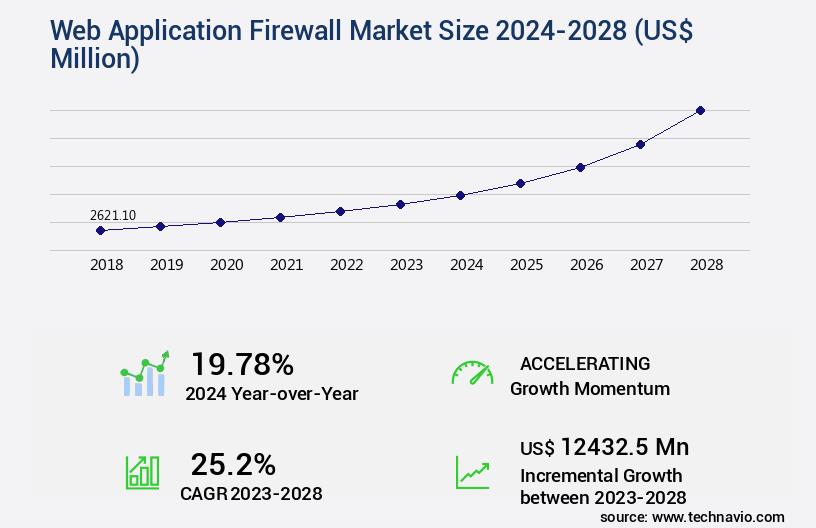
The web application firewall market size is valued to increase USD 12.43 billion, at a CAGR of 25.2% from 2023 to 2028. Increasing demand for cloud-based system will drive the web application firewall market.
Major Market Trends & Insights
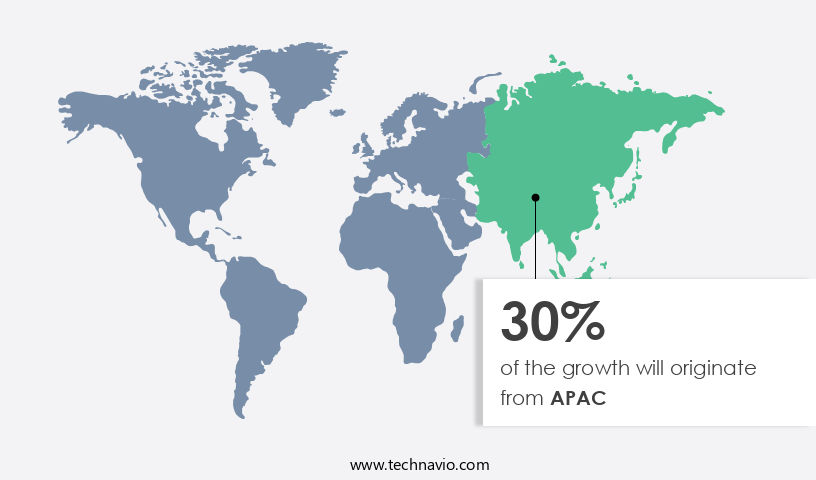
	- APAC dominated the market and accounted for a 30% growth during the forecast period.
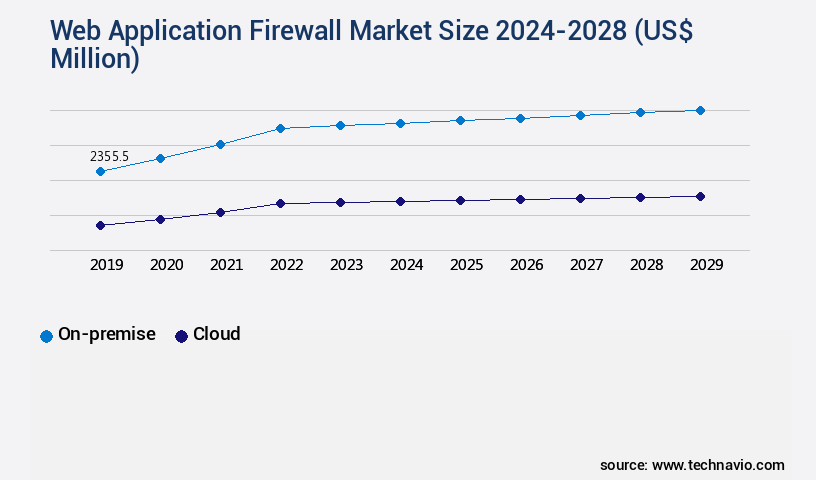
- By Deployment - On-premise segment was valued at USD 2.03 billion in 2022
- By End-user - E-Commemrce segment accounted for the largest market revenue share in 2022
Market Size & Forecast
	- Market Opportunities: USD 602.76 million
- Market Future Opportunities: USD 12432.50 million
- CAGR : 25.2%
- APAC: Largest market in 2022
Market Summary
	- The Web Application Firewall (WAF) market is a dynamic and ever-evolving landscape, characterized by the continuous adoption of advanced technologies and applications. With the increasing demand for cloud-based systems and the prevalence of shadow IT, organizations are increasingly relying on WAF solutions to secure their digital assets. According to a recent report, the WAF market is expected to witness significant growth, with cloud-based WAFs accounting for over 30% of the market share. However, the market faces challenges such as the threat from substitutes and the complexity of implementing and managing WAFs.
- Despite these challenges, opportunities abound, particularly in the form of advanced threat protection and compliance with evolving regulations like GDPR and HIPAA. As the market continues to unfold, it is essential for businesses to stay informed about the latest trends and developments to make informed decisions.
What will be the Size of the Web Application Firewall Market during the forecast period?

Get Key Insights on Market Forecast (PDF) Request Free Sample
How is the Web Application Firewall Market Segmented and what are the key trends of market segmentation?
The web application firewall industry research report provides comprehensive data (region-wise segment analysis), with forecasts and estimates in "USD million" for the period 2024-2028, as well as historical data from 2018-2022 for the following segments.
	- Deployment
	
	
- End-user
	
		- E-Commemrce
- BFSI
- Government
- Others
 
- Component
	
	
- Organization Size
	
		- Large Enterprises
- Small & Medium Enterprises (SMEs)
 
- Geography
	
		- North America
		
		
- Europe
		
		
- Middle East and Africa
		
		
- APAC
		
		
- South America
		
		
- Rest of World (ROW)


By Deployment Insights
The on-premise segment is estimated to witness significant growth during the forecast period.
The Web Application Firewall (WAF) market encompasses a range of security solutions designed to safeguard applications from various cyber threats. Session management, digital certificate validation, and web application security are integral components, ensuring secure user sessions and validating certificates. HTTP request filtering, SQL injection prevention, and API security address specific vulnerabilities, while rate limiting, web server security, and authentication mechanisms enhance overall security. Compliance regulations, such as PCI DSS and HIPAA, drive the market's growth, with vulnerability scanning, access control lists, IP address blocking, and application security testing ensuring regulatory compliance. Machine learning security, application control, security auditing, anomaly detection, SSL/TLS encryption, and DDoS mitigation offer advanced protection against sophisticated attacks.

Request Free Sample
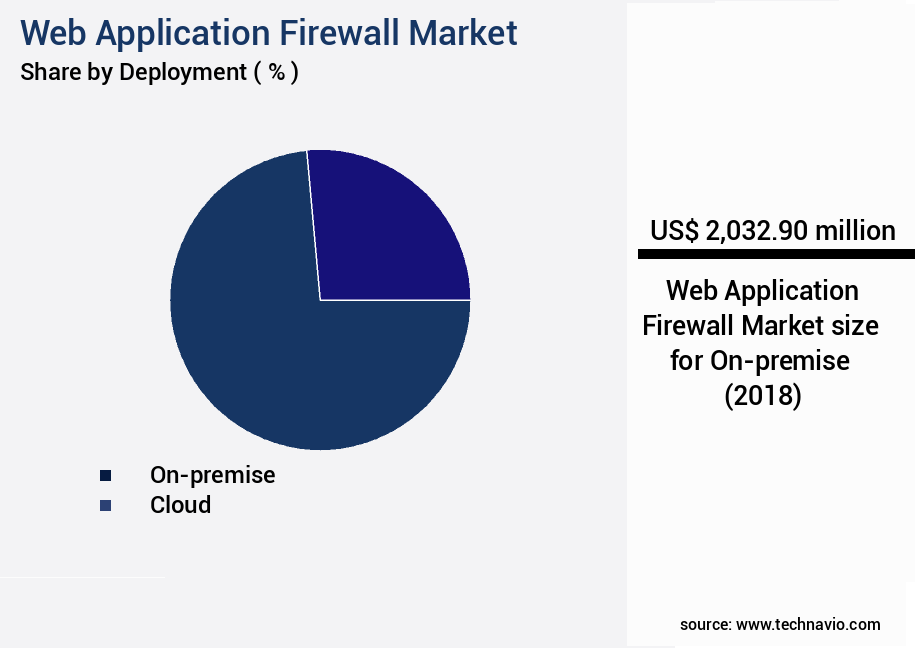
The On-premise segment was valued at USD 2.03 billion in 2018 and showed a gradual increase during the forecast period.
Market trends include the increasing adoption of positive security models, security logging, endpoint security, bot management, firewall rules, data loss prevention, malware scanning, behavior analysis, signature-based detection, and threat intelligence feeds. Authorization policies, API gateway security, DOS protection, runtime application self-protection, and certificate management are also essential elements. In 2022, the on-premise segment accounted for a significant market share, with large enterprises preferring this deployment model due to increased control and ownership. Approximately 60% of enterprises use on-premise WAF solutions. However, the cloud-based segment is expected to grow at a faster pace, as businesses increasingly adopt cloud-based solutions for their flexibility and cost-effectiveness.
Around 40% of enterprises are projected to adopt cloud-based WAF solutions by 2026. The market's continuous evolution reflects the ongoing need for advanced security solutions to protect applications from evolving threats.

Request Free Sample
Regional Analysis
APAC is estimated to contribute 30% to the growth of the global market during the forecast period.Technavio's analysts have elaborately explained the regional trends and drivers that shape the market during the forecast period.

See How Web Application Firewall Market Demand is Rising in APAC Request Free Sample
The North American market is projected to expand significantly due to the escalating demand for cybersecurity solutions and the increasing adoption of the Bring Your Own Device (BYOD) policy. The market growth is further fueled by the increasing number of cyberattacks and data breaches in enterprises. In response, government bodies are imposing stringent regulations on data security and consumer privacy, necessitating the deployment of advanced security measures. According to recent studies, the number of cyberattacks in the US alone increased by 22% in 2020.
Moreover, a survey revealed that 74% of organizations experienced an increase in cybersecurity threats in 2021. These trends underscore the importance of robust cybersecurity solutions, particularly web application firewalls, in safeguarding businesses and protecting sensitive data.
Market Dynamics
Our researchers analyzed the data with 2023 as the base year, along with the key drivers, trends, and challenges. A holistic analysis of drivers will help companies refine their marketing strategies to gain a competitive advantage.
The global web application firewall (WAF) market is a dynamic and evolving landscape, driven by the increasing complexity of digital threats and the need for robust application security. WAF solutions are essential for businesses to safeguard their web applications against various cyber threats, including real-time threat intelligence integration, advanced bot detection mechanisms, and preventing cross-site request forgery attacks. Effective security logging practices and automated vulnerability scanning and remediation are crucial components of WAF solutions, helping organizations manage access control lists effectively and mitigate distributed denial-of-service attacks. Implementing robust authentication protocols, configuring rate limiting policies, and enhancing security monitoring dashboards are also essential aspects of WAF solutions.
Proactive threat detection strategies, such as implementing strong authorization policies, effective security incident response plans, and strengthening application security postures, are becoming increasingly important in today's digital landscape. Moreover, the adoption of secure coding standards implementation and machine learning-powered threat detection is on the rise, improving web application security performance and optimizing firewall rule effectiveness. A significant portion of new product developments in the WAF market focuses on advanced features, such as secure API gateway implementation and implementing strong authorization policies. According to market intelligence, more than 60% of organizations worldwide have adopted WAF solutions, with a notable increase in adoption rates in the financial services sector.
This sector accounts for over 30% of the total WAF market share, reflecting the critical importance of application security in this industry. In contrast, the healthcare sector represents a smaller but rapidly growing segment, with adoption rates nearly doubling those in the retail sector. This trend is driven by the increasing digitization of healthcare services and the need for stringent data security. Overall, the WAF market is poised for continued growth, with businesses recognizing the importance of effective application security in the digital age.

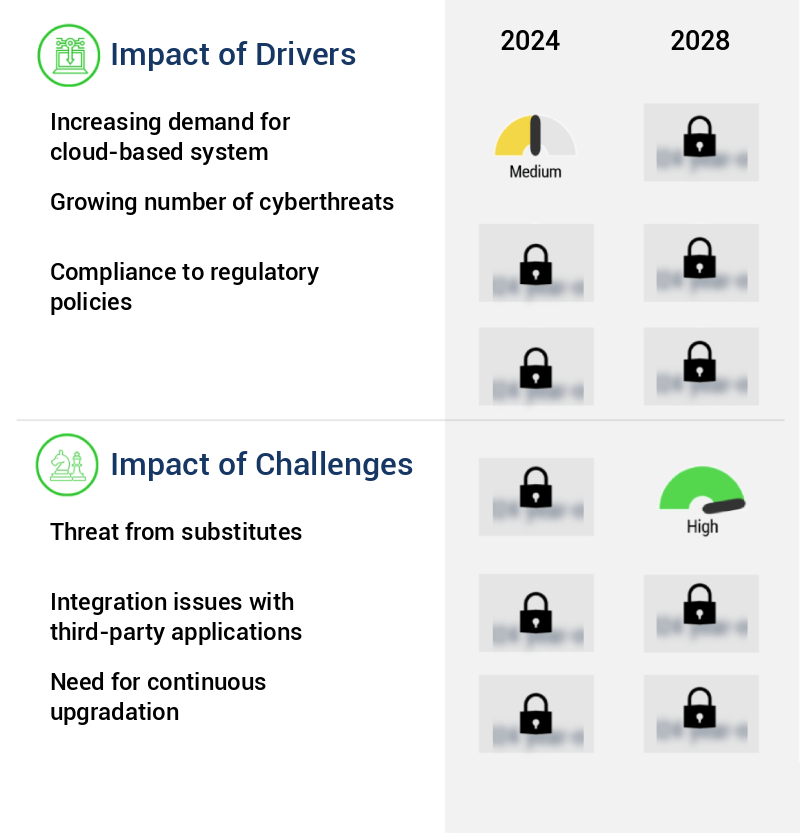
What are the key market drivers leading to the rise in the adoption of Web Application Firewall Industry?
	- The surge in demand for cloud-based systems serves as the primary catalyst for market growth. 
	- In today's business landscape, enterprises across sectors, including finance, manufacturing, healthcare, and retail, are embracing cloud computing technologies to optimize their IT infrastructure and minimize capital expenditures. The adoption of cloud solutions enables swift application scaling to meet evolving business demands. Seamless integration with external third-party applications is another advantage of cloud computing. Cloud firewalls, a crucial component of cloud security, are software-based network security devices deployed on the cloud. They offer several benefits, such as high availability, scalability, and the flexibility to filter traffic from diverse sources. By implementing cloud firewalls, enterprises can secure their private networks against unauthorized access, ensuring business continuity and data protection.
- The benefits of cloud computing extend beyond cost savings and enhanced security. Its flexibility and scalability allow businesses to respond swiftly to market changes and customer demands. Additionally, cloud solutions enable collaboration and data sharing among teams, fostering innovation and productivity. As the cloud computing market continues to evolve, businesses must stay informed about the latest trends and best practices to maximize their investment and maintain a competitive edge. By leveraging reliable, data-driven insights and expert guidance, organizations can confidently navigate the complexities of cloud adoption and reap the rewards of this transformative technology.
What are the market trends shaping the Web Application Firewall Industry?
	- Shadow IT's prevalence represents the latest market trend. The increasing use of unsanctioned technology solutions within organizations is a significant market development.
	- Shadow IT refers to digital solutions adopted by enterprises without explicit approval from their management. IoT devices and cloud-based services are major drivers of this trend, as they offer instant scalability and bypass lengthy IT procurement processes. However, the lack of IT oversight poses a significant risk to data security. According to recent studies, over 70% of enterprise workloads are estimated to be outside of IT's control. This shift is not a passing fad, but an evolving pattern in the business landscape.
- The growing prevalence of shadow IT underscores the need for more agile and adaptive IT strategies. By understanding the dynamics of this market, enterprises can strike a balance between innovation and security. The challenge lies in implementing effective policies and tools to manage and secure shadow IT while fostering a culture of collaboration and innovation.
What challenges does the Web Application Firewall Industry face during its growth?
	- The presence of formidable competition from substitutes poses a significant challenge to the expansion and growth of the industry. 
	- Open-source web application firewall solutions are posing a significant challenge to the market, with their increasing popularity in developing economies like India and China. These solutions, which can be downloaded and run on various platforms, offer an affordable alternative to small-scale enterprises unable to invest in costly on-premises or cloud-based application security solutions. For instance, SonarSource S.A.'s SonarQube is an open-source security testing tool that enables enterprises to assess the source code quality of their web applications and uncover vulnerabilities, such as cross-site scripting, denial-of-service (DoS) attacks, and SQL injection.
- The global adoption of open-source web application firewalls is on the rise, as businesses seek to strengthen their cybersecurity defenses without incurring high costs. This trend is expected to persist throughout the forecast period.
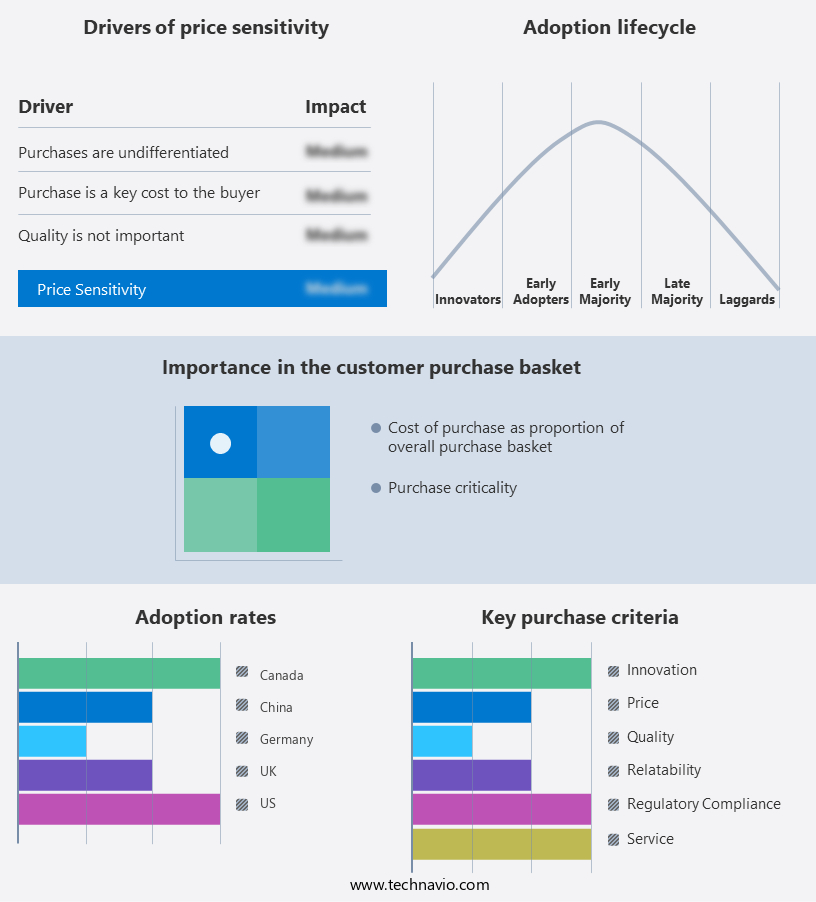
Exclusive Customer Landscape
The web application firewall market forecasting report includes the adoption lifecycle of the market, covering from the innovator's stage to the laggard's stage. It focuses on adoption rates in different regions based on penetration. Furthermore, the web application firewall market report also includes key purchase criteria and drivers of price sensitivity to help companies evaluate and develop their market growth analysis strategies.

 Customer Landscape of Web Application Firewall Industry
Competitive Landscape & Market Insights
Companies are implementing various strategies, such as strategic alliances, web application firewall market forecast, partnerships, mergers and acquisitions, geographical expansion, and product/service launches, to enhance their presence in the industry.
Akamai Technologies, Inc. - The company specializes in web application firewall technologies, including A10 Thunder Application Delivery Controllers, providing robust security solutions for businesses seeking to protect their online applications from cyber threats.
The industry research and growth report includes detailed analyses of the competitive landscape of the market and information about key companies, including:
	- Akamai Technologies, Inc.
- Applicure Technologies Ltd.
- Barracuda Networks, Inc.
- Citrix Systems, Inc.
- Cloudflare, Inc.
- F5, Inc.
- Fortinet, Inc.
- Imperva, Inc.
- Microsoft Corporation
- NSFOCUS Technologies Group Co. Ltd.
- Palo Alto Networks, Inc.
- Qualys, Inc.
- Radware Ltd.
- Sophos Ltd.
- Sucuri Inc.
- Trend Micro Incorporated
- Trustwave Holdings, Inc.
- Varonis Systems, Inc.
- Verizon Communications Inc.
- WAFWarden
Qualitative and quantitative analysis of companies has been conducted to help clients understand the wider business environment as well as the strengths and weaknesses of key industry players. Data is qualitatively analyzed to categorize companies as pure play, category-focused, industry-focused, and diversified; it is quantitatively analyzed to categorize companies as dominant, leading, strong, tentative, and weak.
Recent Development and News in Web Application Firewall Market
	- In January 2024, Imperva, a leading cybersecurity company, announced the launch of its new WAF-as-a-Service (Web Application Firewall) solution, "SecureSphere," which includes advanced bot management capabilities and AI-driven threat intelligence. (Source: Imperva Press Release)
- In March 2024, Akamai Technologies, a global content delivery network and cybersecurity solutions provider, entered into a strategic partnership with Google Cloud to integrate Akamai's Kona Site Defender WAF with Google Cloud's security suite. (Source: Akamai Press Release)
- In July 2024, Cloudflare, a web performance and security company, raised USD 250 million in a funding round, which it plans to use to expand its WAF offerings and enhance its threat intelligence capabilities. (Source: Wall Street Journal)
- In May 2025, the European Union's General Data Protection Regulation (GDPR) was updated to include more stringent requirements for website security, including the use of WAFs to protect against web application attacks. (Source: EU GDPR Press Release)
Dive into Technavio's robust research methodology, blending expert interviews, extensive data synthesis, and validated models for unparalleled Web Application Firewall Market insights. See full methodology.
	
		
			| Market Scope | 
		
			| Report Coverage | Details | 
		
			| Page number | 177 | 
		
			| Base year | 2023 | 
		
			| Historic period | 2018-2022 | 
		
			| Forecast period | 2024-2028 | 
		
			| Growth momentum & CAGR | Accelerate at a CAGR of 25.2% | 
		
			| Market growth 2024-2028 | USD 12432.5 million | 
		
			| Market structure | Fragmented | 
		
			| YoY growth 2023-2024(%) | 19.78 | 
		
			| Key countries | US, Canada, Germany, UK, Italy, France, China, India, Japan, Brazil, Egypt, UAE, Oman, Argentina, KSA, UAE, Brazil, and Rest of World (ROW) | 
		
			| Competitive landscape | Leading Companies, Market Positioning of Companies, Competitive Strategies, and Industry Risks | 
	
Request Free Sample
Research Analyst Overview
	- In the ever-evolving landscape of web application security, the market for solutions encompassing session management, digital certificate validation, and various protective measures continues to gain momentum. This dynamic arena includes essential components such as HTTP request filtering, SQL injection prevention, API security, rate limiting, and web server security. Authentication mechanisms, public key infrastructure, and compliance regulations are integral elements shaping the market's direction. Vulnerability scanning, access control lists, IP address blocking, application security testing, machine learning security, and application control further fortify the defense against potential threats. SSL/TLS encryption, DDoS mitigation, cross-site scripting protection, intrusion detection, certificate management, penetration testing, positive security models, security logging, endpoint security, bot management, firewall rules, data loss prevention, malware scanning, behavior analysis, signature-based detection, and threat intelligence feeds are all crucial elements that contribute to the market's complexity and growth.
- As the need for robust and comprehensive web application security solutions persists, the competition intensifies, with companies continually refining their offerings to meet the evolving threat landscape. The market's continuous unfolding is marked by the adoption of advanced technologies like machine learning and AI, which enable more effective threat detection and response. This market's diversity and dynamism offer significant opportunities for businesses seeking to protect their digital assets. The integration of various security measures, from session management to advanced threat intelligence, allows organizations to build a multi-layered defense strategy, ensuring they remain resilient against the ever-evolving cyber threats.
What are the Key Data Covered in this Web Application Firewall Market Research and Growth Report?
	- 
	What is the expected growth of the Web Application Firewall Market between 2024 and 2028? 
- 
	What segmentation does the market report cover? 
		- 
		The report segmented by Deployment (On-premise and Cloud), End-user (E-Commemrce, BFSI, Government, and Others), Geography (North America, Europe, APAC, Middle East and Africa, and South America), Component (Solution and Services), and Organization Size (Large Enterprises and Small & Medium Enterprises (SMEs)) 
 
- 
	Which regions are analyzed in the report? 
		- 
		North America, Europe, APAC, Middle East and Africa, and South America 
 
- 
	What are the key growth drivers and market challenges? 
- 
	Who are the major players in the Web Application Firewall Market? 
		- 
		Key Companies Akamai Technologies, Inc., Applicure Technologies Ltd., Barracuda Networks, Inc., Citrix Systems, Inc., Cloudflare, Inc., F5, Inc., Fortinet, Inc., Imperva, Inc., Microsoft Corporation, NSFOCUS Technologies Group Co. Ltd., Palo Alto Networks, Inc., Qualys, Inc., Radware Ltd., Sophos Ltd., Sucuri Inc., Trend Micro Incorporated, Trustwave Holdings, Inc., Varonis Systems, Inc., Verizon Communications Inc., and WAFWarden 
 
Market Research Insights
	- The web application firewall (WAF) market encompasses a range of solutions designed to safeguard applications from various cyber threats. The growth can be attributed to the increasing adoption of cloud services, the proliferation of microservices architecture, and the rising demand for advanced security features such as threat detection, policy enforcement, and incident response.
- In contrast, the security monitoring market, which includes WAF solutions, is projected to grow. This comparison highlights the significant market potential for WAF solutions within the broader security monitoring landscape. As organizations continue to prioritize application security and adopt innovative technologies, the demand for WAF solutions is expected to remain strong.
We can help! Our analysts can customize this web application firewall market research report to meet your requirements. 
Get in touch
                        
          
            1 Executive Summary
- 1.1 Market overview- Executive Summary - Chart on Market Overview
- Executive Summary - Data Table on Market Overview
- Executive Summary - Chart on Global Market Characteristics
- Executive Summary - Chart on Market by Geography
- Executive Summary - Chart on Market Segmentation by Deployment
- Executive Summary - Chart on Market Segmentation by End-user
- Executive Summary - Chart on Incremental Growth
- Executive Summary - Data Table on Incremental Growth
- Executive Summary - Chart on Company Market Positioning
 
2 Market Landscape
- 2.1 Market ecosystem- Parent Market
- Data Table on - Parent Market
 
- 2.2 Market characteristics- Market characteristics analysis
 
3 Market Sizing
- 3.1 Market definition- Offerings of companies included in the market definition
 
- 3.2 Market segment analysis
- 3.4 Market outlook: Forecast for 2023-2028- Chart on Global - Market size and forecast 2023-2028 ($ million)
- Data Table on Global - Market size and forecast 2023-2028 ($ million)
- Chart on Global Market: Year-over-year growth 2023-2028 (%)
- Data Table on Global Market: Year-over-year growth 2023-2028 (%)
 
4 Historic Market Size
- 4.1 Global Web Application Firewall Market 2018 - 2022- Historic Market Size - Data Table on Global Web Application Firewall Market 2018 - 2022 ($ million)
 
- 4.2 Deployment segment analysis 2018 - 2022- Historic Market Size - Deployment Segment 2018 - 2022 ($ million)
 
- 4.3 End-user segment analysis 2018 - 2022- Historic Market Size - End-user Segment 2018 - 2022 ($ million)
 
- 4.4 Geography segment analysis 2018 - 2022- Historic Market Size - Geography Segment 2018 - 2022 ($ million)
 
- 4.5 Country segment analysis 2018 - 2022- Historic Market Size - Country Segment 2018 - 2022 ($ million)
 
5 Five Forces Analysis
- 5.1 Five forces summary- Five forces analysis - Comparison between 2023 and 2028
 
- 5.2 Bargaining power of buyers- Bargaining power of buyers - Impact of key factors 2023 and 2028
 
- 5.3 Bargaining power of suppliers- Bargaining power of suppliers - Impact of key factors in 2023 and 2028
 
- 5.4 Threat of new entrants- Threat of new entrants - Impact of key factors in 2023 and 2028
 
- 5.5 Threat of substitutes- Threat of substitutes - Impact of key factors in 2023 and 2028
 
- 5.6 Threat of rivalry- Threat of rivalry - Impact of key factors in 2023 and 2028
 
- 5.7 Market condition- Chart on Market condition - Five forces 2023 and 2028
 
6 Market Segmentation by Deployment
- 6.1 Market segments- Chart on Deployment - Market share (2023-2028) (%)
- Data Table on Deployment - Market share (2023-2028) (%)
 
- 6.2 Comparison by Deployment- Chart on Comparison by Deployment
- Data Table on Comparison by Deployment
 
- 6.3 On-premise - Market size and forecast (2023-2028)- Chart on On-premise - Market size and forecast (2023-2028) ($ million)
- Data Table on On-premise - Market size and forecast (2023-2028) ($ million)
- Chart on On-premise - Year-over-year growth (2023-2028) (%)
- Data Table on On-premise - Year-over-year growth (2023-2028) (%)
 
- 6.4 Cloud - Market size and forecast (2023-2028)- Chart on Cloud - Market size and forecast (2023-2028) ($ million)
- Data Table on Cloud - Market size and forecast (2023-2028) ($ million)
- Chart on Cloud - Year-over-year growth (2023-2028) (%)
- Data Table on Cloud - Year-over-year growth (2023-2028) (%)
 
- 6.5 Market opportunity by Deployment- Market opportunity by Deployment ($ million)
- Data Table on Market opportunity by Deployment ($ million)
 
7 Market Segmentation by End-user
- 7.1 Market segments- Chart on End-user - Market share (2023-2028) (%)
- Data Table on End-user - Market share (2023-2028) (%)
 
- 7.2 Comparison by End-user- Chart on Comparison by End-user
- Data Table on Comparison by End-user
 
- 7.3 E-Commemrce - Market size and forecast (2023-2028)- Chart on E-Commemrce - Market size and forecast (2023-2028) ($ million)
- Data Table on E-Commemrce - Market size and forecast (2023-2028) ($ million)
- Chart on E-Commemrce - Year-over-year growth (2023-2028) (%)
- Data Table on E-Commemrce - Year-over-year growth (2023-2028) (%)
 
- 7.4 BFSI - Market size and forecast (2023-2028)- Chart on BFSI - Market size and forecast (2023-2028) ($ million)
- Data Table on BFSI - Market size and forecast (2023-2028) ($ million)
- Chart on BFSI - Year-over-year growth (2023-2028) (%)
- Data Table on BFSI - Year-over-year growth (2023-2028) (%)
 
- 7.5 Government - Market size and forecast (2023-2028)- Chart on Government - Market size and forecast (2023-2028) ($ million)
- Data Table on Government - Market size and forecast (2023-2028) ($ million)
- Chart on Government - Year-over-year growth (2023-2028) (%)
- Data Table on Government - Year-over-year growth (2023-2028) (%)
 
- 7.6 Others - Market size and forecast (2023-2028)- Chart on Others - Market size and forecast (2023-2028) ($ million)
- Data Table on Others - Market size and forecast (2023-2028) ($ million)
- Chart on Others - Year-over-year growth (2023-2028) (%)
- Data Table on Others - Year-over-year growth (2023-2028) (%)
 
- 7.7 Market opportunity by End-user- Market opportunity by End-user ($ million)
- Data Table on Market opportunity by End-user ($ million)
 
8 Market Segmentation by Component
- 8.1 Market segments- Chart on Component - Market share (2023-2028) (%)
- Data Table on Component - Market share (2023-2028) (%)
 
- 8.2 Comparison by Component- Chart on Comparison by Component
- Data Table on Comparison by Component
 
- 8.3 Solution - Market size and forecast (2023-2028)- Chart on Solution - Market size and forecast (2023-2028) ($ million)
- Data Table on Solution - Market size and forecast (2023-2028) ($ million)
- Chart on Solution - Year-over-year growth (2023-2028) (%)
- Data Table on Solution - Year-over-year growth (2023-2028) (%)
 
- 8.4 Services - Market size and forecast (2023-2028)- Chart on Services - Market size and forecast (2023-2028) ($ million)
- Data Table on Services - Market size and forecast (2023-2028) ($ million)
- Chart on Services - Year-over-year growth (2023-2028) (%)
- Data Table on Services - Year-over-year growth (2023-2028) (%)
 
- 8.5 Market opportunity by Component- Market opportunity by Component ($ million)
- Data Table on Market opportunity by Component ($ million)
 
9 Market Segmentation by Organization Size
- 9.1 Market segments- Chart on Organization Size - Market share (2023-2028) (%)
- Data Table on Organization Size - Market share (2023-2028) (%)
 
- 9.2 Comparison by Organization Size- Chart on Comparison by Organization Size
- Data Table on Comparison by Organization Size
 
- 9.3 Large Enterprises - Market size and forecast (2023-2028)- Chart on Large Enterprises - Market size and forecast (2023-2028) ($ million)
- Data Table on Large Enterprises - Market size and forecast (2023-2028) ($ million)
- Chart on Large Enterprises - Year-over-year growth (2023-2028) (%)
- Data Table on Large Enterprises - Year-over-year growth (2023-2028) (%)
 
- 9.4 Small & Medium Enterprises (SMEs) - Market size and forecast (2023-2028)- Chart on Small & Medium Enterprises (SMEs) - Market size and forecast (2023-2028) ($ million)
- Data Table on Small & Medium Enterprises (SMEs) - Market size and forecast (2023-2028) ($ million)
- Chart on Small & Medium Enterprises (SMEs) - Year-over-year growth (2023-2028) (%)
- Data Table on Small & Medium Enterprises (SMEs) - Year-over-year growth (2023-2028) (%)
 
- 9.5 Market opportunity by Organization Size- Market opportunity by Organization Size ($ million)
- Data Table on Market opportunity by Organization Size ($ million)
 
10 Customer Landscape
- 10.1 Customer landscape overview- Analysis of price sensitivity, lifecycle, customer purchase basket, adoption rates, and purchase criteria
 
11 Geographic Landscape
- 11.1 Geographic segmentation- Chart on Market share by geography 2023-2028 (%)
- Data Table on Market share by geography 2023-2028 (%)
 
- 11.2 Geographic comparison- Chart on Geographic comparison
- Data Table on Geographic comparison
 
- 11.3 North America - Market size and forecast 2023-2028- Chart on North America - Market size and forecast 2023-2028 ($ million)
- Data Table on North America - Market size and forecast 2023-2028 ($ million)
- Chart on North America - Year-over-year growth 2023-2028 (%)
- Data Table on North America - Year-over-year growth 2023-2028 (%)
 
- 11.4 Europe - Market size and forecast 2023-2028- Chart on Europe - Market size and forecast 2023-2028 ($ million)
- Data Table on Europe - Market size and forecast 2023-2028 ($ million)
- Chart on Europe - Year-over-year growth 2023-2028 (%)
- Data Table on Europe - Year-over-year growth 2023-2028 (%)
 
- 11.5 APAC - Market size and forecast 2023-2028- Chart on APAC - Market size and forecast 2023-2028 ($ million)
- Data Table on APAC - Market size and forecast 2023-2028 ($ million)
- Chart on APAC - Year-over-year growth 2023-2028 (%)
- Data Table on APAC - Year-over-year growth 2023-2028 (%)
 
- 11.6 Middle East and Africa - Market size and forecast 2023-2028- Chart on Middle East and Africa - Market size and forecast 2023-2028 ($ million)
- Data Table on Middle East and Africa - Market size and forecast 2023-2028 ($ million)
- Chart on Middle East and Africa - Year-over-year growth 2023-2028 (%)
- Data Table on Middle East and Africa - Year-over-year growth 2023-2028 (%)
 
- 11.7 South America - Market size and forecast 2023-2028- Chart on South America - Market size and forecast 2023-2028 ($ million)
- Data Table on South America - Market size and forecast 2023-2028 ($ million)
- Chart on South America - Year-over-year growth 2023-2028 (%)
- Data Table on South America - Year-over-year growth 2023-2028 (%)
 
- 11.8 US - Market size and forecast 2023-2028- Chart on US - Market size and forecast 2023-2028 ($ million)
- Data Table on US - Market size and forecast 2023-2028 ($ million)
- Chart on US - Year-over-year growth 2023-2028 (%)
- Data Table on US - Year-over-year growth 2023-2028 (%)
 
- 11.9 China - Market size and forecast 2023-2028- Chart on China - Market size and forecast 2023-2028 ($ million)
- Data Table on China - Market size and forecast 2023-2028 ($ million)
- Chart on China - Year-over-year growth 2023-2028 (%)
- Data Table on China - Year-over-year growth 2023-2028 (%)
 
- 11.10 Germany - Market size and forecast 2023-2028- Chart on Germany - Market size and forecast 2023-2028 ($ million)
- Data Table on Germany - Market size and forecast 2023-2028 ($ million)
- Chart on Germany - Year-over-year growth 2023-2028 (%)
- Data Table on Germany - Year-over-year growth 2023-2028 (%)
 
- 11.11 Canada - Market size and forecast 2023-2028- Chart on Canada - Market size and forecast 2023-2028 ($ million)
- Data Table on Canada - Market size and forecast 2023-2028 ($ million)
- Chart on Canada - Year-over-year growth 2023-2028 (%)
- Data Table on Canada - Year-over-year growth 2023-2028 (%)
 
- 11.12 UK - Market size and forecast 2023-2028- Chart on UK - Market size and forecast 2023-2028 ($ million)
- Data Table on UK - Market size and forecast 2023-2028 ($ million)
- Chart on UK - Year-over-year growth 2023-2028 (%)
- Data Table on UK - Year-over-year growth 2023-2028 (%)
 
- 11.13 Market opportunity by geography- Market opportunity by geography ($ million)
- Data Tables on Market opportunity by geography ($ million)
 
- 11.14 Italy - Market size and forecast (2023-2028)- Chart on Italy - Market size and forecast (2023-2028) ($ million)
- Data Table on Italy - Market size and forecast (2023-2028) ($ million)
- Chart on Italy - Year-over-year growth (2023-2028) (%)
- Data Table on Italy - Year-over-year growth (2023-2028) (%)
 
- 11.15 France - Market size and forecast (2023-2028)- Chart on France - Market size and forecast (2023-2028) ($ million)
- Data Table on France - Market size and forecast (2023-2028) ($ million)
- Chart on France - Year-over-year growth (2023-2028) (%)
- Data Table on France - Year-over-year growth (2023-2028) (%)
 
- 11.16 India - Market size and forecast (2023-2028)- Chart on India - Market size and forecast (2023-2028) ($ million)
- Data Table on India - Market size and forecast (2023-2028) ($ million)
- Chart on India - Year-over-year growth (2023-2028) (%)
- Data Table on India - Year-over-year growth (2023-2028) (%)
 
- 11.17 Japan - Market size and forecast (2023-2028)- Chart on Japan - Market size and forecast (2023-2028) ($ million)
- Data Table on Japan - Market size and forecast (2023-2028) ($ million)
- Chart on Japan - Year-over-year growth (2023-2028) (%)
- Data Table on Japan - Year-over-year growth (2023-2028) (%)
 
- 11.18 Brazil - Market size and forecast (2023-2028)- Chart on Brazil - Market size and forecast (2023-2028) ($ million)
- Data Table on Brazil - Market size and forecast (2023-2028) ($ million)
- Chart on Brazil - Year-over-year growth (2023-2028) (%)
- Data Table on Brazil - Year-over-year growth (2023-2028) (%)
 
- 11.19 Egypt - Market size and forecast (2023-2028)- Chart on Egypt - Market size and forecast (2023-2028) ($ million)
- Data Table on Egypt - Market size and forecast (2023-2028) ($ million)
- Chart on Egypt - Year-over-year growth (2023-2028) (%)
- Data Table on Egypt - Year-over-year growth (2023-2028) (%)
 
- 11.20 UAE - Market size and forecast (2023-2028)- Chart on UAE - Market size and forecast (2023-2028) ($ million)
- Data Table on UAE - Market size and forecast (2023-2028) ($ million)
- Chart on UAE - Year-over-year growth (2023-2028) (%)
- Data Table on UAE - Year-over-year growth (2023-2028) (%)
 
- 11.21 Oman - Market size and forecast (2023-2028)- Chart on Oman - Market size and forecast (2023-2028) ($ million)
- Data Table on Oman - Market size and forecast (2023-2028) ($ million)
- Chart on Oman - Year-over-year growth (2023-2028) (%)
- Data Table on Oman - Year-over-year growth (2023-2028) (%)
 
- 11.22 Argentina - Market size and forecast (2023-2028)- Chart on Argentina - Market size and forecast (2023-2028) ($ million)
- Data Table on Argentina - Market size and forecast (2023-2028) ($ million)
- Chart on Argentina - Year-over-year growth (2023-2028) (%)
- Data Table on Argentina - Year-over-year growth (2023-2028) (%)
 
- 11.23 KSA - Market size and forecast (2023-2028)- Chart on KSA - Market size and forecast (2023-2028) ($ million)
- Data Table on KSA - Market size and forecast (2023-2028) ($ million)
- Chart on KSA - Year-over-year growth (2023-2028) (%)
- Data Table on KSA - Year-over-year growth (2023-2028) (%)
 
- 11.24 Rest of World (ROW) - Market size and forecast (2023-2028)- Chart on Rest of World (ROW) - Market size and forecast (2023-2028) ($ million)
- Data Table on Rest of World (ROW) - Market size and forecast (2023-2028) ($ million)
- Chart on Rest of World (ROW) - Year-over-year growth (2023-2028) (%)
- Data Table on Rest of World (ROW) - Year-over-year growth (2023-2028) (%)
 
12 Drivers, Challenges, and Opportunity/Restraints
- 12.3 Impact of drivers and challenges- Impact of drivers and challenges in 2023 and 2028
 
- 12.4 Market opportunities/restraints
13 Competitive Landscape
- 13.2 Competitive Landscape- Overview on criticality of inputs and factors of differentiation
 
- 13.3 Landscape disruption- Overview on factors of disruption
 
- 13.4 Industry risks- Impact of key risks on business
 
14 Competitive Analysis
- 14.2 Market positioning of companies- Matrix on companies position and classification
 
- 14.3 Akamai Technologies, Inc.- Akamai Technologies, Inc. - Overview
- Akamai Technologies, Inc. - Product / Service
- Akamai Technologies, Inc. - Key offerings
 
- 14.4 Applicure Technologies Ltd.- Applicure Technologies Ltd. - Overview
- Applicure Technologies Ltd. - Product / Service
- Applicure Technologies Ltd. - Key offerings
 
- 14.5 Barracuda Networks, Inc.- Barracuda Networks, Inc. - Overview
- Barracuda Networks, Inc. - Product / Service
- Barracuda Networks, Inc. - Key offerings
 
- 14.6 Citrix Systems, Inc.- Citrix Systems, Inc. - Overview
- Citrix Systems, Inc. - Product / Service
- Citrix Systems, Inc. - Key offerings
 
- 14.7 Cloudflare, Inc.- Cloudflare, Inc. - Overview
- Cloudflare, Inc. - Product / Service
- Cloudflare, Inc. - Key offerings
 
- 14.8 F5, Inc.- F5, Inc. - Overview
- F5, Inc. - Product / Service
- F5, Inc. - Key offerings
 
- 14.9 Fortinet, Inc.- Fortinet, Inc. - Overview
- Fortinet, Inc. - Product / Service
- Fortinet, Inc. - Key offerings
 
- 14.10 Imperva, Inc.- Imperva, Inc. - Overview
- Imperva, Inc. - Product / Service
- Imperva, Inc. - Key offerings
 
- 14.11 Microsoft Corporation- Microsoft Corporation - Overview
- Microsoft Corporation - Product / Service
- Microsoft Corporation - Key offerings
 
- 14.12 NSFOCUS Technologies Group Co. Ltd.- NSFOCUS Technologies Group Co. Ltd. - Overview
- NSFOCUS Technologies Group Co. Ltd. - Product / Service
- NSFOCUS Technologies Group Co. Ltd. - Key offerings
 
- 14.13 Palo Alto Networks, Inc.- Palo Alto Networks, Inc. - Overview
- Palo Alto Networks, Inc. - Product / Service
- Palo Alto Networks, Inc. - Key offerings
 
- 14.14 Qualys, Inc.- Qualys, Inc. - Overview
- Qualys, Inc. - Product / Service
- Qualys, Inc. - Key offerings
 
- 14.15 Radware Ltd.- Radware Ltd. - Overview
- Radware Ltd. - Product / Service
- Radware Ltd. - Key offerings
 
- 14.16 Sophos Ltd.- Sophos Ltd. - Overview
- Sophos Ltd. - Product / Service
- Sophos Ltd. - Key offerings
 
- 14.17 Sucuri Inc.- Sucuri Inc. - Overview
- Sucuri Inc. - Product / Service
- Sucuri Inc. - Key offerings
 
- 14.18 Trend Micro Incorporated- Trend Micro Incorporated - Overview
- Trend Micro Incorporated - Product / Service
- Trend Micro Incorporated - Key offerings
 
- 14.19 Trustwave Holdings, Inc.- Trustwave Holdings, Inc. - Overview
- Trustwave Holdings, Inc. - Product / Service
- Trustwave Holdings, Inc. - Key offerings
 
- 14.20 Varonis Systems, Inc.- Varonis Systems, Inc. - Overview
- Varonis Systems, Inc. - Product / Service
- Varonis Systems, Inc. - Key offerings
 
- 14.21 Verizon Communications Inc.- Verizon Communications Inc. - Overview
- Verizon Communications Inc. - Product / Service
- Verizon Communications Inc. - Key offerings
 
- 14.22 WAFWarden- WAFWarden - Overview
- WAFWarden - Product / Service
- WAFWarden - Key offerings
 
- 14.23 A10 Networks Inc.- A10 Networks Inc. - Overview
- A10 Networks Inc. - Product / Service
- A10 Networks Inc. - Key offerings
 
- 14.24 Akamai Technologies Inc.- Akamai Technologies Inc. - Overview
- Akamai Technologies Inc. - Product / Service
- Akamai Technologies Inc. - Key offerings
 
- 14.25 Barracuda Networks Inc.- Barracuda Networks Inc. - Overview
- Barracuda Networks Inc. - Product / Service
- Barracuda Networks Inc. - Key offerings
 
- 14.26 Citrix Systems Inc.- Citrix Systems Inc. - Overview
- Citrix Systems Inc. - Product / Service
- Citrix Systems Inc. - Key offerings
 
- 14.27 Cloudflare Inc.- Cloudflare Inc. - Overview
- Cloudflare Inc. - Product / Service
- Cloudflare Inc. - Key offerings
 
- 14.28 F5 Inc.- F5 Inc. - Overview
- F5 Inc. - Product / Service
- F5 Inc. - Key offerings
 
- 14.29 Fortinet Inc.- Fortinet Inc. - Overview
- Fortinet Inc. - Product / Service
- Fortinet Inc. - Key offerings
 
- 14.30 Imperva Inc.- Imperva Inc. - Overview
- Imperva Inc. - Product / Service
- Imperva Inc. - Key offerings
 
- 14.31 International Business Machines Corp.- International Business Machines Corp. - Overview
- International Business Machines Corp. - Product / Service
- International Business Machines Corp. - Key offerings
 
- 14.32 Juniper Networks Inc.- Juniper Networks Inc. - Overview
- Juniper Networks Inc. - Product / Service
- Juniper Networks Inc. - Key offerings
 
- 14.33 NSFOCUS Inc.- NSFOCUS Inc. - Overview
- NSFOCUS Inc. - Product / Service
- NSFOCUS Inc. - Key offerings
 
- 14.34 Penta Security Systems Inc.- Penta Security Systems Inc. - Overview
- Penta Security Systems Inc. - Product / Service
- Penta Security Systems Inc. - Key offerings
 
- 14.35 Positive Technologies- Positive Technologies - Overview
- Positive Technologies - Product / Service
- Positive Technologies - Key offerings
 
- 14.36 Qualys Inc.- Qualys Inc. - Overview
- Qualys Inc. - Product / Service
- Qualys Inc. - Key offerings
 
- 14.37 Radware Ltd.- Radware Ltd. - Overview
- Radware Ltd. - Product / Service
- Radware Ltd. - Key offerings
 
- 14.38 Sangfor Technologies Inc.- Sangfor Technologies Inc. - Overview
- Sangfor Technologies Inc. - Product / Service
- Sangfor Technologies Inc. - Key offerings
 
- 14.39 Singapore Telecommunications Ltd.- Singapore Telecommunications Ltd. - Overview
- Singapore Telecommunications Ltd. - Product / Service
- Singapore Telecommunications Ltd. - Key offerings
 
- 14.40 Sophos Ltd.- Sophos Ltd. - Overview
- Sophos Ltd. - Product / Service
- Sophos Ltd. - Key offerings
 
- 14.41 UBIKA- UBIKA - Overview
- UBIKA - Product / Service
- UBIKA - Key offerings
 
- 14.42 Venustech Group Inc.- Venustech Group Inc. - Overview
- Venustech Group Inc. - Product / Service
- Venustech Group Inc. - Key offerings
 
15 Appendix
- 15.2 Inclusions and exclusions checklist- Inclusions checklist
- Exclusions checklist
 
- 15.3 Currency conversion rates for US$- Currency conversion rates for US$
 
- 15.4 Research methodology
- 15.7 Validation techniques employed for market sizing- Validation techniques employed for market sizing
 
- 15.9 360 degree market analysis- 360 degree market analysis
 
- 15.10 List of abbreviations