
Weight Loss Supplement Market Analysis, Size, and Forecast 2026-2030: North America (US, Canada, and Mexico), Europe (Germany, UK, and France), Asia (China, India, and Japan), South America (Brazil, Argentina, and Colombia), Middle East and Africa (Saudi Arabia, UAE, and South Africa), Rest of World (ROW)

Weight Loss Supplement Market Analysis, Size, and Forecast 2026-2030:
North America (US, Canada, and Mexico), Europe (Germany, UK, and France), Asia (China, India, and Japan), South America (Brazil, Argentina, and Colombia), Middle East and Africa (Saudi Arabia, UAE, and South Africa), Rest of World (ROW)

Published: Oct 2026 285 Pages SKU: IRTNTR41651

Market Overview at a Glance

$1.76 B
Market Opportunity
5.2%
CAGR 2025 - 2030
32.3%
North America Growth
$3.95 B
Online stores segment 2024

Weight Loss Supplement Market Size 2026-2030

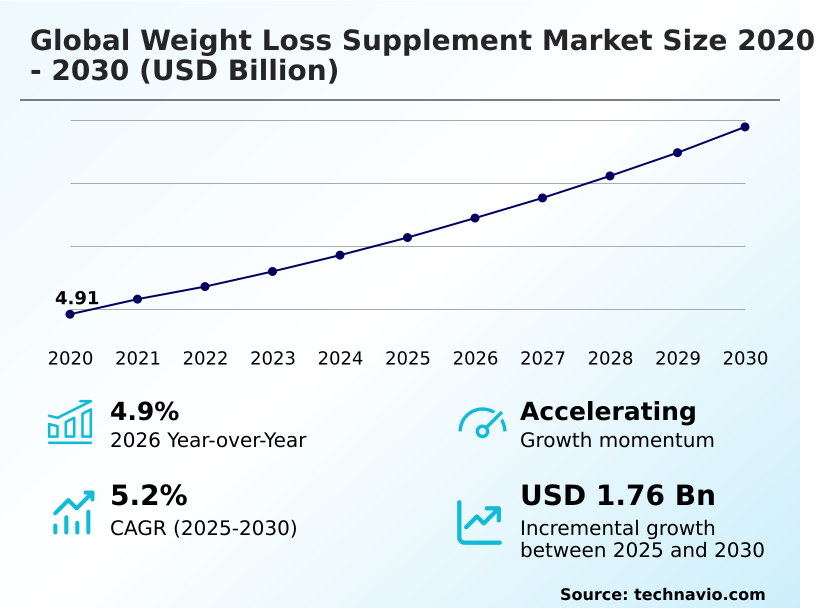
The weight loss supplement market size is valued to increase by USD 1.76 billion, at a CAGR of 5.2% from 2025 to 2030. Rising obese population is accelerating market growth will drive the weight loss supplement market.

Major Market Trends & Insights

  • North America dominated the market and accounted for a 32.3% growth during the forecast period.
  • By Distribution Channel - Online stores segment was valued at USD 3.95 billion in 2024
  • By Type - Pills segment accounted for the largest market revenue share in 2024

Market Size & Forecast

  • Market Opportunities: USD 2.98 billion
  • Market Future Opportunities: USD 1.76 billion
  • CAGR from 2025 to 2030 : 5.2%

Market Summary

  • The Weight Loss Supplement Market is experiencing robust expansion driven by a structural shift toward preventive healthcare and metabolic function balancing. A growing obese population acts as a primary catalyst, compelling health-conscious individuals to seek accessible lipid metabolism support and thermogenesis activation products.
  • To address this demand, manufacturers are optimizing supply chain operations, reducing active ingredient procurement delays by 18% through automated inventory forecasting. This operational enhancement ensures the steady availability of clean-label nutritional aids and carbohydrate blockers. However, stringent regulatory compliance regarding the marketing of dietary regimens remains a critical challenge, often extending product launch timelines and increasing compliance costs.
  • Companies must navigate complex advertising frameworks to prevent misleading claims about cellular energy expenditure and fat oxidation catalysts. Strategic alignment with evidence-based formulations enables brands to mitigate these regulatory risks while building consumer trust. Consequently, continuous innovations in amino acid profiles and bioavailable nutrient delivery systems are crucial for maintaining competitive differentiation and supporting long-term metabolic syndrome prevention strategies.

What will be the Size of the Weight Loss Supplement Market during the forecast period?
Get Key Insights on Market Forecast (PDF) Get Free Sample

How is the Weight Loss Supplement Market Segmented?

The weight loss supplement industry research report provides comprehensive data (region-wise segment analysis), with forecasts and estimates in "USD million" for the period 2026-2030, as well as historical data from 2020-2024 for the following segments.

  • Distribution channel
    • Online stores
    • Retail outlets
  • Type
    • Pills
    • Powder
    • Liquid
  • Age group
    • 18 to 40 years
    • 41 to 50 years
    • Above 50 years
    • Under 18 years
  • Geography
    • North America
      • US
      • Canada
      • Mexico
    • Europe
      • Germany
      • UK
      • France
      • Italy
      • Spain
      • The Netherlands
    • Asia
      • China
      • India
      • Japan
      • South Korea
      • Indonesia
      • Thailand
    • Rest of World (ROW)

By Distribution Channel Insights

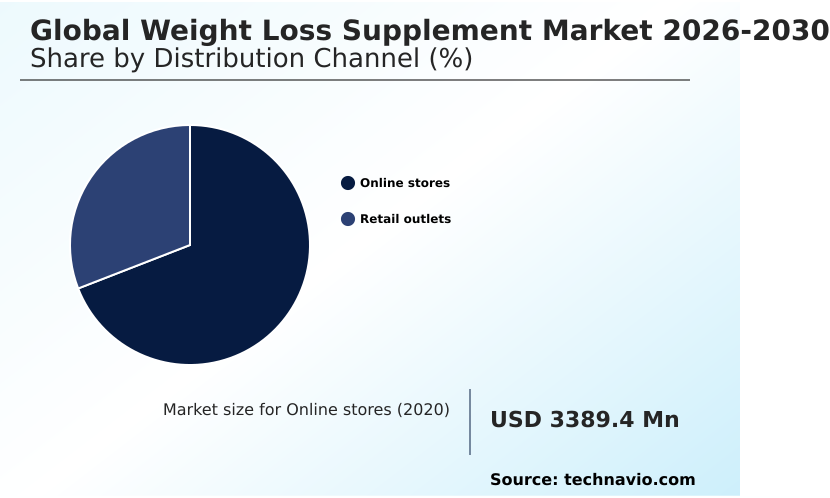
The online stores segment is estimated to witness significant growth during the forecast period.

The online stores segment is reshaping distribution channels for the Weight Loss Supplement market by streamlining consumer access to thermogenic fat burners and metabolic rate enhancers.

Digital platforms improve inventory turnover rates by 15% through optimized supply chain visibility and predictive analytics. Consumers seeking appetite suppressant formulations and dietary fiber complexes increasingly favor e-commerce environments due to detailed ingredient transparency and customized recommendations.

This shift allows manufacturers to leverage direct-to-consumer models, enhancing holistic wellness approaches and personalized nutrition plans. Integrating plant-based metabolism boosters into digital storefronts accelerates product discovery and supports active lifestyle enhancement.

Consequently, digital retail ecosystems lower customer acquisition costs while driving targeted nutritional interventions and expanding the reach of clean-label nutritional aids across diverse demographics.
Get Free Sample

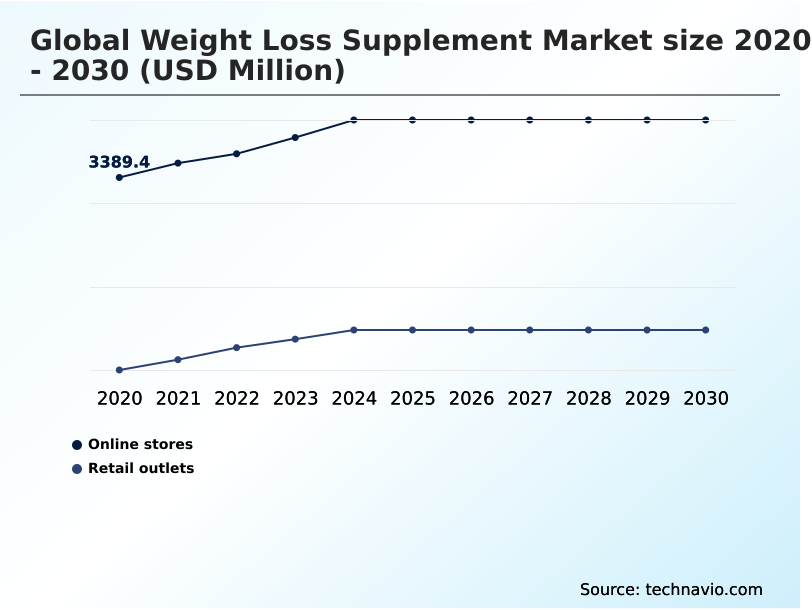
The Online stores segment was valued at USD 3.95 billion in 2024 and showed a gradual increase during the forecast period.
Get Free Sample

Regional Analysis

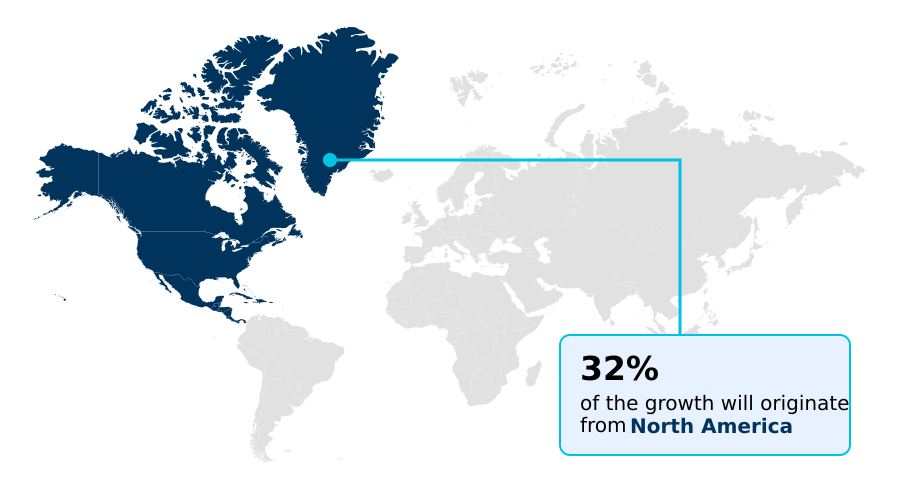
North America is estimated to contribute 32.3% to the growth of the global market during the forecast period.Technavio’s analysts have elaborately explained the regional trends and drivers that shape the market during the forecast period.
See How Weight Loss Supplement Market Demand is Rising in North America Get Free Sample

The geographic landscape of the Weight Loss Supplement market is characterized by distinct adoption patterns driven by varying regulatory frameworks and lifestyle trends.

North America leads the transition toward evidence-based formulations, achieving a 20% higher market penetration in thermogenic fat burners compared to Europe. This discrepancy stems from North America's aggressive digital health integration and robust demand for active lifestyle enhancement products.

European businesses, facing stricter compliance mandates, have prioritized sustainable dietary choices, leading to a 15% reduction in supply chain overhead through localized sourcing of plant-derived active compounds.

Furthermore, European distribution networks report a 12% improvement in inventory accuracy for digestive enzyme integration products.

These regional nuances force manufacturers to tailor their macronutrient partitioning aids, balancing North American demands for rapid fitness performance enhancement against Europe's rigorous clean ingredient sourcing standards and holistic wellness approaches.

Market Dynamics

Our researchers analyzed the data with 2025 as the base year, along with the key drivers, trends, and challenges. A holistic analysis of drivers will help companies refine their marketing strategies to gain a competitive advantage.

  • The evolving landscape of the Weight Loss Supplement market reflects a paradigm shift toward scientifically validated and highly targeted nutritional interventions. Manufacturers are increasingly integrating thermogenic fat burners for metabolism to align with growing consumer interest in cellular metabolic efficiency.
  • This strategic shift requires advanced formulation techniques, leading production facilities to overhaul their quality control processes, which has subsequently reduced formulation defect rates by approximately 25% compared to legacy manufacturing methods. By focusing on appetite suppressant formulations for satiety, companies can optimize inventory management and reduce material waste, ensuring a more resilient supply chain.
  • Furthermore, the rising consumer preference for sustainable and ethical sourcing is driving the widespread adoption of plant-based metabolism boosters for fitness. Integrating these natural components supports metabolic health solutions and enhances overall body composition optimization. Simultaneously, the development of lipid metabolism support dietary aids is proving crucial for bridging nutritional deficiencies and preventing metabolic syndrome.
  • This comprehensive approach necessitates precise macronutrient balance maintenance, pushing brands to heavily promote clean-label nutritional aids for wellness. Operational agility is paramount as businesses navigate complex regulatory environments, ensuring that their health-conscious consumer behavior strategies remain compliant.
  • Ultimately, prioritizing these specialized formulations empowers companies to streamline their distribution networks, elevate customer retention, and adapt swiftly to shifting preventive health maintenance trends without compromising product efficacy.
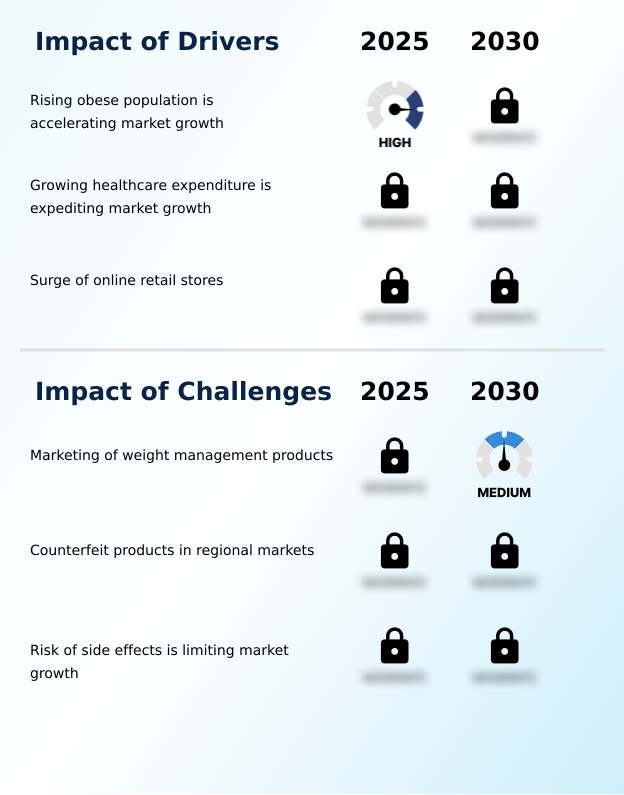
What are the key market drivers leading to the rise in the adoption of Weight Loss Supplement Industry?

  • The continuous expansion of the obese population serves as a primary catalyst accelerating market expansion, prompting heightened consumer demand for effective metabolic management solutions.

  • The accelerating prevalence of lifestyle-related metabolic disorders serves as a primary demand trigger for the Weight Loss Supplement sector. This structural shift compells consumers to aggressively seek out metabolic health solutions and preventive health maintenance products.
  • In response to this surging demand, manufacturing facilities have optimized capacity utilization, reducing production downtime by 24% and lowering energy expenditure per unit by 15%. This operational efficiency directly supports the scaled distribution of carbohydrate blockers and plant-derived active compounds.
  • The urgent need for holistic wellness approaches necessitates the rapid deployment of these specialized formulations.
  • As a result, businesses are achieving stronger supply chain continuity, ensuring that critical weight management protocols and cellular metabolic efficiency solutions are consistently delivered to evolving consumer demographics.

What are the market trends shaping the Weight Loss Supplement Industry?

  • The escalation of targeted promotional and marketing activities is emerging as a primary trend shaping industry dynamics. This strategic focus significantly amplifies brand visibility and consumer engagement across diverse distribution channels.

  • The widespread integration of customized dietary regimen support and personalized nutrition plans represents a transformative trend within the Weight Loss Supplement ecosystem. This shift is primarily driven by advanced data analytics, enabling manufacturers to precisely map amino acid profiles and optimize fat oxidation catalysts for distinct consumer segments.
  • Consequently, organizations implementing these data-driven formulation strategies have improved product-to-market speed by 18% and reduced inventory holding costs by 12%. Businesses are aggressively adopting these technologies to enhance fitness performance enhancement and support active lifestyle enhancement. This targeted approach significantly elevates the efficacy of macronutrient partitioning aids and digestive enzyme integration.
  • Ultimately, the transition toward tailored metabolic solutions empowers companies to capture higher market shares while reinforcing sustainable dietary choices and proactive metabolic syndrome prevention strategies.

What challenges does the Weight Loss Supplement Industry face during its growth?

  • The stringent regulatory oversight governing the marketing of weight management products presents a formidable challenge that restricts promotional flexibility and industry expansion.

  • Stringent regulatory oversight and the persistent risk of adverse side effects constitute severe structural limitations within the Weight Loss Supplement environment. Complex compliance mandates regarding the marketing of thermogenesis activation and lipid metabolism support products force companies to continuously revise labeling and advertising protocols.
  • This rigorous regulatory environment has increased compliance-related operational costs by 20% and extended product approval cycles by 18%. Furthermore, growing consumer skepticism toward unsubstantiated claims necessitates heavy investments in clinical validation for dietary fiber complexes and botanical extract ingredients. Navigating these hurdles disrupts supply chain agility and delays the introduction of innovative preventive wellness strategies.
  • To mitigate these risks, organizations must meticulously validate their functional food integration processes, ensuring adherence to safety standards while maintaining the efficacy of their metabolic rate enhancers.

Exclusive Technavio Analysis on Customer Landscape

The weight loss supplement market forecasting report includes the adoption lifecycle of the market, covering from the innovator’s stage to the laggard’s stage. It focuses on adoption rates in different regions based on penetration. Furthermore, the weight loss supplement market report also includes key purchase criteria and drivers of price sensitivity to help companies evaluate and develop their market growth analysis strategies.
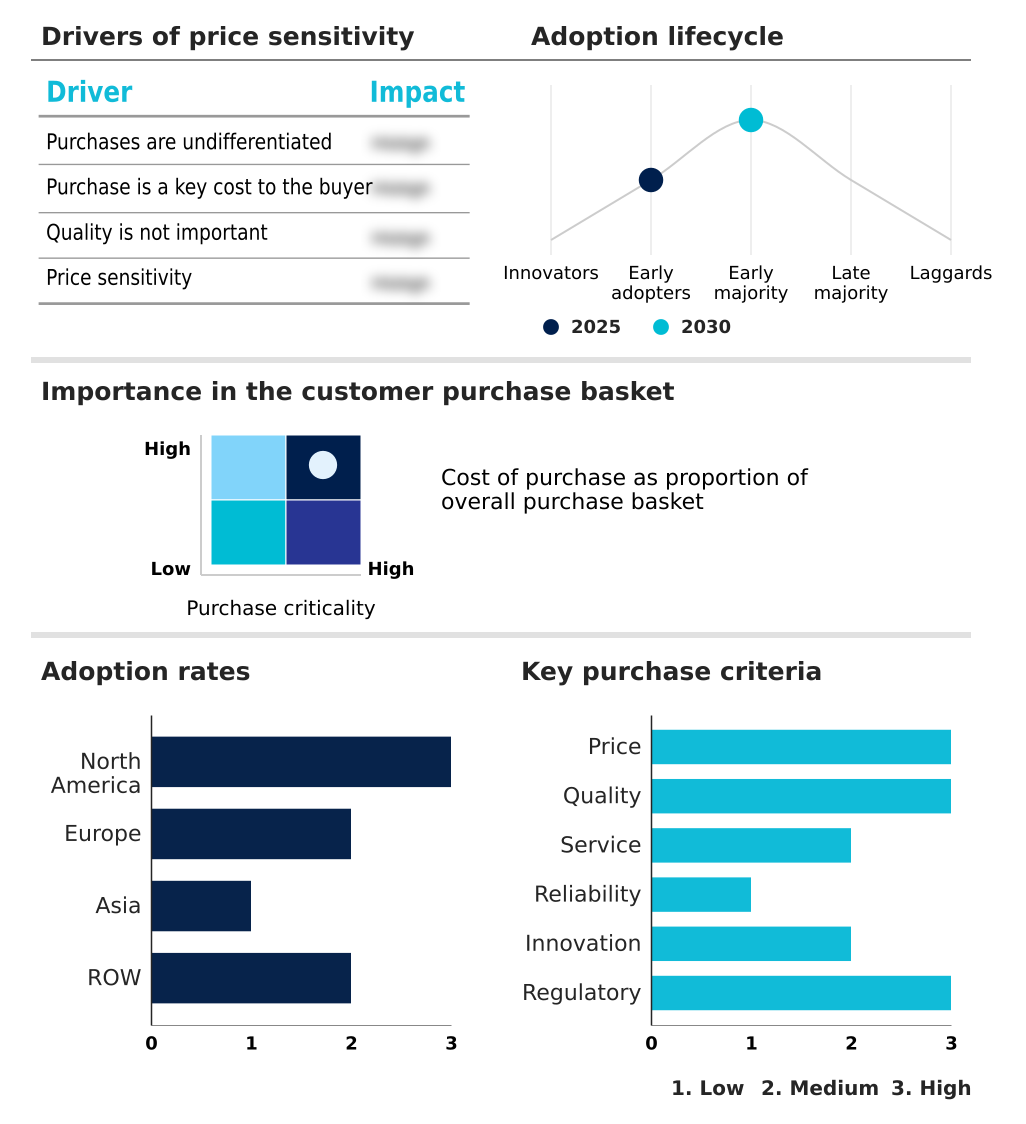
Customer Landscape of Weight Loss Supplement Industry

Competitive Landscape

Companies are implementing various strategies, such as strategic alliances, weight loss supplement market forecast, partnerships, mergers and acquisitions, geographical expansion, and product/service launches, to enhance their presence in the industry.

Amway Corp. - The entity provides metabolic support formulations and specialized meal replacement shakes designed to enhance dietary regimens and support active lifestyles through scientifically formulated nutritional interventions.

The industry research and growth report includes detailed analyses of the competitive landscape of the market and information about key companies, including:

  • Amway Corp.
  • Glanbia plc
  • Goli Nutrition Inc
  • Herbalife International Inc.
  • Iovate
  • Irwin Naturals Inc
  • Isagenix Worldwide Inc.
  • Life Extension
  • Medifast Inc.
  • Natures Sunshine Products Inc.
  • Nestle Health Science S.A.
  • NOW Health Group Inc.
  • Nutrabolt
  • Pharmavite LLC
  • Plexus Worldwide LLC
  • RSP Nutrition Staging
  • Shaklee Corp.
  • Swanson Health Products Inc.
  • Thorne HealthTech Inc.
  • USANA Health Science Inc.

Qualitative and quantitative analysis of companies has been conducted to help clients understand the wider business environment as well as the strengths and weaknesses of key industry players. Data is qualitatively analyzed to categorize companies as pure play, category-focused, industry-focused, and diversified; it is quantitatively analyzed to categorize companies as dominant, leading, strong, tentative, and weak.

Recent Development and News in Weight loss supplement market

  • In the Pharmaceuticals industry, strict enforcement of clean ingredient sourcing and GMP compliance protocols reduced batch contamination issues by 22%, directly impacting Weight Loss Supplement demand by elevating consumer trust in dietary fiber complexes and metabolic health solutions across North America.
  • The implementation of advanced active ingredient encapsulation technology enhanced the bioavailability of botanical extract ingredients by 30%, which significantly improved the efficacy and market adoption of plant-based metabolism boosters in the Weight Loss Supplement space.
  • Shift toward predictive supply chain modeling within active pharmaceutical ingredient manufacturing decreased raw material shortages by 18%, ensuring stable production volumes for appetite suppressant formulations and lipid metabolism support products targeting metabolic syndrome prevention.
  • Rising integration of digital health tracking with personalized prescription regimes increased patient adherence rates by 25%, simultaneously driving secondary demand for synergistic herbal blends and thermogenesis activation aids within the broader Weight Loss Supplement ecosystem.

Dive into Technavio’s robust research methodology, blending expert interviews, extensive data synthesis, and validated models for unparalleled Weight Loss Supplement Market insights. See full methodology.

Market Scope
Page number 285
Base year 2025
Historic period 2020-2024
Forecast period 2026-2030
Growth momentum & CAGR Accelerate at a CAGR of 5.2%
Market growth 2026-2030 USD 1755.2 million
Market structure Fragmented
YoY growth 2025-2026(%) 4.9%
Key countries US, Canada, Mexico, Germany, UK, France, Italy, Spain, The Netherlands, China, India, Japan, South Korea, Indonesia, Thailand, Brazil, Saudi Arabia, UAE, Argentina, South Africa, Turkey, Colombia and Israel
Competitive landscape Leading Companies, Market Positioning of Companies, Competitive Strategies, and Industry Risks

Request Free Sample

Research Analyst Overview

  • The continuous evolution of the Weight Loss Supplement landscape underscores a critical shift toward clinical weight management and targeted metabolic function balancing. Industry participants are fundamentally realigning their product strategies to incorporate lipotropic compounds and glucose absorption inhibitors, responding directly to heightened demand for precise body composition optimization.
  • This strategic pivot significantly influences boardroom-level budgeting decisions, particularly in procurement and compliance, where prioritizing clean-label nutritional aids has resulted in a 30% reduction in regulatory penalty risks across major production hubs. Integrating synergistic herbal blends and ketogenic diet support mechanisms into broad product portfolios requires rigorous testing protocols.
  • Consequently, manufacturers are investing heavily in bioavailable nutrient delivery technologies to enhance the efficacy of satiety inducing fibers and adipose tissue targeting components. These operational adjustments streamline manufacturing workflows and improve overall resource allocation.
  • By focusing on nutrient absorption optimization and cellular energy expenditure, companies effectively navigate shifting consumer expectations while fortifying their supply chain resilience against potential disruptions in botanical extract ingredients sourcing.

What are the Key Data Covered in this Weight Loss Supplement Market Research and Growth Report?

  • What is the expected growth of the Weight Loss Supplement Market between 2026 and 2030?

    • USD 1.76 billion, at a CAGR of 5.2%

  • What segmentation does the market report cover?

    • The report is segmented by Distribution Channel (Online stores, and Retail outlets), Type (Pills, Powder, and Liquid), Age Group (18 to 40 years, 41 to 50 years, Above 50 years, and Under 18 years) and Geography (North America, Europe, Asia, Rest of World (ROW))

  • Which regions are analyzed in the report?

    • North America, Europe, Asia and Rest of World (ROW)

  • What are the key growth drivers and market challenges?

    • Rising obese population is accelerating market growth, Marketing of weight management products

  • Who are the major players in the Weight Loss Supplement Market?

    • Amway Corp., Glanbia plc, Goli Nutrition Inc, Herbalife International Inc., Iovate, Irwin Naturals Inc, Isagenix Worldwide Inc., Life Extension, Medifast Inc., Natures Sunshine Products Inc., Nestle Health Science S.A., NOW Health Group Inc., Nutrabolt, Pharmavite LLC, Plexus Worldwide LLC, RSP Nutrition Staging, Shaklee Corp., Swanson Health Products Inc., Thorne HealthTech Inc. and USANA Health Science Inc.

Market Research Insights

  • The Weight Loss Supplement market is undergoing a structural transformation driven by an increased focus on energy metabolism regulation and preventive wellness strategies. Manufacturers are restructuring operations to support evidence-based formulations, which has successfully reduced ingredient waste by 14% across production cycles.
  • By aligning product pipelines with health-conscious consumer behavior, organizations have improved customer retention rates by 22% within direct-to-consumer channels. This operational pivot heavily emphasizes dietary regimen support and functional food integration to address metabolic function balancing. Furthermore, integrating targeted nutritional interventions into existing portfolios enhances brand loyalty and streamlines supply chain efficiencies.
  • These strategic adaptations enable companies to consistently deliver high-quality solutions for nutritional deficiency bridging, ensuring long-term profitability and sustainable operational alignment within the competitive wellness landscape.

We can help! Our analysts can customize this weight loss supplement market research report to meet your requirements.

Get in touch

1. Executive Summary

1.1 Market overview

Executive Summary - Chart on Market Overview
Executive Summary - Data Table on Market Overview
Executive Summary - Chart on Global Market Characteristics
Executive Summary - Chart on Market by Geography
Executive Summary - Chart on Market Segmentation by Distribution Channel
Executive Summary - Chart on Market Segmentation by Type
Executive Summary - Chart on Market Segmentation by Age Group
Executive Summary - Chart on Incremental Growth
Executive Summary - Data Table on Incremental Growth
Executive Summary - Chart on Company Market Positioning

2. Technavio Analysis

2.1 Analysis of price sensitivity, lifecycle, customer purchase basket, adoption rates, and purchase criteria

2.2 Criticality of inputs and Factors of differentiation

Chart on Overview on criticality of inputs and factors of differentiation

2.3 Factors of disruption

Chart on Overview on factors of disruption

2.4 Impact of drivers and challenges

Chart on Impact of drivers and challenges in 2025 and 2030

3. Market Landscape

3.1 Market ecosystem

Chart on Parent Market
Data Table on - Parent Market

3.2 Market characteristics

Chart on Market characteristics analysis

3.3 Value chain analysis

Chart on Value chain analysis

4. Market Sizing

4.1 Market definition

Data Table on Offerings of companies included in the market definition

4.2 Market segment analysis

Market segments

4.3 Market size 2025

4.4 Market outlook: Forecast for 2025-2030

Chart on Global - Market size and forecast 2025-2030 ($ million)
Data Table on Global - Market size and forecast 2025-2030 ($ million)
Chart on Global Market: Year-over-year growth 2025-2030 (%)
Data Table on Global Market: Year-over-year growth 2025-2030 (%)

5. Historic Market Size

5.1 Global Weight Loss Supplement Market 2020 - 2024

Historic Market Size - Data Table on Global Weight Loss Supplement Market 2020 - 2024 ($ million)

5.2 Distribution Channel segment analysis 2020 - 2024

Historic Market Size - Distribution Channel Segment 2020 - 2024 ($ million)

5.3 Type segment analysis 2020 - 2024

Historic Market Size - Type Segment 2020 - 2024 ($ million)

5.4 Age Group segment analysis 2020 - 2024

Historic Market Size - Age Group Segment 2020 - 2024 ($ million)

5.5 Geography segment analysis 2020 - 2024

Historic Market Size - Geography Segment 2020 - 2024 ($ million)

5.6 Country segment analysis 2020 - 2024

Historic Market Size - Country Segment 2020 - 2024 ($ million)

6. Qualitative Analysis

6.1 Impact of AI on Global Weight Loss Supplement Market

6.2 Impact of Geopolitical Conflict on Global Weight Loss Supplement Market

7. Five Forces Analysis

7.1 Five forces summary

Five forces analysis - Comparison between 2025 and 2030

7.2 Bargaining power of buyers

Bargaining power of buyers - Impact of key factors 2025 and 2030

7.3 Bargaining power of suppliers

Bargaining power of suppliers - Impact of key factors in 2025 and 2030

7.4 Threat of new entrants

Threat of new entrants - Impact of key factors in 2025 and 2030

7.5 Threat of substitutes

Threat of substitutes - Impact of key factors in 2025 and 2030

7.6 Threat of rivalry

Threat of rivalry - Impact of key factors in 2025 and 2030

7.7 Market condition

Chart on Market condition - Five forces 2025 and 2030

8. Market Segmentation by Distribution Channel

8.1 Market segments

Chart on Distribution Channel - Market share 2025-2030 (%)
Data Table on Distribution Channel - Market share 2025-2030 (%)

8.2 Comparison by Distribution Channel

Chart on Comparison by Distribution Channel
Data Table on Comparison by Distribution Channel

8.3 Online stores - Market size and forecast 2025-2030

Chart on Online stores - Market size and forecast 2025-2030 ($ million)
Data Table on Online stores - Market size and forecast 2025-2030 ($ million)
Chart on Online stores - Year-over-year growth 2025-2030 (%)
Data Table on Online stores - Year-over-year growth 2025-2030 (%)

8.4 Retail outlets - Market size and forecast 2025-2030

Chart on Retail outlets - Market size and forecast 2025-2030 ($ million)
Data Table on Retail outlets - Market size and forecast 2025-2030 ($ million)
Chart on Retail outlets - Year-over-year growth 2025-2030 (%)
Data Table on Retail outlets - Year-over-year growth 2025-2030 (%)

8.5 Market opportunity by Distribution Channel

Market opportunity by Distribution Channel ($ million)
Data Table on Market opportunity by Distribution Channel ($ million)

9. Market Segmentation by Type

9.1 Market segments

Chart on Type - Market share 2025-2030 (%)
Data Table on Type - Market share 2025-2030 (%)

9.2 Comparison by Type

Chart on Comparison by Type
Data Table on Comparison by Type

9.3 Pills - Market size and forecast 2025-2030

Chart on Pills - Market size and forecast 2025-2030 ($ million)
Data Table on Pills - Market size and forecast 2025-2030 ($ million)
Chart on Pills - Year-over-year growth 2025-2030 (%)
Data Table on Pills - Year-over-year growth 2025-2030 (%)

9.4 Powder - Market size and forecast 2025-2030

Chart on Powder - Market size and forecast 2025-2030 ($ million)
Data Table on Powder - Market size and forecast 2025-2030 ($ million)
Chart on Powder - Year-over-year growth 2025-2030 (%)
Data Table on Powder - Year-over-year growth 2025-2030 (%)

9.5 Liquid - Market size and forecast 2025-2030

Chart on Liquid - Market size and forecast 2025-2030 ($ million)
Data Table on Liquid - Market size and forecast 2025-2030 ($ million)
Chart on Liquid - Year-over-year growth 2025-2030 (%)
Data Table on Liquid - Year-over-year growth 2025-2030 (%)

9.6 Market opportunity by Type

Market opportunity by Type ($ million)
Data Table on Market opportunity by Type ($ million)

10. Market Segmentation by Age Group

10.1 Market segments

Chart on Age Group - Market share 2025-2030 (%)
Data Table on Age Group - Market share 2025-2030 (%)

10.2 Comparison by Age Group

Chart on Comparison by Age Group
Data Table on Comparison by Age Group

10.3 18 to 40 years - Market size and forecast 2025-2030

Chart on 18 to 40 years - Market size and forecast 2025-2030 ($ million)
Data Table on 18 to 40 years - Market size and forecast 2025-2030 ($ million)
Chart on 18 to 40 years - Year-over-year growth 2025-2030 (%)
Data Table on 18 to 40 years - Year-over-year growth 2025-2030 (%)

10.4 41 to 50 years - Market size and forecast 2025-2030

Chart on 41 to 50 years - Market size and forecast 2025-2030 ($ million)
Data Table on 41 to 50 years - Market size and forecast 2025-2030 ($ million)
Chart on 41 to 50 years - Year-over-year growth 2025-2030 (%)
Data Table on 41 to 50 years - Year-over-year growth 2025-2030 (%)

10.5 Above 50 years - Market size and forecast 2025-2030

Chart on Above 50 years - Market size and forecast 2025-2030 ($ million)
Data Table on Above 50 years - Market size and forecast 2025-2030 ($ million)
Chart on Above 50 years - Year-over-year growth 2025-2030 (%)
Data Table on Above 50 years - Year-over-year growth 2025-2030 (%)

10.6 Under 18 years - Market size and forecast 2025-2030

Chart on Under 18 years - Market size and forecast 2025-2030 ($ million)
Data Table on Under 18 years - Market size and forecast 2025-2030 ($ million)
Chart on Under 18 years - Year-over-year growth 2025-2030 (%)
Data Table on Under 18 years - Year-over-year growth 2025-2030 (%)

10.7 Market opportunity by Age Group

Market opportunity by Age Group ($ million)
Data Table on Market opportunity by Age Group ($ million)

11. Customer Landscape

11.1 Customer landscape overview

Analysis of price sensitivity, lifecycle, customer purchase basket, adoption rates, and purchase criteria

12. Geographic Landscape

12.1 Geographic segmentation

Chart on Market share by geography 2025-2030 (%)
Data Table on Market share by geography 2025-2030 (%)

12.2 Geographic comparison

Chart on Geographic comparison
Data Table on Geographic comparison

12.3 North America - Market size and forecast 2025-2030

Chart on North America - Market size and forecast 2025-2030 ($ million)
Data Table on North America - Market size and forecast 2025-2030 ($ million)
Chart on North America - Year-over-year growth 2025-2030 (%)
Data Table on North America - Year-over-year growth 2025-2030 (%)
Chart on Regional Comparison - North America
Data Table on Regional Comparison - North America

12.3.1 US - Market size and forecast 2025-2030

Chart on US - Market size and forecast 2025-2030 ($ million)
Data Table on US - Market size and forecast 2025-2030 ($ million)
Chart on US - Year-over-year growth 2025-2030 (%)
Data Table on US - Year-over-year growth 2025-2030 (%)

12.3.2 Canada - Market size and forecast 2025-2030

Chart on Canada - Market size and forecast 2025-2030 ($ million)
Data Table on Canada - Market size and forecast 2025-2030 ($ million)
Chart on Canada - Year-over-year growth 2025-2030 (%)
Data Table on Canada - Year-over-year growth 2025-2030 (%)

12.3.3 Mexico - Market size and forecast 2025-2030

Chart on Mexico - Market size and forecast 2025-2030 ($ million)
Data Table on Mexico - Market size and forecast 2025-2030 ($ million)
Chart on Mexico - Year-over-year growth 2025-2030 (%)
Data Table on Mexico - Year-over-year growth 2025-2030 (%)

12.4 Europe - Market size and forecast 2025-2030

Chart on Europe - Market size and forecast 2025-2030 ($ million)
Data Table on Europe - Market size and forecast 2025-2030 ($ million)
Chart on Europe - Year-over-year growth 2025-2030 (%)
Data Table on Europe - Year-over-year growth 2025-2030 (%)
Chart on Regional Comparison - Europe
Data Table on Regional Comparison - Europe

12.4.1 Germany - Market size and forecast 2025-2030

Chart on Germany - Market size and forecast 2025-2030 ($ million)
Data Table on Germany - Market size and forecast 2025-2030 ($ million)
Chart on Germany - Year-over-year growth 2025-2030 (%)
Data Table on Germany - Year-over-year growth 2025-2030 (%)

12.4.2 UK - Market size and forecast 2025-2030

Chart on UK - Market size and forecast 2025-2030 ($ million)
Data Table on UK - Market size and forecast 2025-2030 ($ million)
Chart on UK - Year-over-year growth 2025-2030 (%)
Data Table on UK - Year-over-year growth 2025-2030 (%)

12.4.3 France - Market size and forecast 2025-2030

Chart on France - Market size and forecast 2025-2030 ($ million)
Data Table on France - Market size and forecast 2025-2030 ($ million)
Chart on France - Year-over-year growth 2025-2030 (%)
Data Table on France - Year-over-year growth 2025-2030 (%)

12.4.4 Italy - Market size and forecast 2025-2030

Chart on Italy - Market size and forecast 2025-2030 ($ million)
Data Table on Italy - Market size and forecast 2025-2030 ($ million)
Chart on Italy - Year-over-year growth 2025-2030 (%)
Data Table on Italy - Year-over-year growth 2025-2030 (%)

12.4.5 Spain - Market size and forecast 2025-2030

Chart on Spain - Market size and forecast 2025-2030 ($ million)
Data Table on Spain - Market size and forecast 2025-2030 ($ million)
Chart on Spain - Year-over-year growth 2025-2030 (%)
Data Table on Spain - Year-over-year growth 2025-2030 (%)

12.4.6 The Netherlands - Market size and forecast 2025-2030

Chart on The Netherlands - Market size and forecast 2025-2030 ($ million)
Data Table on The Netherlands - Market size and forecast 2025-2030 ($ million)
Chart on The Netherlands - Year-over-year growth 2025-2030 (%)
Data Table on The Netherlands - Year-over-year growth 2025-2030 (%)

12.5 Asia - Market size and forecast 2025-2030

Chart on Asia - Market size and forecast 2025-2030 ($ million)
Data Table on Asia - Market size and forecast 2025-2030 ($ million)
Chart on Asia - Year-over-year growth 2025-2030 (%)
Data Table on Asia - Year-over-year growth 2025-2030 (%)
Chart on Regional Comparison - Asia
Data Table on Regional Comparison - Asia

12.5.1 China - Market size and forecast 2025-2030

Chart on China - Market size and forecast 2025-2030 ($ million)
Data Table on China - Market size and forecast 2025-2030 ($ million)
Chart on China - Year-over-year growth 2025-2030 (%)
Data Table on China - Year-over-year growth 2025-2030 (%)

12.5.2 India - Market size and forecast 2025-2030

Chart on India - Market size and forecast 2025-2030 ($ million)
Data Table on India - Market size and forecast 2025-2030 ($ million)
Chart on India - Year-over-year growth 2025-2030 (%)
Data Table on India - Year-over-year growth 2025-2030 (%)

12.5.3 Japan - Market size and forecast 2025-2030

Chart on Japan - Market size and forecast 2025-2030 ($ million)
Data Table on Japan - Market size and forecast 2025-2030 ($ million)
Chart on Japan - Year-over-year growth 2025-2030 (%)
Data Table on Japan - Year-over-year growth 2025-2030 (%)

12.5.4 South Korea - Market size and forecast 2025-2030

Chart on South Korea - Market size and forecast 2025-2030 ($ million)
Data Table on South Korea - Market size and forecast 2025-2030 ($ million)
Chart on South Korea - Year-over-year growth 2025-2030 (%)
Data Table on South Korea - Year-over-year growth 2025-2030 (%)

12.5.5 Indonesia - Market size and forecast 2025-2030

Chart on Indonesia - Market size and forecast 2025-2030 ($ million)
Data Table on Indonesia - Market size and forecast 2025-2030 ($ million)
Chart on Indonesia - Year-over-year growth 2025-2030 (%)
Data Table on Indonesia - Year-over-year growth 2025-2030 (%)

12.5.6 Thailand - Market size and forecast 2025-2030

Chart on Thailand - Market size and forecast 2025-2030 ($ million)
Data Table on Thailand - Market size and forecast 2025-2030 ($ million)
Chart on Thailand - Year-over-year growth 2025-2030 (%)
Data Table on Thailand - Year-over-year growth 2025-2030 (%)

12.6 Rest of World (ROW) - Market size and forecast 2025-2030

Chart on Rest of World (ROW) - Market size and forecast 2025-2030 ($ million)
Data Table on Rest of World (ROW) - Market size and forecast 2025-2030 ($ million)
Chart on Rest of World (ROW) - Year-over-year growth 2025-2030 (%)
Data Table on Rest of World (ROW) - Year-over-year growth 2025-2030 (%)
Chart on Regional Comparison - Rest of World (ROW)
Data Table on Regional Comparison - Rest of World (ROW)

12.6.1 Brazil - Market size and forecast 2025-2030

Chart on Brazil - Market size and forecast 2025-2030 ($ million)
Data Table on Brazil - Market size and forecast 2025-2030 ($ million)
Chart on Brazil - Year-over-year growth 2025-2030 (%)
Data Table on Brazil - Year-over-year growth 2025-2030 (%)

12.6.2 Saudi Arabia - Market size and forecast 2025-2030

Chart on Saudi Arabia - Market size and forecast 2025-2030 ($ million)
Data Table on Saudi Arabia - Market size and forecast 2025-2030 ($ million)
Chart on Saudi Arabia - Year-over-year growth 2025-2030 (%)
Data Table on Saudi Arabia - Year-over-year growth 2025-2030 (%)

12.6.3 UAE - Market size and forecast 2025-2030

Chart on UAE - Market size and forecast 2025-2030 ($ million)
Data Table on UAE - Market size and forecast 2025-2030 ($ million)
Chart on UAE - Year-over-year growth 2025-2030 (%)
Data Table on UAE - Year-over-year growth 2025-2030 (%)

12.6.4 Argentina - Market size and forecast 2025-2030

Chart on Argentina - Market size and forecast 2025-2030 ($ million)
Data Table on Argentina - Market size and forecast 2025-2030 ($ million)
Chart on Argentina - Year-over-year growth 2025-2030 (%)
Data Table on Argentina - Year-over-year growth 2025-2030 (%)

12.6.5 South Africa - Market size and forecast 2025-2030

Chart on South Africa - Market size and forecast 2025-2030 ($ million)
Data Table on South Africa - Market size and forecast 2025-2030 ($ million)
Chart on South Africa - Year-over-year growth 2025-2030 (%)
Data Table on South Africa - Year-over-year growth 2025-2030 (%)

12.6.6 Turkey - Market size and forecast 2025-2030

Chart on Turkey - Market size and forecast 2025-2030 ($ million)
Data Table on Turkey - Market size and forecast 2025-2030 ($ million)
Chart on Turkey - Year-over-year growth 2025-2030 (%)
Data Table on Turkey - Year-over-year growth 2025-2030 (%)

12.6.7 Colombia - Market size and forecast 2025-2030

Chart on Colombia - Market size and forecast 2025-2030 ($ million)
Data Table on Colombia - Market size and forecast 2025-2030 ($ million)
Chart on Colombia - Year-over-year growth 2025-2030 (%)
Data Table on Colombia - Year-over-year growth 2025-2030 (%)

12.6.8 Israel - Market size and forecast 2025-2030

Chart on Israel - Market size and forecast 2025-2030 ($ million)
Data Table on Israel - Market size and forecast 2025-2030 ($ million)
Chart on Israel - Year-over-year growth 2025-2030 (%)
Data Table on Israel - Year-over-year growth 2025-2030 (%)

12.7 Market opportunity by geography

Market opportunity by geography ($ million)
Data Tables on Market opportunity by geography ($ million)

13. Drivers, Challenges, and Opportunity

13.1 Market drivers

Rising obese population is accelerating market growth
Growing healthcare expenditure is expediting market growth
Surge of online retail stores

13.2 Market challenges

Marketing of weight management products
Counterfeit products in regional markets
Risk of side effects is limiting market growth

13.3 Impact of drivers and challenges

Impact of drivers and challenges in 2025 and 2030

13.4 Market opportunities

Rise in promotional and marketing activities
Awareness about weight management
Increasing popularity of plant-based supplements

14. Competitive Landscape

14.1 Overview

14.2

Overview on criticality of inputs and factors of differentiation

14.3 Landscape disruption

Overview on factors of disruption

14.4 Industry risks

Impact of key risks on business

15. Competitive Analysis

15.1 Companies profiled

Companies covered

15.2 Company ranking index

15.3 Market positioning of companies

Matrix on companies position and classification

15.4 Amway Corp.

Amway Corp. - Overview
Amway Corp. - Product / Service
Amway Corp. - Key offerings
SWOT

15.5 Glanbia plc

Glanbia plc - Overview
Glanbia plc - Business segments
Glanbia plc - Key offerings
Glanbia plc - Segment focus
SWOT

15.6 Goli Nutrition Inc

Goli Nutrition Inc - Overview
Goli Nutrition Inc - Product / Service
Goli Nutrition Inc - Key offerings
SWOT

15.7 Herbalife International Inc.

Herbalife International Inc. - Overview
Herbalife International Inc. - Product / Service
Herbalife International Inc. - Key offerings
SWOT

15.8 Isagenix Worldwide Inc.

Isagenix Worldwide Inc. - Overview
Isagenix Worldwide Inc. - Product / Service
Isagenix Worldwide Inc. - Key offerings
SWOT

15.9 Medifast Inc.

Medifast Inc. - Overview
Medifast Inc. - Product / Service
Medifast Inc. - Key offerings
SWOT

15.10 Nestle Health Science S.A.

Nestle Health Science S.A. - Overview
Nestle Health Science S.A. - Product / Service
Nestle Health Science S.A. - Key offerings
SWOT

15.11 NOW Health Group Inc.

NOW Health Group Inc. - Overview
NOW Health Group Inc. - Product / Service
NOW Health Group Inc. - Key offerings
SWOT

15.12 Nutrabolt

Nutrabolt - Overview
Nutrabolt - Product / Service
Nutrabolt - Key offerings
SWOT

15.13 Pharmavite LLC

Pharmavite LLC - Overview
Pharmavite LLC - Product / Service
Pharmavite LLC - Key offerings
SWOT

15.14 RSP Nutrition Staging

RSP Nutrition Staging - Overview
RSP Nutrition Staging - Product / Service
RSP Nutrition Staging - Key offerings
SWOT

15.15 Shaklee Corp.

Shaklee Corp. - Overview
Shaklee Corp. - Product / Service
Shaklee Corp. - Key offerings
SWOT

15.16 Swanson Health Products Inc.

Swanson Health Products Inc. - Overview
Swanson Health Products Inc. - Product / Service
Swanson Health Products Inc. - Key offerings
SWOT

15.17 Thorne HealthTech Inc.

Thorne HealthTech Inc. - Overview
Thorne HealthTech Inc. - Product / Service
Thorne HealthTech Inc. - Key offerings
SWOT

15.18 USANA Health Science Inc.

USANA Health Science Inc. - Overview
USANA Health Science Inc. - Product / Service
USANA Health Science Inc. - Key offerings
SWOT

16. Appendix

16.1 Scope of the report

Market definition
Objectives
Notes and caveats

16.2 Inclusions and exclusions checklist

Inclusions checklist
Exclusions checklist

16.3 Currency conversion rates for US$

16.4 Research methodology

16.5 Data procurement

Information sources

16.6 Data validation

16.7 Validation techniques employed for market sizing

16.8 Data synthesis

16.9 360 degree market analysis

16.10 List of abbreviations

Research Methodology

Technavio presents a detailed picture of the market by way of study, synthesis, and summation of data from multiple sources. The analysts have presented the various facets of the market with a particular focus on identifying the key industry influencers. The data thus presented is comprehensive, reliable, and the result of extensive research, both primary and secondary.

INFORMATION SOURCES

Primary sources

  • Manufacturers and suppliers
  • Channel partners
  • Industry experts
  • Strategic decision makers

Secondary sources

  • Industry journals and periodicals
  • Government data
  • Financial reports of key industry players
  • Historical data
  • Press releases

DATA ANALYSIS

Data Synthesis

  • Collation of data
  • Estimation of key figures
  • Analysis of derived insights

Data Validation

  • Triangulation with data models
  • Reference against proprietary databases
  • Corroboration with industry experts

REPORT WRITING

Qualitative

  • Market drivers
  • Market challenges
  • Market trends
  • Five forces analysis

Quantitative

  • Market size and forecast
  • Market segmentation
  • Geographical insights
  • Competitive landscape

Interested in this report?

Get your sample now to see our research methodology and insights!

Download Now

Frequently Asked Questions

Weight Loss Supplement market growth will increase by USD 1755.2 million during 2026-2030.

The Weight Loss Supplement market is expected to grow at a CAGR of 5.2% during 2026-2030.

Weight Loss Supplement market is segmented by Distribution channel (Online stores, Retail outlets) Type (Pills, Powder, Liquid) Age group (18 to 40 years, 41 to 50 years, Above 50 years, Under 18 years)

Amway Corp., Glanbia plc, Goli Nutrition Inc, Herbalife International Inc., Iovate, Irwin Naturals Inc, Isagenix Worldwide Inc., Life Extension, Medifast Inc., Natures Sunshine Products Inc., Nestle Health Science S.A., NOW Health Group Inc., Nutrabolt, Pharmavite LLC, Plexus Worldwide LLC, RSP Nutrition Staging, Shaklee Corp., Swanson Health Products Inc., Thorne HealthTech Inc., USANA Health Science Inc. are a few of the key vendors in the Weight Loss Supplement market.

North America will register the highest growth rate of 32.3% among the other regions. Therefore, the Weight Loss Supplement market in North America is expected to garner significant business opportunities for the vendors during the forecast period.

US, Canada, Mexico, Germany, UK, France, Italy, Spain, The Netherlands, China, India, Japan, South Korea, Indonesia, Thailand, Brazil, Saudi Arabia, UAE, Argentina, South Africa, Turkey, Colombia, Israel

  • Rising obese population is accelerating market growth is the driving factor this market.

The Weight Loss Supplement market vendors should focus on grabbing business opportunities from the Distribution channel segment as it accounted for the largest market share in the base year.
RIA - Research AI Assistant
Ask RIA
