
Acrylonitrile Butadiene Styrene Market Size 2025-2029
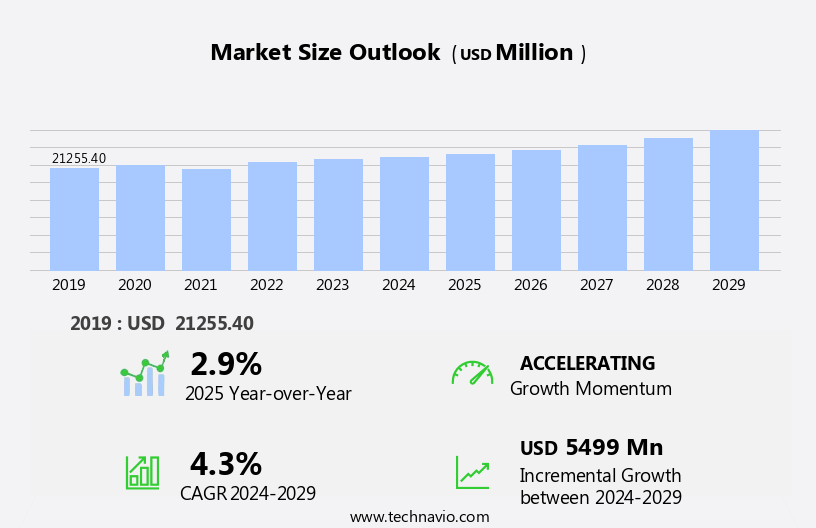
The acrylonitrile butadiene styrene (ABS) market size is forecast to increase by USD 5.5 billion at a CAGR of 4.3% between 2024 and 2029.
- The market is experiencing significant growth, driven by the launch of new manufacturing plants and product innovations. These factors are expanding the market's production capacity and enhancing the product portfolio, catering to diverse end-use industries. However, disruptions in production facilities pose a considerable challenge to market growth. Additionally, collaborating with suppliers to ensure a steady supply of raw materials can help mitigate production risks. Sustainable manufacturing, eco-friendly materials, and the circular economy are driving innovation in the ABS market, with biodegradable plastics and high-performance plastics gaining popularity.
- The ABS market presents ample opportunities for growth, fueled by new manufacturing plants and product innovations. However, companies must address production risks to ensure a consistent supply of high-quality products and maintain a competitive edge in the market. To mitigate these risks, companies must focus on implementing robust supply chain strategies, including diversifying their supplier base and investing in inventory and warehouse management systems.
What will be the Size of the Acrylonitrile Butadiene Styrene (ABS) Market during the forecast period?
ABS's versatility and evolving applications extend to sectors like aerospace, medical devices, and water systems. The market continues to evolve, driven by technological advancements and shifting consumer preferences. ABS, a versatile thermoplastic, finds extensive applications across various sectors, including automotive components, customization, and consumer goods. In the automotive industry, ABS is utilized for manufacturing automotive components, such as bumpers, headliners, and body panels, due to its mechanical strength, long-lastingness, and glossy surface. The material's lightweight properties contribute to fuel efficiency and the reduction of CO2 emissions in passenger automobiles. ABS also plays a significant role in the manufacturing of consumer goods, such as household appliances, toys, and electrical insulation materials.
Moreover, ABS is increasingly being used in additive manufacturing and 3D printing for creating intricate designs and cost-effective prototypes. The circular economy is another area where ABS is gaining traction, with the development of waste collector products and the utilization of recycled materials. The ongoing unfolding of market activities is further influenced by technological advancements, such as blue laser deposition, which enhances the material's aesthetic properties and glossy finishes. However, regulatory scrutiny and supply disruptions pose challenges to the market's growth. The material's chemical resistance, recyclability, and biodegradability make it an attractive alternative to traditional materials like polypropylene and polyethylene.
How is this Acrylonitrile Butadiene Styrene (ABS) Industry segmented?
The acrylonitrile butadiene styrene (ABS) industry research report provides comprehensive data (region-wise segment analysis), with forecasts and estimates in "USD billion" for the period 2025-2029, as well as historical data from 2019-2023 for the following segments.
- Product
- High-impact ABS
- Flame-retardant ABS
- General-purpose ABS
- Recycled ABS
- Application
- Appliances
- Electrical and electronics
- Automotive
- Construction
- Others
- Geography
- North America
- US
- Canada
- Europe
- Germany
- UK
- APAC
- Australia
- China
- India
- Japan
- South Korea
- South America
- Brazil
- Rest of World (ROW)
- North America
By Product Insights
The High-impact ABS segment is estimated to witness significant growth during the forecast period. Acrylonitrile Butadiene Styrene (ABS) is a high-performance plastic widely used in various industries due to its unique combination of properties. Notably, ABS is known for its impact resistance, durability, and lightweight nature, making it an ideal choice for applications requiring robust physical properties. This material's versatility is showcased in numerous industries, including smart electronics, automotive, and healthcare. In the realm of electronics, ABS is used for casings due to its ability to withstand shocks and vibrations. Its lightweight properties make it suitable for portable devices, contributing to fuel efficiency and reduced carbon emissions. The future of manufacturing lies in digital manufacturing and advanced manufacturing trends, where ABS plays a crucial role in additive manufacturing solutions, rapid tooling, and functional prototyping.
Moreover, ABS is a popular choice for automotive components, including interior trim, headliners, and body panels. Its high hardness and glossy surface make it visually appealing, while its mechanical strength ensures long-lastingness. In the construction industry, ABS is used for pipes and valves due to its resistance to impact and chemicals. Technological advancements, such as additive manufacturing and 3D printing, have led to the miniaturization of various products, increasing the demand for ABS as a cost-effective 3D printing material. Furthermore, the circular economy movement has driven the use of recycled ABS in the production of durable consumer goods, such as kitchen appliances and household appliances.
However, the volatile prices of raw materials and regulatory scrutiny pose challenges to the ABS market. Nevertheless, the industry continues to evolve, with ongoing research and development in areas such as biodegradable ABS and alternative materials, ensuring the market's long-term sustainability. The ABS market is driven by its unique properties, versatility, and resilience. Its applications span various industries, from smart electronics and automotive to healthcare and construction. Despite challenges, the market continues to innovate, with ongoing advancements in technology and a focus on sustainability. In the healthcare sector, ABS is used to manufacture medical devices such as insulin pumps, syringes, and dental appliances, thanks to its chemical resistance and biocompatibility.
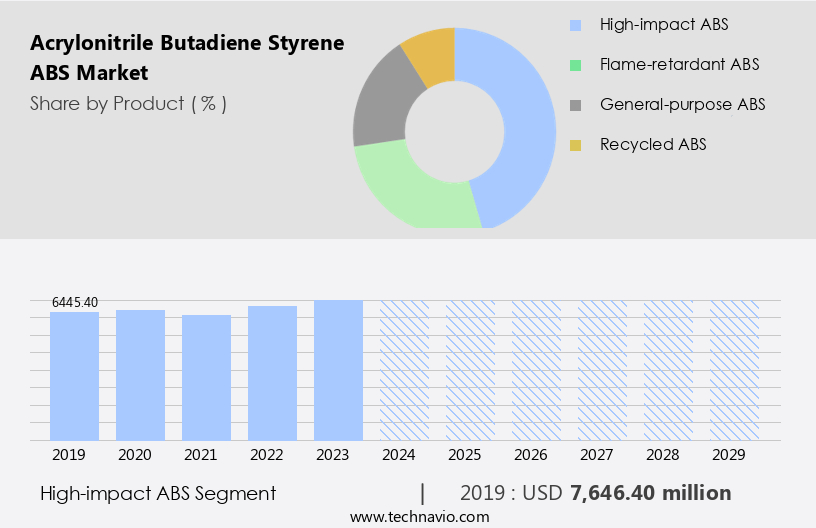
The High-impact ABS segment was valued at USD 7.65 billion in 2019 and showed a gradual increase during the forecast period.
The Acrylonitrile Butadiene Styrene (ABS) Market continues to evolve with breakthroughs in injection molding, composite materials, and advanced materials, supporting dynamic product design across industries. In medical supplies and automotive design, ABS's versatility and durability stand out. Enhanced material science and polymer science drive innovation in manufacturing processes, integrating laser sintering, plastic recycling, and additive manufacturing trends. Applications in construction materials and green technology highlight ABS's sustainable role. Demand for mass customization, personalized manufacturing, and industrial automation fuels manufacturing innovation. Strategic material selection aids product lifecycle management, while robust supply chain management and supply chain optimization ensure market resilience.
The rising use of lightweight materials and 3D printed prototypes further redefine the future of ABS-based production. The Acrylonitrile Butadiene Styrene (ABS) Market is expanding rapidly due to rising demand for durable, versatile ABS products across sectors. Growth is fueled by increased adoption in injection molding, enabling precise, high-volume manufacturing. A rise in waste collector product applications, ranging from urban sanitation to industrial use, has spotlighted ABS for its strength and lightweight design. Sustainability drives are also pushing manufacturers to utilize recyclable material, reducing environmental impact, and repurposing ABS waste effectively.
Regional Analysis
APAC is estimated to contribute 64% to the growth of the global market during the forecast period. Technavio's analysts have elaborately explained the regional trends and drivers that shape the market during the forecast period.
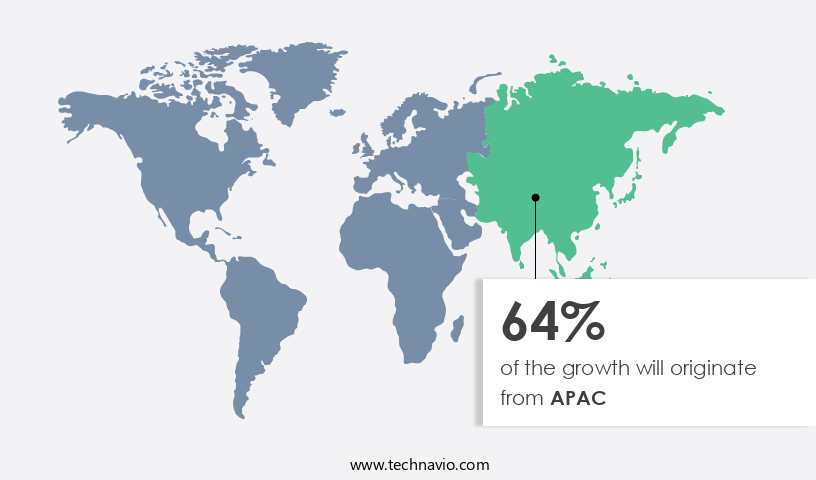
The market is witnessing significant growth, particularly in the Asia Pacific region, driven by industrial advancements and increasing demand for high-performance materials. In November 2023, INEOS Styrolution and SINOPEC inaugurated a new 600,000-ton ABS production facility in Ningbo, China, emphasizing the region's pivotal role in the market. The automotive sector in India is a significant contributor to the regional expansion, with ABS being widely used in automotive components due to its lightweight properties, mechanical strength, and resistance to impact. In the healthcare sector, ABS is used in the production of medical devices such as syringes and insulin pumps, highlighting its importance in addressing health concerns like diabetes and heart disease.
Technological advancements have led to the use of ABS in smart electronics and 3D printing, enabling customization and miniaturization. Additionally, ABS is used in the production of household appliances, casings for consumer goods, and pipes for water systems, showcasing its versatility. The market for ABS is subject to volatile prices due to fluctuations in raw material costs and supply disruptions. However, the increasing use of recycled materials and the circular economy concept are reducing the reliance on virgin materials and contributing to cost-effectiveness. Furthermore, ABS's long-lastingness, chemical resistance, and glossy surface make it a preferred choice for various industries, including aerospace, automotive, and construction.
In the automotive industry, ABS is used in the production of dashboards, body panels, center consoles, and headliners, contributing to fuel efficiency and enhancing product performance. The market for ABS is also expanding in the electrical insulation sector due to its excellent insulating properties and opacity. Despite regulatory scrutiny, ABS remains a popular choice due to its numerous advantages and consumer preferences for durable, visually appealing materials.
Market Dynamics
Our researchers analyzed the data with 2024 as the base year, along with the key drivers, trends, and challenges. A holistic analysis of drivers will help companies refine their marketing strategies to gain a competitive advantage.
What are the key market drivers leading to the rise in the adoption of Acrylonitrile Butadiene Styrene (ABS) Industry?
- The initiation of new manufacturing plants serves as the primary catalyst for market growth. The market is experiencing notable expansion due to the establishment of new manufacturing plants, such as LG Chem's new facility in India. This strategic move aims to cater to the growing demand for ABS, a versatile material used in numerous industries, including washing machines, computers, aerospace, water systems, and automotive. The new plant, currently in the trial run phase, will have an annual production capacity of 50,000 tons, focusing on producing semi-finished products and raw materials. This development is part of LG Chem's broader strategy to secure a steady supply of ABS and strengthen its presence in high-growth markets.
- ABS is a cost-effective and visually appealing material used in various applications, such as automotive parts like dashboards, head covers, and lightweight automotive parts, as well as appliances like washing machines and shavers. Furthermore, the increasing demand for alternative materials, such as biodegradable plastic, and the focus on fuel efficiency and stroke in industries like automotive and aerospace, are expected to drive the growth of the ABS market. However, potential supply disruptions due to unforeseen circumstances could impact the market dynamics.
What are the market trends shaping the Acrylonitrile Butadiene Styrene (ABS) Industry?
- Product innovations are currently shaping the market trend. It is essential for businesses to stay informed and adapt to the latest advancements in order to remain competitive. The market is experiencing notable advancements, with a focus on innovative product offerings. In April 2024, Trinseo introduced new flame-retardant polycarbonate (PC) and ABS materials at Chinaplas 2024 in Shanghai, China. These materials are significant as they are manufactured without per and polyfluoroalkyl substances (PFAS) or halogenated additives, aligning with evolving environmental and health safety concerns. This development holds relevance for industries such as consumer electronics and electrical, where the demand for safer, more sustainable materials is increasing.
- Technological advancements continue to expand the application scope of ABS in sectors like vacuum construction, waste collector products, power grids, and more. Despite volatile prices, the market's future remains promising as ABS continues to offer value in its unique combination of properties. Additionally, Trinseo's new offerings include options with recycled content, catering to the growing market trend towards eco-friendly products. Rapid prototyping, smart electronics, and various industries, including casings for diabetes care devices, kitchen appliances, and interior trim, benefit from the lightweight properties, glossy surface, and high-impact strength of ABS.
What challenges does the Acrylonitrile Butadiene Styrene (ABS) Industry face during its growth?
- Disruptions in production facilities pose a significant challenge to industry growth, as any interruption can negatively impact production efficiency, supply chains, and ultimately, revenue. The market experiences challenges due to production disruptions. In 2025, INEOS, a leading player, announced the permanent closure of its ABS production site in Addyston, Ohio, citing substantial investment requirements and economic unviability. External market conditions significantly influenced this decision, underscoring the vulnerability of production facilities to economic pressures. Parallelly, ELIX Polymers in Spain announced plans to shut down its ABS plant in Tarragona. These closures highlight the importance of addressing market instability and ensuring cost competitiveness in the ABS industry.
- Additionally, the advent of additive manufacturing and 3D printing technologies has expanded ABS applications, enabling customization and production of long-lasting, durable consumer goods. The circular economy trend also favors the use of ABS in consumer goods, as it can be recycled and transformed into new products, contributing to sustainability efforts. In the construction sector, ABS is used in the production of biodegradable and recycled materials for creating eco-friendly and cost-effective alternatives to traditional materials like polypropylene.
Exclusive Customer Landscape
The acrylonitrile butadiene styrene (ABS) market forecasting report includes the adoption lifecycle of the market, covering from the innovator's stage to the laggard's stage. It focuses on adoption rates in different regions based on penetration. Furthermore, the acrylonitrile butadiene styrene (ABS) market report also includes key purchase criteria and drivers of price sensitivity to help companies evaluate and develop their market growth analysis strategies.
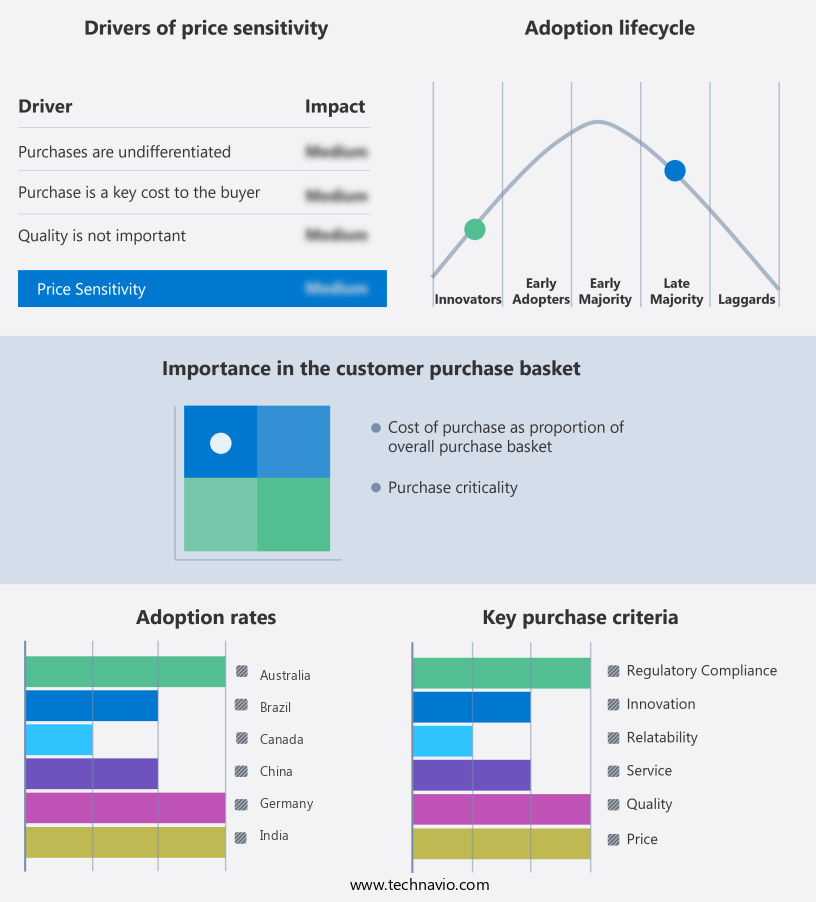
Customer Landscape
Key Companies & Market Insights
Companies are implementing various strategies, such as strategic alliances, acrylonitrile butadiene styrene (ABS) market forecast, partnerships, mergers and acquisitions, geographical expansion, and product/service launches, to enhance their presence in the industry.
BASF SE - The company offers Acrylonitrile butadiene styrene (ABS), which is a versatile thermoplastic material, widely utilized in various industries for manufacturing automobile components, consumer electronics, household appliances, toys, and more.
The industry research and growth report includes detailed analyses of the competitive landscape of the market and information about key companies, including:
- BASF SE
- Chimei Corp.
- Covestro AG
- Formosa Chemicals and Fibre Corp
- INEOS Styrolution Group GmbH
- IRPC Public Co Ltd.
- Kumho Petrochemical Co. Ltd.
- LG Chem Ltd.
- Lotte Chemical Corp.
- PetroChina Co. Ltd.
- Ravago
- RTP Co.
- Saudi Basic Industries Corp.
- Techno UMG Co Ltd.
- Tianjin Dagu Chemical Co Ltd.
- Toray Industries Inc.
- Trinseo PLC
- Versalis S.p.A
Qualitative and quantitative analysis of companies has been conducted to help clients understand the wider business environment as well as the strengths and weaknesses of key industry players. Data is qualitatively analyzed to categorize companies as pure play, category-focused, industry-focused, and diversified; it is quantitatively analyzed to categorize companies as dominant, leading, strong, tentative, and weak.
Recent Development and News in Acrylonitrile Butadiene Styrene (ABS) Market
- In February 2024, BASF, a leading global chemical producer, announced the expansion of its ABS production capacity at its site in Ludwigshafen, Germany. This expansion aims to cater to the growing demand for ABS in the automotive and electrical & electronics industries (BASF press release, 2024).
- In July 2025, LG Chem and SABIC, two major players in the chemical industry, entered into a strategic collaboration to develop and commercialize innovative ABS materials for the automotive sector. This collaboration combines LG Chem's expertise in battery materials and SABIC's experience in ABS production, with the goal of creating lighter and more sustainable automotive components (SABIC press release, 2025).
- In September 2024, Covestro, a leading polymer supplier, launched a new ABS grade, named Terraforce, which contains up to 30% recycled content. This development marks a significant step towards more sustainable ABS production and contributes to the circular economy in the plastics industry (Covestro press release, 2024).
- In March 2025, the European Chemicals Agency (ECHA) approved the renewal of the registration of ABS under the European Union's REACH regulation. This approval ensures the continued use of ABS in various industries, including automotive, electrical & electronics, and construction, while maintaining safety and environmental standards (ECHA press release, 2025).
Research Analyst Overview
In the dynamic world of materials science, the market continues to evolve, intersecting with various industries and applications. ABS, a versatile thermoplastic, is increasingly gaining traction in 3D printing applications due to its excellent mechanical properties and ease of processing. Bio-based materials and material engineering are also influencing the ABS market, as researchers explore greener alternatives to traditional petroleum-based plastics. In water infrastructure, ABS's resistance to chemicals and durability make it a preferred choice for pipe systems. In the realm of durable goods, ABS is a go-to material for automotive manufacturing, engineering plastics, and industrial design, offering lightweight solutions and design optimization. The market is further fueled by the demand for eco-friendly products, with ABS contributing to sustainable manufacturing and reducing the reliance on plastic alternatives.
ABS's versatility extends to various industries, including building materials, plumbing supplies, and shoe covers, showcasing its potential as a high-performance material in a wide range of applications. Its ability to withstand harsh environments and provide resistance to impact makes it a valuable material in these industries. The Acrylonitrile Butadiene Styrene market is a dynamic and continuously evolving landscape, with applications spanning various sectors, from automotive to consumer goods, and from aerospace to medical devices. The material's unique properties, such as mechanical strength, lightweightness, and chemical resistance, make it a valuable asset in the production of innovative and cost-effective products. The ongoing development of new technologies and regulatory frameworks will continue to shape the market's future trajectory.
Manufacturing automation and design for manufacturing are further enhancing ABS's value proposition, making it a key player in the evolving world of materials science. Furthermore, ABS is used in the manufacturing of bridges and other infrastructure projects due to its high impact resistance and long-lastingness. Overall, the ABS market continues to evolve, driven by consumer preferences, technological advancements, and sustainability initiatives. Despite these challenges, the market continues to gain traction in various sectors. In the automotive industry, ABS is widely used for manufacturing automotive components, including bumpers, body panels, headliners, and center consoles, due to its excellent mechanical strength, product performance, and chemical resistance.
Dive into Technavio's robust research methodology, blending expert interviews, extensive data synthesis, and validated models for unparalleled Acrylonitrile Butadiene Styrene (ABS) Market insights. See full methodology.
|
Market Scope |
|
|
Report Coverage |
Details |
|
Page number |
222 |
|
Base year |
2024 |
|
Historic period |
2019-2023 |
|
Forecast period |
2025-2029 |
|
Growth momentum & CAGR |
Accelerate at a CAGR of 4.3% |
|
Market growth 2025-2029 |
USD 5.5 billion |
|
Market structure |
Fragmented |
|
YoY growth 2024-2025(%) |
2.9 |
|
Key countries |
China, US, Japan, Germany, India, South Korea, Canada, Australia, Brazil, and UK |
|
Competitive landscape |
Leading Companies, Market Positioning of Companies, Competitive Strategies, and Industry Risks |
What are the Key Data Covered in this Acrylonitrile Butadiene Styrene (ABS) Market Research and Growth Report?
- CAGR of the Acrylonitrile Butadiene Styrene (ABS) industry during the forecast period
- Detailed information on factors that will drive the growth and forecasting between 2025 and 2029
- Precise estimation of the size of the market and its contribution of the industry in focus to the parent market
- Accurate predictions about upcoming growth and trends and changes in consumer behaviour
- Growth of the market across APAC, North America, Europe, South America, and Middle East and Africa
- Thorough analysis of the market's competitive landscape and detailed information about companies
- Comprehensive analysis of factors that will challenge the acrylonitrile butadiene styrene (ABS) market growth of industry companies
We can help! Our analysts can customize this acrylonitrile butadiene styrene (ABS) market research report to meet your requirements.
 RIA -
RIA - 
