Aerospace Adhesive and Sealants Market Analysis North America, APAC, Europe, South America, Middle East and Africa - US, China, India, Germany, UK - Size and Forecast 2024-2028

Aerospace Adhesive and Sealants Market Analysis North America, APAC, Europe, South America, Middle East and Africa - US, China, India, Germany, UK - Size and Forecast 2024-2028

Published: Dec 2023 182 Pages SKU: IRTNTR77038

Market Overview at a Glance

$320.65 Mn
Market Opportunity
5.34%
CAGR
4.79
YoY growth 2023-2024(%)

Aerospace Adhesive and Sealants Market Size 2024-2028 

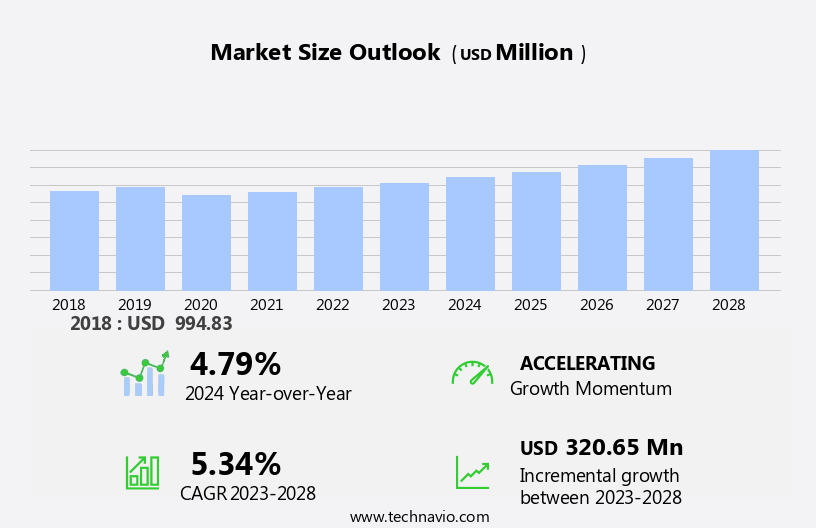
The aerospace adhesive and sealants market size is forecast to increase by USD 320.65 billion at a CAGR of 5.34% between 2023 and 2028.

  • The market is experiencing significant growth due to several key factors. The increasing number of air passengers worldwide is driving the demand for new aircraft and the need for maintenance and repairs, thereby boosting the market. Silicones, polyurethanes, polysulfides, acrylics, cyanoacrylates, hot melts, reactive, solvent-borne, UV-cured, and water-borne adhesives are some of the commonly used materials in this industry.  Additionally, investments in increasing adhesive production are on the rise to meet the growing demand from the aerospace industry. However, stringent regulatory standards associated with adhesives and sealants pose a challenge to market growth. These regulations ensure the safety and reliability of aircraft components, but they also increase production costs and complexity. To stay competitive, market players are focusing on innovation and technology to meet these regulations while maintaining cost-effectiveness and quality.

What will be the Size of the Market During the Forecast Period?

Aerospace Adhesive and Sealants Market Size

 Request Free Sample

  • The aerospace industry is a critical sector that demands high-performance materials to ensure the safety, reliability, and efficiency of aircraft. Adhesives and sealants play a pivotal role in this industry, providing solutions for bonding various components, sealing gaps, and enhancing the overall performance of aircraft. This article explores the market trends and growth dynamics of aerospace adhesives and sealants, focusing on key industry segments and applications. The aerospace adhesives and sealants market is driven by several factors. The increasing demand for lighter weight aircraft assemblies is one of the primary growth drivers.
  • These materials help reduce the overall weight of aircraft, leading to improved fuel efficiency and reduced emissions. Composite materials, which are extensively used in aircraft manufacturing, require specialized adhesives and sealants for bonding and sealing. Another significant trend in the aerospace industry is the use of multifunctional surfacing materials. These materials offer both adhesive and protective coatings, reducing the number of components required and simplifying the manufacturing process. The defense sector is a major consumer of aerospace adhesives and sealants due to the high-performance requirements of military aircraft.

How is this market segmented and which is the largest segment?

The market research report provides comprehensive data (region-wise segment analysis), with forecasts and estimates in "USD million" for the period 2024-2028, as well as historical data from 2018-2022 for the following segments.

  • Technology
    • Water-based
    • Solvent-based
    • Others
  • End-user
    • Commercial
    • Military
    • General aviation
  • Geography
    • North America
      • US
    • APAC
      • China
      • India
    • Europe
      • Germany
      • UK
    • South America
    • Middle East and Africa

By Technology Insights

  • The water-based segment is estimated to witness significant growth during the forecast period.

Water-based technology in aerospace adhesives and sealants is an eco-friendly solution for addressing bonding and sealing needs in the aviation industry. Unlike traditional solvent-based alternatives, water is used as the primary solvent or carrier for these formulations. This approach is advantageous due to its environmentally conscious nature, making it a preferred choice in applications where emissions need to be minimized. Water-based adhesives and sealants are commonly used in aerospace manufacturing processes, such as bonding and sealing aircraft components, where reducing hazardous air pollutants is essential. These adhesives consist of an organic binder, typically polyvinyl acetate (PVAc), finely dispersed in water.

Furthermore, Two other types of adhesives widely used in the aerospace sector are hot melt adhesives and pressure sensitive adhesives. Hot melt adhesives are applied in a molten state and solidify upon cooling, while pressure sensitive adhesives adhere to surfaces upon application of pressure. Both types have their unique applications in the aerospace industry. Hot melt adhesives are suitable for high-temperature applications, such as bonding engine components and insulation materials. Pressure sensitive adhesives, on the other hand, are ideal for bonding and sealing various aircraft components, such as windows, doors, and interior panels. Manufacturers of aerospace adhesives and sealants include major players such as 3M, Henkel, H.B.

Aerospace Adhesive and Sealants Market Size

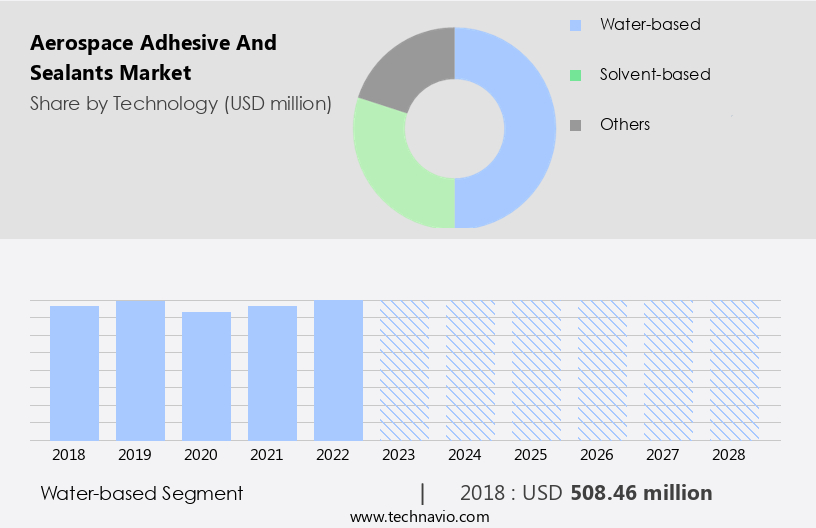
Get a glance at the market report of share of various segments Request Free Sample

The Water-based segment was valued at USD 508.46 million in 2018 and showed a gradual increase during the forecast period.

Regional Analysis

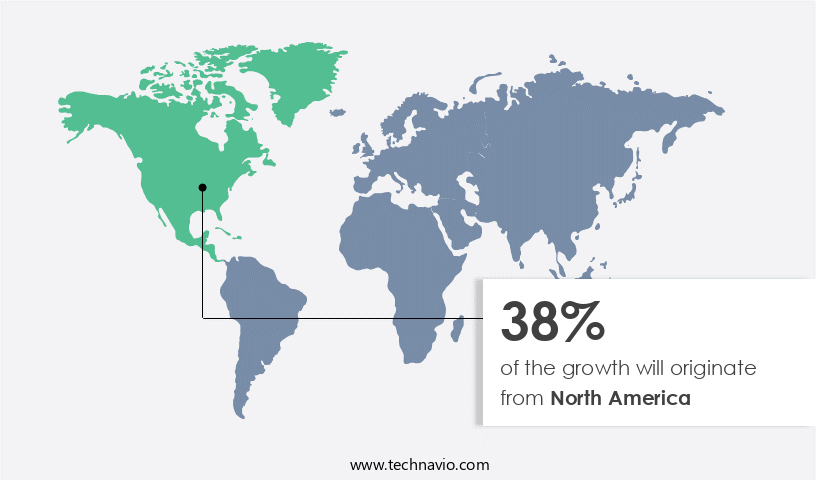
  • North America is estimated to contribute 38% to the growth of the global market during the forecast period.

Technavio's analysts have elaborately explained the regional trends and drivers that shape the market during the forecast period.

Aerospace Adhesive and Sealants Market Share by Geography

For more insights on the market share of various regions Request Free Sample

In North America, the market holds significant importance, fueling advancements, production, and demand for superior materials within the aerospace sector. The United States, a key region in this market, is home to prominent aerospace companies such as Boeing and Lockheed Martin. These industry leaders, based in Seattle, Washington, and southern California, are at the forefront of aircraft manufacturing and research and development. The region's thriving aerospace industry is underpinned by the presence of these players and a strong defense sector. Lightweight aircraft assemblies, control systems, nacelle systems, fuselages, and engine parts all rely on high-performance adhesives and sealants for optimal functionality.

The continuous demand for advanced technology and innovation in aerospace applications ensures the market's growth in North America.

Market Dynamics

Our researchers analyzed the data with 2023 as the base year, along with the key drivers, trends, and challenges. A holistic analysis of drivers will help companies refine their marketing strategies to gain a competitive advantage.

What are the key market drivers leading to the rise in adoption of Aerospace Adhesive and Sealants Market?

The rise in number of air passengers globally is the key driver of the market.

  • The aerospace adhesives and sealants market is witnessing significant growth due to the increasing demand for new aircraft and the expanding MRO business in the US aviation industry. With the rise of low-cost airlines and the growing trend towards decarbonization, there is a heightened focus on producing lightweight aircraft assemblies. This has led to the increased use of advanced materials, such as composite materials in aircraft manufacturing. Aerospace adhesives and sealants play a crucial role in the production and maintenance of various aircraft components, including control systems, nacelle systems, fuselages, engine parts, sandwich panels, and edge bonding. These materials ensure the structural integrity of these components by providing bonding and sealing functions, as well as enhancing their chemical resistance and tensile strength..
  • The market for aerospace adhesives and sealants is diverse, with various types of adhesives such as silicone, polyurethane, hot melt adhesives, pressure sensitive adhesives, solvent-borne, and UV cured adhesives, among others, being used. Similarly, sealants come in various forms, including polysulfide, acrylic, cyanoacrylate, epoxy, and reactive sealants. Tier I suppliers and systems integrators are the primary consumers of aerospace adhesives and sealants. The OEM and MRO sectors are the largest markets for these materials, with the MRO business experiencing significant growth due to the increasing demand for aircraft aftermarket services. Fuel costs and the need for fuel efficiency are also driving the demand for lightweight and efficient adhesives and sealants.

What are the market trends shaping the Aerospace Adhesive and Sealants Market?

Increasing investments for boosting adhesive production is the upcoming trend in the market.

  • The aerospace adhesives and sealants market is experiencing significant growth due to the increasing demand for lightweight aircraft assemblies in the aviation industry. Aircraft manufacturers and MRO (Maintenance, Repair, and Overhaul) businesses are investing in advanced adhesive technologies to enhance the performance and durability of various aircraft components. This state-of-the-art plant, named Kunpeng, will boost Henkel's production capacity for high-performance adhesive products, including silicone, polyurethane, hot melt adhesives, pressure-sensitive adhesives, and reactive adhesives. The new facility will also optimize Henkel's supply network, enabling the company to efficiently serve both domestic and international markets.
  • The growing demand for these adhesive solutions is driven by the need for chemical resistance, lightweight structures, and cost efficiency in aircraft manufacturing. Key applications include control systems, nacelle systems, fuselages, engine parts, sandwich panels, edge bonding, and void filling in honeycomb structures. Moreover, the increasing popularity of low-cost airlines and the rise of leisure tourism have fueled the demand for more fuel-efficient aircraft, further emphasizing the importance of lightweight and strong adhesive solutions. The MRO business in the aircraft aftermarket is also a significant contributor to the growth of the aerospace adhesives and sealants market. Tier I suppliers and systems integrators are increasingly relying on these advanced materials to improve the tensile strength of mechanical fasteners, such as screws and weld joints, and to reduce fuel costs through decarbonization efforts.

What challenges does Aerospace Adhesive and Sealants Market face during the growth?

Stringent regulatory standards associated with adhesives and sealants is a key challenge affecting the market growth.

  • In the aerospace industry, adherence to stringent regulatory standards is a critical factor in The market. The FAA, among other international aviation authorities, sets and enforces regulations for materials used in aircraft construction and maintenance, including adhesives and sealants. Compliance with these regulations is essential for manufacturers to secure airworthiness certifications for their products. Adhesives and sealants play a crucial role in the aerospace sector, with applications ranging from control systems and nacelle systems to fuselages, engine parts, and sandwich panels. Materials such as silicone, polyurethane, hot melt adhesives, pressure sensitive adhesives, polysulfide, acrylic, cyanoacrylate, epoxy, hot melt, reactive, sealants, solvent-borne, and UV cured adhesives are commonly used in the industry.
  • The aerospace market consists of Original Equipment Manufacturers (OEM) and Maintenance, Repair, and Overhaul (MRO) businesses. Tier I suppliers and systems integrators also play a significant role in the value chain. Lightweight aircraft assemblies, control systems, and fuel costs are driving market growth. Decarbonization and leisure tourism are also contributing factors. Key challenges in the market include the need for chemical resistance, low cost, and high tensile strength. Manufacturers must balance these requirements with the need for lightweight materials to reduce fuel costs and meet decarbonization goals. Mechanical fasteners, such as screws and weld joints, are also used in aircraft assembly but are being replaced by adhesives and sealants to reduce weight and improve performance.

Exclusive Customer Landscape

The market forecasting report includes the adoption lifecycle of the market, covering from the innovator's stage to the laggard's stage. It focuses on adoption rates in different regions based on penetration. Furthermore, the market report also includes key purchase criteria and drivers of price sensitivity to help companies evaluate and develop their market growth analysis strategies.

Aerospace Adhesive and Sealants Market Share by Geography

 Customer Landscape

Key Companies & Market Insights

Companies are implementing various strategies, such as strategic alliances, market forecast , partnerships, mergers and acquisitions, geographical expansion, and product/service launches, to enhance their presence in the market.

The market research and growth report includes detailed analyses of the competitive landscape of the market and information about key companies, including:

  • 3M Co.
  • Akzo Nobel NV
  • Antala S.L.
  • Beacon Adhesives Inc.
  • Bostik Ltd.
  • Dow Chemical Co.
  • Dymax Corp.
  • Henkel AG and Co. KGaA
  • Hernon Manufacturing Inc.
  • Hexcel Corp.
  • Holcim Ltd.
  • Huntsman International LLC
  • L and L Products Inc.
  • Lanxess AG
  • Master Bond Inc.
  • Permabond LLC
  • PPG Industries Inc.
  • Sika AG
  • Solvay SA
  • Vitrochem Technology

Qualitative and quantitative analysis of companies has been conducted to help clients understand the wider business environment as well as the strengths and weaknesses of key market players. Data is qualitatively analyzed to categorize companies as pure play, category-focused, industry-focused, and diversified; it is quantitatively analyzed to categorize companies as dominant, leading, strong, tentative, and weak.

Research Analyst Overview

The market is experiencing significant growth due to the increasing demand for aircraft production and maintenance, repair, and overhaul (MRO) activities. The market is driven by several factors, including the rise of low-cost airlines, the introduction of newer aircraft models, and the increasing use of composite materials in aircraft manufacturing. Chemical resistance is a crucial factor in the selection of adhesives and sealants for the aerospace industry. Adhesives and sealants used in aircraft applications must be able to withstand extreme temperatures, high pressures, and harsh environmental conditions.

Silicone and polyurethane are popular choices due to their excellent chemical resistance and high performance in extreme conditions. Hot melt adhesives and pressure-sensitive adhesives (PSAs) are widely used in the aerospace industry for various applications, including control systems, nacelle systems, fuselages, engine parts, and sandwich panels. These adhesives offer several advantages, such as high bonding strength, fast curing time, and ease of application. Solvent-borne and water-borne technologies are commonly used in the production of aerospace adhesives and sealants. Solvent-borne adhesives offer high bonding strength and excellent chemical resistance, but they have environmental concerns due to their high volatile organic compound (VOC) content.

Market Scope

Report Coverage

Details

Page number

182

Base year

2023

Historic period

2018-2022

Forecast period

2024-2028

Growth momentum & CAGR

Accelerate at a CAGR of 5.34%

Market Growth 2024-2028

USD 320.65 million

Market structure

Fragmented

YoY growth 2023-2024(%)

4.79

Key countries

US, China, India, Germany, and UK

Competitive landscape

Leading Companies, Market Positioning of Companies, Competitive Strategies, and Industry Risks

Request Free Sample

What are the Key Data Covered in this Market Research and Growth Report?

  • CAGR of the market during the forecast period
  • Detailed information on factors that will drive the market growth and forecasting between 2024 and 2028
  • Precise estimation of the size of the market  and its contribution of the market in focus to the parent market
  • Accurate predictions about upcoming market growth and trends and changes in consumer behaviour
  • Growth of the market across North America, APAC, Europe, South America, and Middle East and Africa
  • Thorough analysis of the market's competitive landscape and detailed information about companies
  • Comprehensive analysis of factors that will challenge the growth of market companies

We can help! Our analysts can customize this market research report to meet your requirements. Get in touch

1 Executive Summary

  • 1.1 Market overview
    • Exhibit 01: Executive Summary – Chart on Market Overview
    • Exhibit 02: Executive Summary – Data Table on Market Overview
    • Exhibit 03: Executive Summary – Chart on Global Market Characteristics
    • Exhibit 04: Executive Summary – Chart on Market by Geography
    • Exhibit 05: Executive Summary – Chart on Market Segmentation by Technology
    • Exhibit 06: Executive Summary – Chart on Market Segmentation by End-user
    • Exhibit 07: Executive Summary – Chart on Incremental Growth
    • Exhibit 08: Executive Summary – Data Table on Incremental Growth
    • Exhibit 09: Executive Summary – Chart on Vendor Market Positioning

2 Market Landscape

  • 2.1 Market ecosystem
    • Exhibit 10: Parent market
    • Exhibit 11: Market Characteristics

3 Market Sizing

  • 3.1 Market definition
    • Exhibit 12: Offerings of vendors included in the market definition
  • 3.2 Market segment analysis
    • Exhibit 13: Market segments
  • 3.3 Market size 2023
    • 3.4 Market outlook: Forecast for 2023-2028
      • Exhibit 14: Chart on Global - Market size and forecast 2023-2028 ($ million)
      • Exhibit 15: Data Table on Global - Market size and forecast 2023-2028 ($ million)
      • Exhibit 16: Chart on Global Market: Year-over-year growth 2023-2028 (%)
      • Exhibit 17: Data Table on Global Market: Year-over-year growth 2023-2028 (%)

    4 Historic Market Size

    • 4.1 Global aerospace adhesive and sealants market 2018 - 2022
      • Exhibit 18: Historic Market Size – Data Table on global aerospace adhesive and sealants market 2018 - 2022 ($ million)
    • 4.2 Technology Segment Analysis 2018 - 2022
      • Exhibit 19: Historic Market Size – Technology Segment 2018 - 2022 ($ million)
    • 4.3 End User Segment Analysis 2018 - 2022
      • Exhibit 20: Historic Market Size – End User Segment 2018 - 2022 ($ million)
    • 4.4 Geography Segment Analysis 2018 - 2022
      • Exhibit 21: Historic Market Size – Geography Segment 2018 - 2022 ($ million)
    • 4.5 Country Segment Analysis 2018 - 2022
      • Exhibit 22: Historic Market Size – Country Segment 2018 - 2022 ($ million)

    5 Five Forces Analysis

    • 5.1 Five forces summary
      • Exhibit 23: Five forces analysis - Comparison between 2023 and 2028
    • 5.2 Bargaining power of buyers
      • Exhibit 24: Chart on Bargaining power of buyers – Impact of key factors 2023 and 2028
    • 5.3 Bargaining power of suppliers
      • Exhibit 25: Bargaining power of suppliers – Impact of key factors in 2023 and 2028
    • 5.4 Threat of new entrants
      • Exhibit 26: Threat of new entrants – Impact of key factors in 2023 and 2028
    • 5.5 Threat of substitutes
      • Exhibit 27: Threat of substitutes – Impact of key factors in 2023 and 2028
    • 5.6 Threat of rivalry
      • Exhibit 28: Threat of rivalry – Impact of key factors in 2023 and 2028
    • 5.7 Market condition
      • Exhibit 29: Chart on Market condition - Five forces 2023 and 2028

    6 Market Segmentation by Technology

    • 6.1 Market segments
      • Exhibit 30: Chart on Technology - Market share 2023-2028 (%)
      • Exhibit 31: Data Table on Technology - Market share 2023-2028 (%)
    • 6.2 Comparison by Technology
      • Exhibit 32: Chart on Comparison by Technology
      • Exhibit 33: Data Table on Comparison by Technology
    • 6.3 Water-based - Market size and forecast 2023-2028
      • Exhibit 34: Chart on Water-based - Market size and forecast 2023-2028 ($ million)
      • Exhibit 35: Data Table on Water-based - Market size and forecast 2023-2028 ($ million)
      • Exhibit 36: Chart on Water-based - Year-over-year growth 2023-2028 (%)
      • Exhibit 37: Data Table on Water-based - Year-over-year growth 2023-2028 (%)
    • 6.4 Solvent-based - Market size and forecast 2023-2028
      • Exhibit 38: Chart on Solvent-based - Market size and forecast 2023-2028 ($ million)
      • Exhibit 39: Data Table on Solvent-based - Market size and forecast 2023-2028 ($ million)
      • Exhibit 40: Chart on Solvent-based - Year-over-year growth 2023-2028 (%)
      • Exhibit 41: Data Table on Solvent-based - Year-over-year growth 2023-2028 (%)
    • 6.5 Others - Market size and forecast 2023-2028
      • Exhibit 42: Chart on Others - Market size and forecast 2023-2028 ($ million)
      • Exhibit 43: Data Table on Others - Market size and forecast 2023-2028 ($ million)
      • Exhibit 44: Chart on Others - Year-over-year growth 2023-2028 (%)
      • Exhibit 45: Data Table on Others - Year-over-year growth 2023-2028 (%)
    • 6.6 Market opportunity by Technology
      • Exhibit 46: Market opportunity by Technology ($ million)
      • Exhibit 47: Data Table on Market opportunity by Technology ($ million)

    7 Market Segmentation by End-user

    • 7.1 Market segments
      • Exhibit 48: Chart on End-user - Market share 2023-2028 (%)
      • Exhibit 49: Data Table on End-user - Market share 2023-2028 (%)
    • 7.2 Comparison by End-user
      • Exhibit 50: Chart on Comparison by End-user
      • Exhibit 51: Data Table on Comparison by End-user
    • 7.3 Commercial - Market size and forecast 2023-2028
      • Exhibit 52: Chart on Commercial - Market size and forecast 2023-2028 ($ million)
      • Exhibit 53: Data Table on Commercial - Market size and forecast 2023-2028 ($ million)
      • Exhibit 54: Chart on Commercial - Year-over-year growth 2023-2028 (%)
      • Exhibit 55: Data Table on Commercial - Year-over-year growth 2023-2028 (%)
    • 7.4 Military - Market size and forecast 2023-2028
      • Exhibit 56: Chart on Military - Market size and forecast 2023-2028 ($ million)
      • Exhibit 57: Data Table on Military - Market size and forecast 2023-2028 ($ million)
      • Exhibit 58: Chart on Military - Year-over-year growth 2023-2028 (%)
      • Exhibit 59: Data Table on Military - Year-over-year growth 2023-2028 (%)
    • 7.5 General aviation - Market size and forecast 2023-2028
      • Exhibit 60: Chart on General aviation - Market size and forecast 2023-2028 ($ million)
      • Exhibit 61: Data Table on General aviation - Market size and forecast 2023-2028 ($ million)
      • Exhibit 62: Chart on General aviation - Year-over-year growth 2023-2028 (%)
      • Exhibit 63: Data Table on General aviation - Year-over-year growth 2023-2028 (%)
    • 7.6 Market opportunity by End-user
      • Exhibit 64: Market opportunity by End-user ($ million)
      • Exhibit 65: Data Table on Market opportunity by End-user ($ million)

    8 Customer Landscape

    • 8.1 Customer landscape overview
      • Exhibit 66: Analysis of price sensitivity, lifecycle, customer purchase basket, adoption rates, and purchase criteria

    9 Geographic Landscape

    • 9.1 Geographic segmentation
      • Exhibit 67: Chart on Market share by geography 2023-2028 (%)
      • Exhibit 68: Data Table on Market share by geography 2023-2028 (%)
    • 9.2 Geographic comparison
      • Exhibit 69: Chart on Geographic comparison
      • Exhibit 70: Data Table on Geographic comparison
    • 9.3 North America - Market size and forecast 2023-2028
      • Exhibit 71: Chart on North America - Market size and forecast 2023-2028 ($ million)
      • Exhibit 72: Data Table on North America - Market size and forecast 2023-2028 ($ million)
      • Exhibit 73: Chart on North America - Year-over-year growth 2023-2028 (%)
      • Exhibit 74: Data Table on North America - Year-over-year growth 2023-2028 (%)
    • 9.4 APAC - Market size and forecast 2023-2028
      • Exhibit 75: Chart on APAC - Market size and forecast 2023-2028 ($ million)
      • Exhibit 76: Data Table on APAC - Market size and forecast 2023-2028 ($ million)
      • Exhibit 77: Chart on APAC - Year-over-year growth 2023-2028 (%)
      • Exhibit 78: Data Table on APAC - Year-over-year growth 2023-2028 (%)
    • 9.5 Europe - Market size and forecast 2023-2028
      • Exhibit 79: Chart on Europe - Market size and forecast 2023-2028 ($ million)
      • Exhibit 80: Data Table on Europe - Market size and forecast 2023-2028 ($ million)
      • Exhibit 81: Chart on Europe - Year-over-year growth 2023-2028 (%)
      • Exhibit 82: Data Table on Europe - Year-over-year growth 2023-2028 (%)
    • 9.6 South America - Market size and forecast 2023-2028
      • Exhibit 83: Chart on South America - Market size and forecast 2023-2028 ($ million)
      • Exhibit 84: Data Table on South America - Market size and forecast 2023-2028 ($ million)
      • Exhibit 85: Chart on South America - Year-over-year growth 2023-2028 (%)
      • Exhibit 86: Data Table on South America - Year-over-year growth 2023-2028 (%)
    • 9.7 Middle East and Africa - Market size and forecast 2023-2028
      • Exhibit 87: Chart on Middle East and Africa - Market size and forecast 2023-2028 ($ million)
      • Exhibit 88: Data Table on Middle East and Africa - Market size and forecast 2023-2028 ($ million)
      • Exhibit 89: Chart on Middle East and Africa - Year-over-year growth 2023-2028 (%)
      • Exhibit 90: Data Table on Middle East and Africa - Year-over-year growth 2023-2028 (%)
    • 9.8 US - Market size and forecast 2023-2028
      • Exhibit 91: Chart on US - Market size and forecast 2023-2028 ($ million)
      • Exhibit 92: Data Table on US - Market size and forecast 2023-2028 ($ million)
      • Exhibit 93: Chart on US - Year-over-year growth 2023-2028 (%)
      • Exhibit 94: Data Table on US - Year-over-year growth 2023-2028 (%)
    • 9.9 China - Market size and forecast 2023-2028
      • Exhibit 95: Chart on China - Market size and forecast 2023-2028 ($ million)
      • Exhibit 96: Data Table on China - Market size and forecast 2023-2028 ($ million)
      • Exhibit 97: Chart on China - Year-over-year growth 2023-2028 (%)
      • Exhibit 98: Data Table on China - Year-over-year growth 2023-2028 (%)
    • 9.10 Germany - Market size and forecast 2023-2028
      • Exhibit 99: Chart on Germany - Market size and forecast 2023-2028 ($ million)
      • Exhibit 100: Data Table on Germany - Market size and forecast 2023-2028 ($ million)
      • Exhibit 101: Chart on Germany - Year-over-year growth 2023-2028 (%)
      • Exhibit 102: Data Table on Germany - Year-over-year growth 2023-2028 (%)
    • 9.11 UK - Market size and forecast 2023-2028
      • Exhibit 103: Chart on UK - Market size and forecast 2023-2028 ($ million)
      • Exhibit 104: Data Table on UK - Market size and forecast 2023-2028 ($ million)
      • Exhibit 105: Chart on UK - Year-over-year growth 2023-2028 (%)
      • Exhibit 106: Data Table on UK - Year-over-year growth 2023-2028 (%)
    • 9.12 India - Market size and forecast 2023-2028
      • Exhibit 107: Chart on India - Market size and forecast 2023-2028 ($ million)
      • Exhibit 108: Data Table on India - Market size and forecast 2023-2028 ($ million)
      • Exhibit 109: Chart on India - Year-over-year growth 2023-2028 (%)
      • Exhibit 110: Data Table on India - Year-over-year growth 2023-2028 (%)
    • 9.13 Market opportunity by geography
      • Exhibit 111: Market opportunity by geography ($ million)
      • Exhibit 112: Data Tables on Market opportunity by geography ($ million)

    10 Drivers, Challenges, and Trends

    • 10.1 Market drivers
      • 10.2 Market challenges
        • 10.3 Impact of drivers and challenges
          • Exhibit 113: Impact of drivers and challenges in 2023 and 2028
        • 10.4 Market trends

          11 Vendor Landscape

          • 11.1 Overview
            • 11.2 Vendor landscape
              • Exhibit 114: Overview on Criticality of inputs and Factors of differentiation
            • 11.3 Landscape disruption
              • Exhibit 115: Overview on factors of disruption
            • 11.4 Industry risks
              • Exhibit 116: Impact of key risks on business

            12 Vendor Analysis

            • 12.1 Vendors covered
              • Exhibit 117: Vendors covered
            • 12.2 Market positioning of vendors
              • Exhibit 118: Matrix on vendor position and classification
            • 12.3 3M Co.
              • Exhibit 119: 3M Co. - Overview
              • Exhibit 120: 3M Co. - Business segments
              • Exhibit 121: 3M Co. - Key news
              • Exhibit 122: 3M Co. - Key offerings
              • Exhibit 123: 3M Co. - Segment focus
            • 12.4 Akzo Nobel NV
              • Exhibit 124: Akzo Nobel NV - Overview
              • Exhibit 125: Akzo Nobel NV - Business segments
              • Exhibit 126: Akzo Nobel NV - Key news
              • Exhibit 127: Akzo Nobel NV - Key offerings
              • Exhibit 128: Akzo Nobel NV - Segment focus
            • 12.5 Beacon Adhesives Inc.
              • Exhibit 129: Beacon Adhesives Inc. - Overview
              • Exhibit 130: Beacon Adhesives Inc. - Product / Service
              • Exhibit 131: Beacon Adhesives Inc. - Key offerings
            • 12.6 Bostik Ltd.
              • Exhibit 132: Bostik Ltd. - Overview
              • Exhibit 133: Bostik Ltd. - Product / Service
              • Exhibit 134: Bostik Ltd. - Key offerings
            • 12.7 Dow Chemical Co.
              • Exhibit 135: Dow Chemical Co. - Overview
              • Exhibit 136: Dow Chemical Co. - Business segments
              • Exhibit 137: Dow Chemical Co. - Key news
              • Exhibit 138: Dow Chemical Co. - Key offerings
              • Exhibit 139: Dow Chemical Co. - Segment focus
            • 12.8 Dymax Corp.
              • Exhibit 140: Dymax Corp. - Overview
              • Exhibit 141: Dymax Corp. - Product / Service
              • Exhibit 142: Dymax Corp. - Key offerings
            • 12.9 Henkel AG and Co. KGaA
              • Exhibit 143: Henkel AG and Co. KGaA - Overview
              • Exhibit 144: Henkel AG and Co. KGaA - Business segments
              • Exhibit 145: Henkel AG and Co. KGaA - Key news
              • Exhibit 146: Henkel AG and Co. KGaA - Key offerings
              • Exhibit 147: Henkel AG and Co. KGaA - Segment focus
            • 12.10 Hexcel Corp.
              • Exhibit 148: Hexcel Corp. - Overview
              • Exhibit 149: Hexcel Corp. - Business segments
              • Exhibit 150: Hexcel Corp. - Key news
              • Exhibit 151: Hexcel Corp. - Key offerings
              • Exhibit 152: Hexcel Corp. - Segment focus
            • 12.11 Holcim Ltd.
              • Exhibit 153: Holcim Ltd. - Overview
              • Exhibit 154: Holcim Ltd. - Business segments
              • Exhibit 155: Holcim Ltd. - Key offerings
              • Exhibit 156: Holcim Ltd. - Segment focus
            • 12.12 Huntsman International LLC
              • Exhibit 157: Huntsman International LLC - Overview
              • Exhibit 158: Huntsman International LLC - Business segments
              • Exhibit 159: Huntsman International LLC - Key news
              • Exhibit 160: Huntsman International LLC - Key offerings
              • Exhibit 161: Huntsman International LLC - Segment focus
            • 12.13 Master Bond Inc.
              • Exhibit 162: Master Bond Inc. - Overview
              • Exhibit 163: Master Bond Inc. - Product / Service
              • Exhibit 164: Master Bond Inc. - Key offerings
            • 12.14 Permabond LLC
              • Exhibit 165: Permabond LLC - Overview
              • Exhibit 166: Permabond LLC - Product / Service
              • Exhibit 167: Permabond LLC - Key offerings
            • 12.15 PPG Industries Inc.
              • Exhibit 168: PPG Industries Inc. - Overview
              • Exhibit 169: PPG Industries Inc. - Business segments
              • Exhibit 170: PPG Industries Inc. - Key offerings
              • Exhibit 171: PPG Industries Inc. - Segment focus
            • 12.16 Sika AG
              • Exhibit 172: Sika AG - Overview
              • Exhibit 173: Sika AG - Business segments
              • Exhibit 174: Sika AG - Key news
              • Exhibit 175: Sika AG - Key offerings
              • Exhibit 176: Sika AG - Segment focus
            • 12.17 Solvay SA
              • Exhibit 177: Solvay SA - Overview
              • Exhibit 178: Solvay SA - Business segments
              • Exhibit 179: Solvay SA - Key news
              • Exhibit 180: Solvay SA - Key offerings
              • Exhibit 181: Solvay SA - Segment focus

            13 Appendix

            • 13.1 Scope of the report
              • 13.2 Inclusions and exclusions checklist
                • Exhibit 182: Inclusions checklist
                • Exhibit 183: Exclusions checklist
              • 13.3 Currency conversion rates for US$
                • Exhibit 184: Currency conversion rates for US$
              • 13.4 Research methodology
                • Exhibit 185: Research methodology
                • Exhibit 186: Validation techniques employed for market sizing
                • Exhibit 187: Information sources
              • 13.5 List of abbreviations
                • Exhibit 188: List of abbreviations

              Research Methodology

              Technavio presents a detailed picture of the market by way of study, synthesis, and summation of data from multiple sources. The analysts have presented the various facets of the market with a particular focus on identifying the key industry influencers. The data thus presented is comprehensive, reliable, and the result of extensive research, both primary and secondary.

              INFORMATION SOURCES

              Primary sources

              • Manufacturers and suppliers
              • Channel partners
              • Industry experts
              • Strategic decision makers

              Secondary sources

              • Industry journals and periodicals
              • Government data
              • Financial reports of key industry players
              • Historical data
              • Press releases

              DATA ANALYSIS

              Data Synthesis

              • Collation of data
              • Estimation of key figures
              • Analysis of derived insights

              Data Validation

              • Triangulation with data models
              • Reference against proprietary databases
              • Corroboration with industry experts

              REPORT WRITING

              Qualitative

              • Market drivers
              • Market challenges
              • Market trends
              • Five forces analysis

              Quantitative

              • Market size and forecast
              • Market segmentation
              • Geographical insights
              • Competitive landscape

              Interested in this report?

              Get your sample now to see our research methodology and insights!

              Download Now

              Frequently Asked Questions

              Aerospace Adhesive and Sealants market growth will increase by $ 320.65 mn during 2024-2028.

              The Aerospace Adhesive and Sealants market is expected to grow at a CAGR of 5.34% during 2024-2028.

              Aerospace Adhesive and Sealants market is segmented by Technology( Water-based, Solvent-based, Others) End-user( Commercial, Military, General aviation)

              3M Co., Akzo Nobel NV, Antala S.L., Beacon Adhesives Inc., Bostik Ltd., Dow Chemical Co., Dymax Corp., Henkel AG and Co. KGaA, Hernon Manufacturing Inc., Hexcel Corp., Holcim Ltd., Huntsman International LLC, L and L Products Inc., Lanxess AG, Master Bond Inc., Permabond LLC, PPG Industries Inc., Sika AG, Solvay SA, Vitrochem Technology are a few of the key vendors in the Aerospace Adhesive and Sealants market.

              North America will register the highest growth rate of 38% among the other regions. Therefore, the Aerospace Adhesive and Sealants market in North America is expected to garner significant business opportunities for the vendors during the forecast period.

              US, China, India, Germany, UK

              • Rise in number of air passengers globallyThe aviation industry has experienced a sustained increase in demand for both commercial and military aircraft due to the growing number of air passengers globally. In August 2023 is the driving factor this market.
              • the International Air Transport Association (IATA) reported a robust continuation of the post-pandemic surge in passenger traffic. The total traffic is the driving factor this market.
              • measured in revenue passenger kilometers (RPKs) is the driving factor this market.
              • experienced a substantial 28.4% increase compared to August 2022 is the driving factor this market.
              • bringing global traffic to 95.7% of pre-COVID levels. Domestic traffic for August exhibited a notable rise of 25.4% compared to the same month in 2022 is the driving factor this market.
              • surpassing August 2019 results by 9.2%. This remarkable growth was primarily fueled by strong demand within China. On the international front is the driving factor this market.
              • there was a remarkable 30.4% increase in traffic compared to August of the previous year is the driving factor this market.
              • with all markets registering double-digit percentage gains year on year. International RPKs reached 88.5% of the levels observed in August 2019. The rise in air travel globally is attributed to several factors is the driving factor this market.
              • such as the increasing demand for business and leisure travel is the driving factor this market.
              • the expansion of commercial airline routes is the driving factor this market.
              • and the emergence of low-cost carriers. The increasing demand for air travel has led to a rise in aircraft production is the driving factor this market.
              • which is the driving factor this market.
              • in turn is the driving factor this market.
              • has boosted the demand for aerospace adhesives and sealants. As air travel continues to grow globally is the driving factor this market.
              • fueled by factors such as increasing disposable incomes is the driving factor this market.
              • urbanization is the driving factor this market.
              • and globalization is the driving factor this market.
              • aerospace manufacturers are responding by expanding their production capabilities. This surge in aircraft production directly influences the demand for aerospace adhesives and sealants is the driving factor this market.
              • which play a crucial role in assembling and bonding various components of the aircraft. Thus is the driving factor this market.
              • the rise in the number of air passengers globally is expected to drive the growth of the market in focus during the forecast period.v is the driving factor this market.

              The Aerospace Adhesive and Sealants market vendors should focus on grabbing business opportunities from the Water-based segment as it accounted for the largest market share in the base year.