
Ai Energy Efficiency Tools Market Size and Growth Forecast 2026-2030
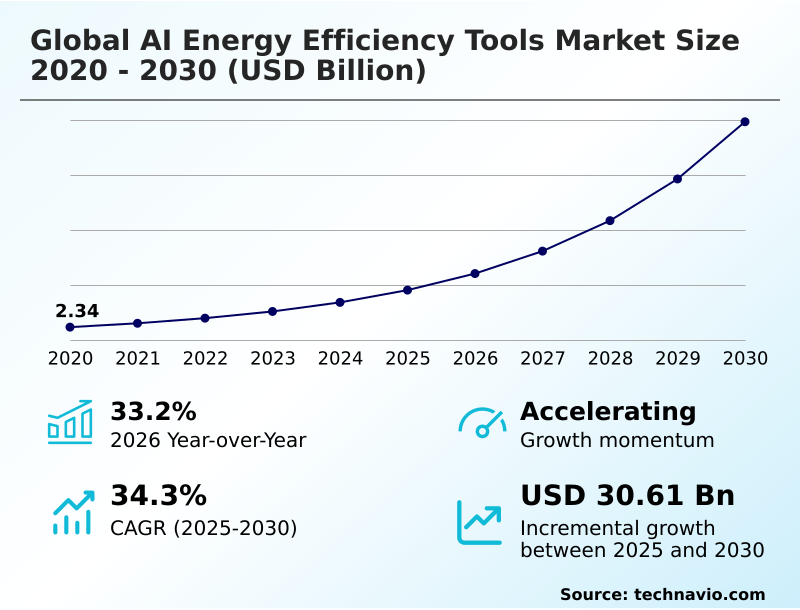
The Ai Energy Efficiency Tools Market size was valued at USD 9.07 billion in 2025 growing at a CAGR of 34.3% during the forecast period 2026-2030.
North America accounts for 40.5% of incremental growth during the forecast period. The Software segment by Component was valued at USD 4.81 billion in 2024, while the Cloud-based segment holds the largest revenue share by Deployment.
The market is projected to grow by USD 37.34 billion from 2020 to 2030, with USD 30.61 billion of the growth expected during the forecast period of 2025 to 2030.
Get Key Insights on Market Forecast (PDF) Request Free Sample
Ai Energy Efficiency Tools Market Overview
The AI energy efficiency tools market is defined by the urgent need for operational cost reduction and adherence to stringent sustainability mandates. With North America poised to contribute over 40% of market expansion, adoption is accelerating in energy-intensive sectors where year-over-year growth is reaching 33.2%. These tools leverage predictive maintenance algorithms and demand response programs to mitigate the impact of volatile energy pricing. For instance, a large-scale data center deploying AI-driven thermal mapping analytics can optimize its power usage effectiveness (PUE) by dynamically adjusting cooling loads, often achieving a 15-20% reduction in energy consumption. This capability is critical as facilities integrate more distributed energy resources. The integration with existing building automation systems, governed by standards like ASHRAE 90.1, remains a key consideration for facility managers evaluating the total cost of ownership. As organizations prioritize carbon footprint tracking, these intelligent platforms provide the necessary data for transparent corporate sustainability reporting and improved grid stability solutions. The shift toward autonomous building control and smart grid management further underscores the market's trajectory, moving beyond simple monitoring to active, real-time optimization.
Drivers, Trends, and Challenges in the Ai Energy Efficiency Tools Market
The global AI energy efficiency tools market 2026-2030 is driven by the need to balance cost, compliance, and performance. A primary challenge for adopters is quantifying ROI of AI energy efficiency tools, especially when integrating legacy systems with modern AI platforms.
However, successful deployments demonstrate clear value; a facility using AI platforms for smart grid demand response, guided by ISO 50001 standards, often cuts peak energy costs by over 20% compared to manually managed sites. This involves applying predictive analytics for HVAC system maintenance and using machine learning models for industrial motor performance.
The move toward using digital twins to reduce building energy use and deploying autonomous control systems for manufacturing energy is becoming widespread. Software for optimizing renewable energy integration and AI-driven energy forecasting for utility companies are crucial for grid stability. On-site, real-time load balancing for industrial facilities and edge analytics for remote asset energy monitoring ensure operational resilience.
Demand-side management using machine learning and AI tools for data center cooling efficiency are now standard for high-intensity operations. Securing AI-powered energy management systems is paramount as generative AI in building energy management and cloud-based software for multi-site energy management increase connectivity.
The overarching goals are to enhance grid stability with predictive AI tools, optimize power usage effectiveness with AI, and use AI solutions for reducing transmission losses and optimizing district heating networks with AI.
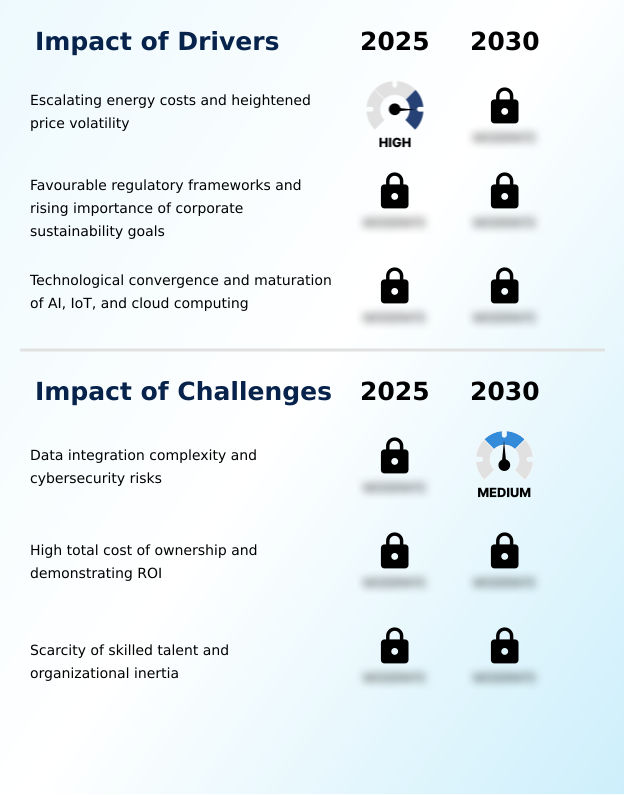
Primary Growth Driver: Escalating energy costs and heightened price volatility are key drivers for market growth, compelling organizations to adopt advanced analytics for financial resilience.
Heightened energy price volatility and stringent corporate sustainability reporting mandates are the primary drivers compelling adoption. With North America exhibiting the highest regional CAGR of 34.8%, companies are investing in AI-powered platforms as a hedge against unpredictable operational costs.
Favorable regulatory frameworks, including carbon pricing and mandatory emissions disclosures, make carbon accounting automation a necessity, not an option.
The technological maturation of industrial IoT integration and cloud-based energy platforms has also lowered the barrier to entry, enabling real-time energy demand forecasting and participation in lucrative demand response programs.
This convergence allows for more effective smart grid management and asset performance management across entire enterprise portfolios, turning energy efficiency into a competitive advantage.
Emerging Market Trend: The emergence of AI-powered digital twins for holistic optimization is a defining market trend, enabling virtual simulation and real-time data analysis to create more balanced and effective energy strategies.
The market is advancing toward hyper-automation, where autonomous building control systems make real-time adjustments without human intervention. This trend is enabled by digital twin simulation, allowing operators to model energy-saving scenarios before implementation, a practice that can reduce cooling energy by over 20% in complex facilities.
The integration of generative AI for energy insights is also democratizing data, enabling non-specialists to query systems for performance metrics. This shift toward intelligent automation is supported by advancements in reinforcement learning control and energy data virtualization, allowing for more holistic optimization.
Adherence to standards like ISO 50001 is driving demand for platforms that provide transparent, auditable data on energy consumption patterns, pushing the industry beyond basic monitoring.
Key Industry Challenge: Data integration complexity and cybersecurity risks present a key challenge to market expansion, creating hurdles for seamless and secure implementation.
A significant challenge impeding market growth is the complexity of data integration, particularly with legacy operational technology, which complicates the deployment of unified sensor data analytics platforms. The scarcity of skilled talent, with a reported 40% increase in demand for green tech specialists with data science skills, drives up labor costs and reliance on external consultants.
Furthermore, demonstrating a clear return on investment remains a hurdle, as high total cost of ownership and the difficulty in isolating the direct impact of AI tools make it challenging to justify significant capital expenditure.
Cybersecurity risks associated with IT/OT convergence and the need for robust zero-trust security architecture add another layer of complexity and cost, creating caution among potential adopters in critical infrastructure sectors.
Explore Full Market Dynamics Analysis Request Free Sample
Ai Energy Efficiency Tools Market Segmentation
The ai energy efficiency tools industry research report provides comprehensive data including region-wise segment analysis, with forecasts and analysis for the period 2026-2030, as well as historical data from 2020-2024 for the following segments.
Component Segment Analysis
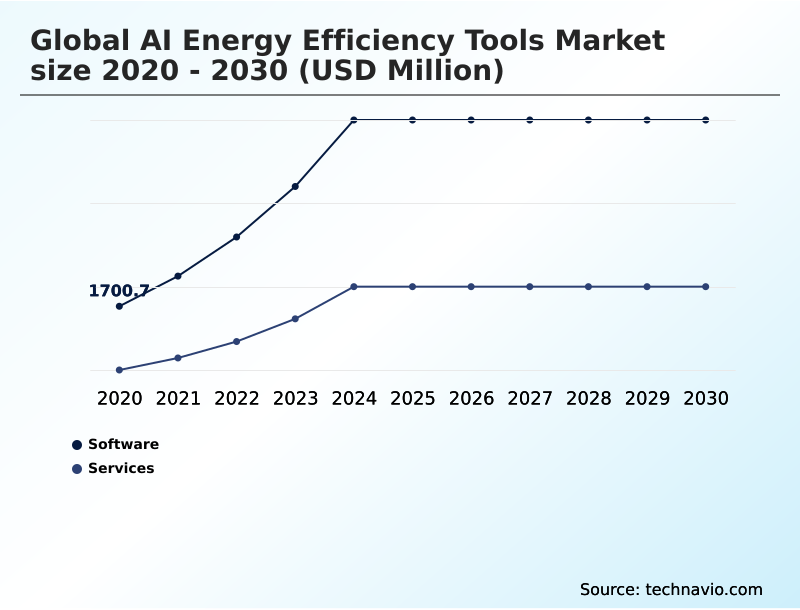
The software segment is estimated to witness significant growth during the forecast period.
The software segment is the primary engine of the global AI energy efficiency tools market 2026-2030, commanding a significant share of procurement budgets over hardware and services.
These deployments, encompassing both cloud-based energy platforms and on-premises data processing, deliver the core machine learning for utilities and industrial energy analytics.
Decision-makers are prioritizing solutions that offer robust energy data visualization and can integrate with legacy building automation systems, a requirement under frameworks like the Corporate Sustainability Reporting Directive.
As evidenced by a 33.2% year-over-year expansion in adoption, the focus is on scalable platforms that provide predictive maintenance algorithms and support sophisticated energy consumption patterns analysis.
The move toward asset performance management is critical for firms aiming to optimize their entire operational footprint.
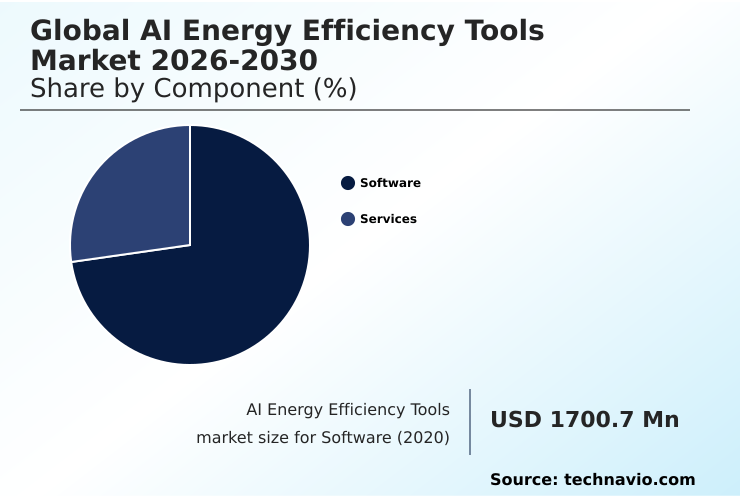
The Software segment was valued at USD 4.81 billion in 2024 and showed a gradual increase during the forecast period.
Ai Energy Efficiency Tools Market by Region: North America Leads with 40.5% Growth Share
North America is estimated to contribute 40.5% to the growth of the global market during the forecast period.

The geographic landscape of the global AI energy efficiency tools market 2026-2030 is led by North America, which accounts for over 40% of the growth, driven by grid modernization software mandates and data center expansion.
In contrast, APAC, contributing 27.6% of the growth, sees adoption centered on smart city infrastructure and industrial IoT integration in manufacturing hubs.
Europe’s 21.37% share is shaped by strict regulatory frameworks like the Corporate Sustainability Reporting Directive, pushing for advanced carbon accounting automation and HVAC optimization in commercial buildings.
Across all regions, the deployment of sensor data analytics is fundamental for enabling predictive maintenance algorithms and improving operational efficiency tools. These regional distinctions in drivers and applications highlight a global market adapting to localized energy challenges and regulatory pressures.
Customer Landscape Analysis for the Ai Energy Efficiency Tools Market
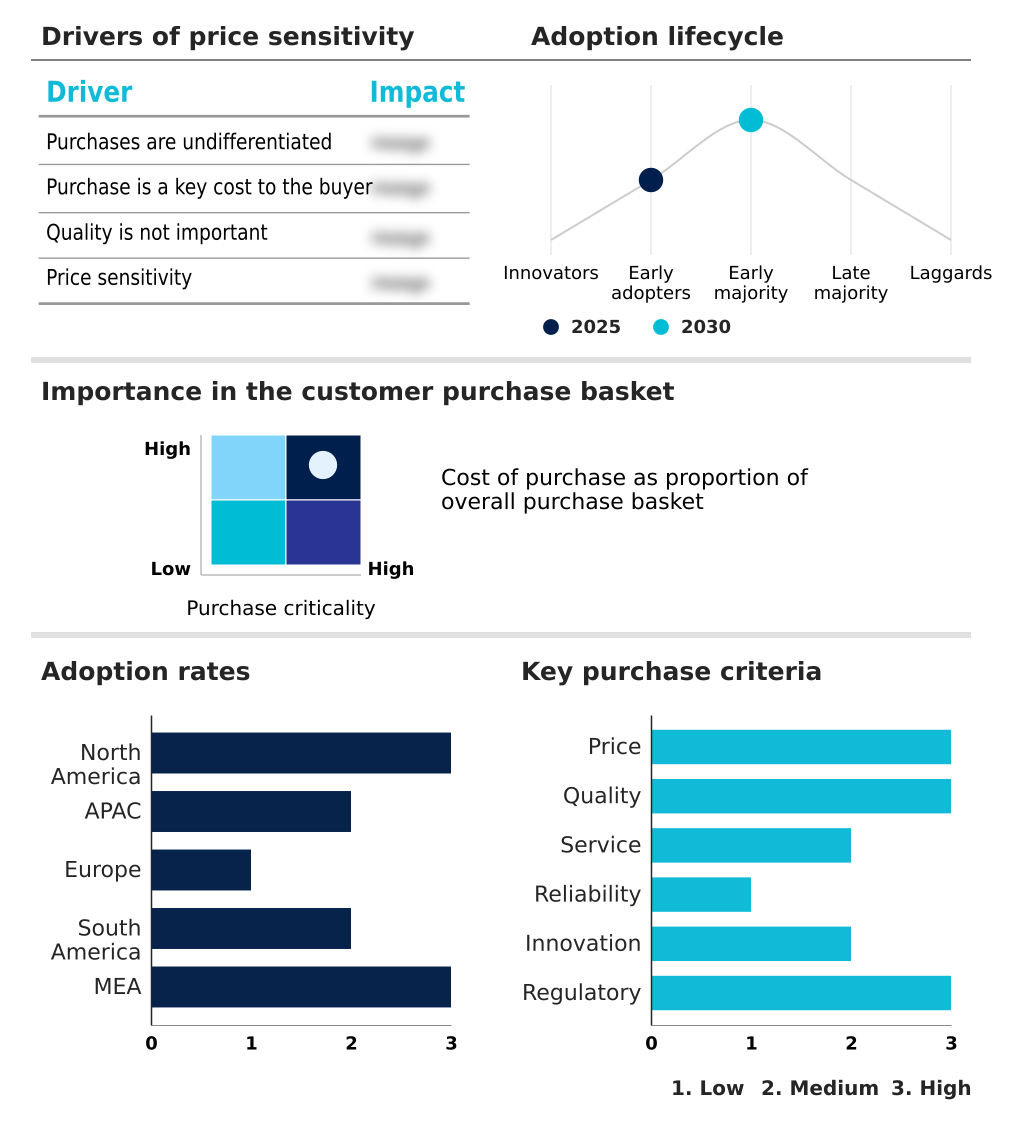
The ai energy efficiency tools market forecasting report includes the adoption lifecycle of the market, covering from the innovator’s stage to the laggard’s stage. It focuses on adoption rates in different regions based on penetration. Furthermore, the ai energy efficiency tools market report also includes key purchase criteria and drivers of price sensitivity to help companies evaluate and develop their market growth analysis strategies.
Competitive Landscape of the Ai Energy Efficiency Tools Market
Companies are implementing various strategies, such as strategic alliances, partnerships, mergers and acquisitions, geographical expansion, and product/service launches, to enhance their presence in the ai energy efficiency tools market industry.
ABB Ltd. - Solutions provide AI-driven analytics, predictive modeling, and automated controls to optimize energy consumption, reduce operational costs, and improve asset performance across industrial and commercial applications.
The industry research and growth report includes detailed analyses of the competitive landscape of the market and information about key companies, including:
- ABB Ltd.
- Amazon.com Inc.
- C3.ai Inc.
- Eaton Corp. Plc
- Enel Spa
- General Electric Co.
- GridPoint Inc.
- Hitachi Ltd.
- Honeywell International Inc.
- Huawei Technologies Co. Ltd.
- IBM Corp.
- Infosys Ltd.
- Johnson Controls International
- Microsoft Corp.
- Mitsubishi Electric Corp.
- Rockwell Automation Inc.
- Schneider Electric SE
- Siemens AG
- Stem Inc.
- Verdigris Technologies Inc.
Qualitative and quantitative analysis of companies has been conducted to help clients understand the wider business environment as well as the strengths and weaknesses of key industry players. Data is qualitatively analyzed to categorize companies as pure play, category-focused, industry-focused, and diversified; it is quantitatively analyzed to categorize companies as dominant, leading, strong, tentative, and weak.
Recent Developments in the Ai Energy Efficiency Tools Market
- In May 2025, Microsoft announced a new milestone in its carbon transparency project, utilizing automated energy tracking to provide suppliers with detailed reports on power consumption and emissions.
- In June 2025, NVIDIA showcased new hardware and software frameworks optimized for running energy demand models at the edge, enabling near-instantaneous decision-making for remote industrial sites.
- In July 2025, Siemens successfully deployed a large-scale digital twin for a major European hospital complex, reducing its annual cooling energy by 25% through advanced airflow simulation and occupancy tracking.
- In August 2025, Honeywell launched a fully autonomous building controller that uses reinforcement learning to manage climate settings based on real-time grid signals and weather forecasts.
Research Analyst Overview: Ai Energy Efficiency Tools Market
Boardroom-level decisions on capital expenditure are now directly influenced by the capabilities of AI-driven energy platforms, moving beyond simple cost-cutting to strategic asset performance management. With North America representing the largest regional market, the impetus comes from both volatile energy prices and frameworks like the US Inflation Reduction Act, which incentivizes investments in distributed energy resources and grid stability solutions.
The software segment's dominance reflects a focus on scalable intelligence, where predictive maintenance algorithms and digital twin simulations are becoming standard for industrial operators. For a CFO, the ability of a system to provide verifiable carbon footprint tracking for ESG reporting is as critical as its capacity for real-time load balancing.
This requires a platform capable of both HVAC optimization and complex energy demand forecasting. Consequently, vendor selection criteria increasingly prioritize solutions offering seamless renewable energy integration, intelligent power management, and microgrid control systems, as these capabilities directly impact long-term operational resilience and compliance with evolving emissions standards.
Dive into Technavio’s robust research methodology, blending expert interviews, extensive data synthesis, and validated models for unparalleled Ai Energy Efficiency Tools Market insights. See full methodology.
| Market Scope | |
|---|---|
| Page number | 303 |
| Base year | 2025 |
| Historic period | 2020-2024 |
| Forecast period | 2026-2030 |
| Growth momentum & CAGR | Accelerate at a CAGR of 34.3% |
| Market growth 2026-2030 | USD 30610.2 million |
| Market structure | Fragmented |
| YoY growth 2025-2026(%) | 33.2% |
| Key countries | US, Canada, Mexico, China, Japan, India, South Korea, Australia, Indonesia, Germany, UK, France, Italy, Spain, The Netherlands, Brazil, Argentina, Chile, Saudi Arabia, UAE, South Africa, Israel and Turkey |
| Competitive landscape | Leading Companies, Market Positioning of Companies, Competitive Strategies, and Industry Risks |
Ai Energy Efficiency Tools Market: Key Questions Answered in This Report
-
What is the expected growth of the Ai Energy Efficiency Tools Market between 2026 and 2030?
-
The Ai Energy Efficiency Tools Market is expected to grow by USD 30.61 billion during 2026-2030, registering a CAGR of 34.3%. Year-over-year growth in 2026 is estimated at 33.2%%. This acceleration is shaped by escalating energy costs and heightened price volatility, which is intensifying demand across multiple end-use verticals covered in the report.
-
-
What segmentation does the market report cover?
-
The report is segmented by Component (Software, and Services), Deployment (Cloud-based, and On-premises), Application (Energy management, Smart grid management, Predictive maintenance, and Building automation) and Geography (North America, APAC, Europe, South America, Middle East and Africa). Among these, the Software segment is estimated to witness significant growth during the forecast period, driven by rising adoption across key application areas. Each segment includes detailed qualitative and quantitative analysis, along with historical data from 2020-2024 and forecasts through 2030 with year-over-year growth rates.
-
-
Which regions are analyzed in the report?
-
The report covers North America, APAC, Europe, South America and Middle East and Africa. North America is estimated to contribute 40.5% to market growth during the forecast period. Country-level analysis includes US, Canada, Mexico, China, Japan, India, South Korea, Australia, Indonesia, Germany, UK, France, Italy, Spain, The Netherlands, Brazil, Argentina, Chile, Saudi Arabia, UAE, South Africa, Israel and Turkey, with dedicated market size tables and year-over-year growth for each.
-
-
What are the key growth drivers and market challenges?
-
The primary driver is escalating energy costs and heightened price volatility, which is accelerating investment and industry demand. The main challenge is data integration complexity and cybersecurity risks, creating operational barriers for key market participants. The report quantifies the impact of each driver and challenge across 2026 and 2030 with comparative analysis.
-
-
Who are the major players in the Ai Energy Efficiency Tools Market?
-
Key vendors include ABB Ltd., Amazon.com Inc., C3.ai Inc., Eaton Corp. Plc, Enel Spa, General Electric Co., GridPoint Inc., Hitachi Ltd., Honeywell International Inc., Huawei Technologies Co. Ltd., IBM Corp., Infosys Ltd., Johnson Controls International, Microsoft Corp., Mitsubishi Electric Corp., Rockwell Automation Inc., Schneider Electric SE, Siemens AG, Stem Inc. and Verdigris Technologies Inc.. The report provides qualitative and quantitative analysis categorizing companies as dominant, leading, strong, tentative, and weak based on their market positioning. Company profiles include business segment analysis, SWOT assessment, key offerings, and recent strategic developments.
-
Ai Energy Efficiency Tools Market Research Insights
Market dynamics are increasingly shaped by regulatory pressures and the need for granular operational control. Compliance with mandates like the Corporate Sustainability Reporting Directive requires robust carbon accounting automation, driving adoption of specialized software.
A clear divergence is seen between deployment models, where the cloud-based segment is outpacing on-premises data processing due to lower upfront costs and easier scalability, a key factor for SMEs. In practice, industrial facilities are deploying sensor data analytics for monitoring energy consumption patterns and enabling demand-side management.
This shift from passive monitoring to active IT/OT convergence allows for real-time peak demand shifting. These operational efficiency tools are essential for participating in energy markets and require a zero-trust security architecture to mitigate cyber risks associated with increased connectivity and smart meter data analysis.
We can help! Our analysts can customize this ai energy efficiency tools market research report to meet your requirements.
 RIA -
RIA - 
